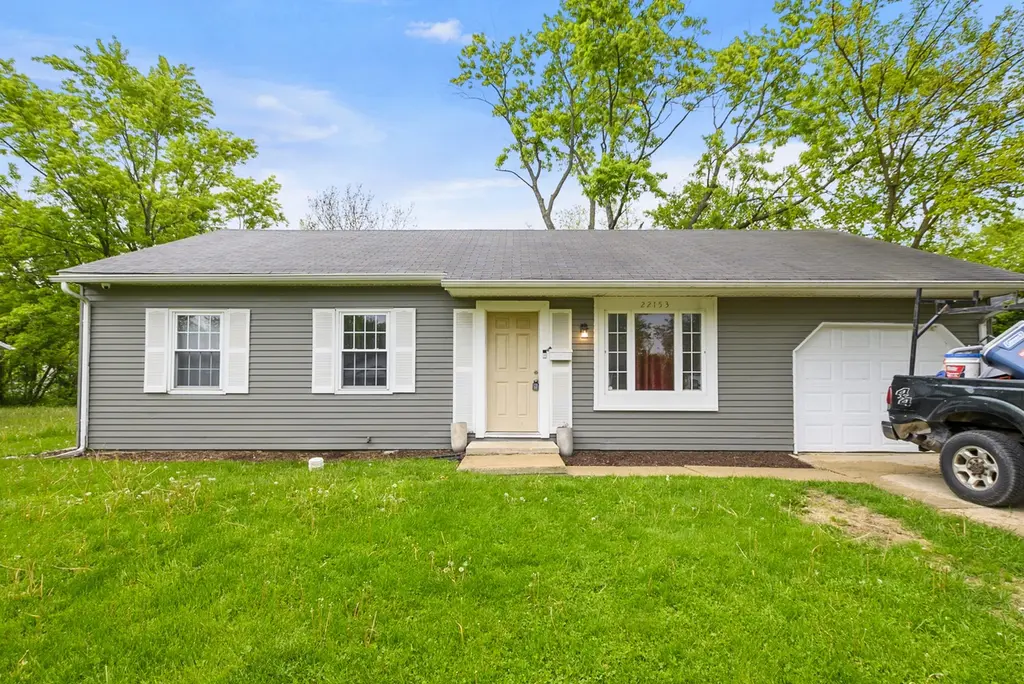
22153 E Churchill Dr · Richton Park, IL
Flood risk 1/10 · Minimal
- FEMA flood zone
- X (unshaded)
- Chance of flooding over 30 yrs
- 0.0%
- Est. flood insurance / yr
- $473 – $860
Fire risk 1/10 · Minimal
- Est. fire insurance / yr
- $804 – $1,492
Heat risk 3/10 · Minor
- Hot days now (above 101°F)
- 7 days/yr
- Hot days in 30 yrs
- 16 days/yr
Wind risk 2/10 · Minimal
- Chance of severe wind over 30 yrs
- —
Air-quality risk 2/10 · Minimal
- Unhealthy air days now
- 1 days/yr
- Unhealthy air days in 30 yrs
- 1 days/yr
Risk factors via First Street. Map © Google.
Why this score? — see what drove the D grade
The composite is a weighted blend of 9 inputs, each scored 0–100. Each bar is that input's sub-score; the figure is the points it added to the 100-point composite (weight × sub-score).
- Cash flow +17.2/30.0
- DSCR +5.4/10.0
- 1% rule +4.9/10.0
- ARV discount +4.0/15.0
- Livability +3.5/5.0
- Rent growth +2.5/5.0
- Condition / age +2.5/5.0
- Schools +0.9/10.0
- Appreciation +0.0/10.0
$167,000
🖨 Deal sheet 📄 Offer letter ✓ Due diligence
Listing remarks
This Listing is being sold AS IS Beautifully Maintained Home since 2023. This 3 Bedroom, 1 Bath Ranch is fresh & bright! New Oak Cabinets and New Appliances, New Bathroom, New Fresh Paint! Updated Windows, Utility/Mud room w/ W & D hook up. Newer Furnace, Air Conditioner, Furnace and Water Heater (2020). Nice yard with Newer Patio for family enjoyment & pets! Close to I-57, train station, school, and shops as well as a gorgeous park within walking distance - but set in a quiet neighborhood. Schedule your showing today!
Key facts
- Newer patio
- Utility mud room
- New oak cabinets
Tags
Property features AI
Finance
- Other: Parcel number available; Property not currently leased
- HOA & community: No master association fee required
Exterior
- Parking: Attached garage (garage owned) with concrete driveway — 1 garage/total parking space
- Utilities: Public water; Public sewer
- Home design: Detached single-family home; One-story; Fee simple ownership; Rehab completed in 2020; Built before 1978
- Construction: Vinyl siding; Asphalt roof; Concrete perimeter foundation; Estimated age: 51–60 years
- Exterior features: Patio; Curb, sidewalk, street lights, and paved streets
Interior
- Kitchen: Eating area / table space
- Bedrooms: Three bedrooms (all on main level)
- Flooring: Laminate flooring in living room and bedrooms
- Bathrooms: One full bathroom
- Heating & cooling: Natural gas forced-air heating; Central air conditioning
- Interior features: First-floor bedroom; First-floor full bathroom; Six total rooms
- Laundry & utility: Main-level laundry
Neighborhood map
What this means for you Summary
Snapshot
- This is a 3-bed/1.0-bath single-family listed at $167k.
Deal economics
- At list price, monthly cash flow is $119 ($1k/yr) — positive.
- The deal already cash-flows at list — no discount required.
- To meet the 1% rule (rent ≥ 1% of price), the offer needs to be $165k (1.3% below list).
- Recommended offer: $162k (3.0% below list) — sets the bar for market timing.
- Cap rate 7.1% vs local median 4.3% in Richton Park — top-decile yield for the area; either an underpriced asset or a hidden risk that comps aren't pricing in. Stress-test before assuming the spread holds.
Location & tenants
- Location reads 69/100 on livability (#415 in IL) — a middle-class / working-renter tenant base. Strengths: cost of living A+, housing A+, employment B; Watch: crime C-, schools D+, amenities F.
- Rich Twp Hsd 227 (suburban): math 5% / reading 12% proficiency, ranked #577 of 620 in IL (top 93%) — low school quality limits family demand, transient renter base, plan for 1-2y turnover.
- Market conditions: 44 active listings in the ZIP; 11 comparable units currently listed for rent nearby; rentals leasing fast (median 7d on market — plan ~1-2 weeks tenant-placement turnaround); 6,272 units permitted in Cook County in 2024 (4,658 in 5+ unit buildings).
- This rent runs 31% of the median local income ($64k/yr) — at the standard rent-burdened threshold; future hikes will face affordability resistance.
Forward outlook
- Local home prices are declining (-3.0%/yr); year-one equity from $1k of loan paydown is wiped out by about $5k of value loss. Plan a longer hold.
Negotiation context
- It's been on market 35 days — a 3% lower offer ($162k) is reasonable based on typical stale-listing flexibility.
- 4 sale attempts since 8y ago with the ask held roughly flat each time — persistent listings suggest the price (not the market) is what's stuck; bring a comps-based counter.
- Current owner paid $110k; list at $167k implies a 52% gain — meaningful room to come down on a strong offer.
Questions for the listing agent
- It's been on market 35 days. Have you received any prior offers? Is the seller open to a 3% concession, seller financing, or rate buy-down credit?
- Built in 1971 — when were the roof, HVAC, electrical panel, plumbing, and water heater last replaced?
- Is there a deadline driving the sale (1031 exchange, divorce, estate, relocation)? That informs how much negotiation room exists.
- Schools are D-rated, which usually means shorter tenancies and higher turnover. Who's the typical renter profile here, and what's been the actual vacancy rate?
- The area grade is low — what's the realistic commute time and amenity access for the typical tenant pool here? Any planned neighborhood developments (good or bad) we should know about?
- What's the average days-on-market for RENTAL listings here right now (not sales)? A rising rental-DOM trend means longer vacancies and softer asking-rent achievability than the comps imply.
- What's the recent tenant-quality profile in this submarket — average credit score on applications, eviction rate, late-payment / NSF rate, and stable-employment percentage? A property-management company in the area should have these aggregated.
- How much new for-sale + rental construction is in the pipeline within 1–3 miles? Heavy new supply typically softens prices + rents 12–24 months out; constrained supply supports both.
Investment metrics
- 1% rule
- 0.99% ✗
- Cap rate
- 7.15%
- Cash-on-cash
- 3.06%
- DSCR
- 1.14
- GRM
- 8.4
CMA / ARV
- ARV (on-the-fly)
- $154,850
- Comps found
- 12
Show comp detail 12 sales within ~0.75 mi
| Address | Dist | Beds/Ba | Sqft | Sold | Price | $/sf | Match |
|---|---|---|---|---|---|---|---|
| 4458 Poplar Ave | 0.16mi | 3/1.0 | 950 (0%) | 10mo | $155,000 | $163 | 84 |
| 4520 Keenehand Ct | 0.16mi | 3/1.0 | 925 (-3%) | 6mo | $164,900 | $178 | 84 |
| 22204 Kostner Ave | 0.04mi | 3/1.0 | 900 (-5%) | 10mo | $105,000 | $117 | 81 |
| 22118 E Churchill Dr | 0.07mi | 3/1.5 | 912 (-4%) | 10mo | $95,200 | $104 | 80 |
| 21943 E Churchill Dr | 0.26mi | 3/1.0 | 925 (-3%) | 6mo | $115,000 | $124 | 78 |
| 4627 Saratoga Rd | 0.31mi | 3/1.0 | 931 (-2%) | 5mo | $88,000 | $95 | 78 |
| 4443 Ascot Ct | 0.23mi | 4/1.5 (+1) | 912 (-4%) | 0mo | $180,000 | $197 | 75 |
| 22153 Rockingham Rd | 0.27mi | 3/1.5 | 917 (-4%) | 8mo | $210,000 | $229 | 73 |
| 22200 Windsor Ct | 0.24mi | 4/1.5 (+1) | 1,000 (+5%) | 1mo | $185,000 | $185 | 72 |
| 4235 Poplar Ave | 0.22mi | 3/1.0 | 900 (-5%) | 11mo | $110,000 | $122 | 72 |
| 22139 Belmont Rd | 0.33mi | 3/1.0 | 1,005 (+6%) | 8mo | $155,000 | $154 | 68 |
| 4534 Saratoga Rd | 0.20mi | 3/1.5 | 845 (-11%) | 12mo | $180,000 | $213 | 60 |
Match score weights: distance 35% · size 25% · config 20% · recency 20%. Top-matched comps best support the ARV.
Projected returns pro-forma
-3.0% appreciation · 3.0% rent growth · sell at horizon
- IRR
- -11.5%
- Equity multiple
- 0.58×
- Total profit
- $-19,436
- Equity at exit
- $24,900
- IRR
- -2.2%
- Equity multiple
- 0.85×
- Total profit
- $-6,988
- Equity at exit
- $14,439
Cash invested: $46,760 (down + closing). Projections, not guarantees.
Landlord ↔ Tenant lean methodology
- Overall (STATE)
- 43 Moderately Tenant-Leaning
- State Illinois
- 43 Moderately Tenant-Leaning · D+7
- County
- — inherits STATE
- City
- — inherits STATE
ZIP-level market 60471
- Home prices YoY
- -17.5%
- Active inventory
- 44
- Price-to-rent
- 8.4×
Monthly cashflow live
- Estimated rent
- $1,648 high interval (Pro) →
- Mortgage (P&I)
- −$876
- Tax from tax record
- −$237 /mo · $2,850/yr
- Insurance
- −$70
- HOA
- −$0
- Vacancy / Maint / Mgmt
- −$346
- Net cashflow
- $119
Break-even live
UW: 25.0% down · 7.5% · 30yr · 1.5% tax · 5.0% vac · 8.0% maint · 8.0% mgmt
Financing live
Cash to close
- Down payment
- $41,750
- Closing costs
- $5,010
- Reserves months
- —
- Total cash needed
- —
Loan-product check · same deal, 3 products live
Conventional
25% down · 7.5% · 30yr
- Down + closing
- —
- Monthly P&I
- —
- Monthly cashflow
- —
- DSCR
- —
- Eligible?
- —
Personal DTI + credit; lowest rate.
DSCR
20% down · 8.5% · 30yr
- Down + closing
- —
- Monthly P&I
- —
- Monthly cashflow
- —
- DSCR
- —
- Eligible?
- —
No personal income docs; deal must DSCR.
Hard money
10% down · 12.0% · 12mo
- Down + closing
- —
- Monthly P&I
- —
- Monthly cashflow
- —
- DSCR
- —
- Eligible?
- —
Short-term bridge; refi at stabilization.
Rent comps 11 comps
| Address | Beds | Baths | Sqft | Rent | $/sqft | DOM | Units | Dist |
|---|---|---|---|---|---|---|---|---|
| 22501 Butterfield Rd Unit 22411-514 Richton Park, IL | 2.0 | 1.5 | 1021 | $1,365 | $1.34 | 7d | 1 | 0.37mi |
| 22501 Butterfield Rd Unit 22411-506 Richton Park, IL | 2.0 | 1.0 | 882 | $1,325 | $1.50 | 7d | 1 | 0.37mi |
| 22501 Butterfield Rd Unit 22400-311 Richton Park, IL | 2.0 | 1.0 | 882 | $1,360 | $1.54 | 7d | 1 | 0.37mi |
| 22501 Butterfield Rd Unit 22419-109 Richton Park, IL | 2.0 | 1.0 | 798 | $1,310 | $1.64 | 7d | 1 | 0.37mi |
| 22501 Butterfield Rd Unit 22415-207 Richton Park, IL | 2.0 | 1.5 | 944 | $1,360 | $1.44 | 7d | 1 | 0.37mi |
| 3905 Tower Dr Richton Park, IL | 1.0–2.0 | 1.0–2.0 | 905 | $1,795 | $1.98 | 1d | 19 | 0.64mi |
| 4014 Euclid Ln Richton Park, IL | 2.0 | 1.0 | 1100 | $2,100 | $1.91 | 22d | 1 | 0.78mi |
| 4014 Euclid Ln Richton Park, IL | 3.0 | 1.0 | 1100 | $2,100 | $1.91 | 12d | 1 | 0.78mi |
| 4014 Euclid Ln Richton Park, IL | 2.0 | 1.0 | 1100 | $2,100 | $1.91 | 7d | 1 | 0.78mi |
| 4561 Heartland Dr Unit 3F Richton Park, IL | 2.0 | 1.0 | 1000 | $1,350 | $1.35 | 24d | 1 | 0.79mi |
| 4020 216th St Unit 2E Matteson, IL | 3.0 | 1.0 | 600 | $2,000 | $3.33 | 24d | 1 | 0.94mi |
Listing history 22 events
-
2026-06-18days on market $167,000 Active 35 DOM
-
2026-06-17days on market $167,000 Active 34 DOM
-
2026-06-16days on market $167,000 Active 33 DOM
-
2026-06-15days on market $167,000 Active 32 DOM
-
2026-06-13days on market $167,000 Active 30 DOM
-
2026-06-09days on market $167,000 Active 26 DOM
-
2026-06-08days on market $167,000 Active 25 DOM
-
2026-06-07days on market $167,000 Active 24 DOM
-
2026-06-04days on market $167,000 Active 21 DOM
-
2026-06-03days on market $167,000 Active 20 DOM
-
2026-06-02days on market $167,000 Active 19 DOM
-
2026-06-01days on market $167,000 Active 18 DOM
-
2026-05-31days on market $167,000 Active 17 DOM
-
2026-05-13$167,000 Active
-
2020-10-30soldstatus $110,000
-
2020-06-01status Contingent
-
2020-05-03New
-
2020-04-10historical
-
2019-10-15New
-
2019-01-11soldstatus $32,000 Closed Sale
-
2018-11-02status Pending
-
2018-11-01$32,000 New
ⓘ Source: listings_history table (triggers on properties + properties_extension) + one-shot
backfill from property_details.listing_events for pre-trigger history.
Tax reassessment forecast IL · Partial reset (capped growth)
- Current annual tax
- $2,850 · $237/mo
- Projected year-2 tax
- $3,320 · $277/mo
- Expected delta
- +$471/yr (+$39/mo · 16.5%)
ⓘ Screening estimate from a state-policy table — verify with the county assessor before closing.
Climate risk First Street
- Flood 1/10 Low FEMA zone X (unshaded) · 0% chance over 30 yrs
- Wildfire 1/10 Low
- Heat 3/10 Moderate 7 d/yr ≥101°F today · 16 d/yr by 30 yrs out
- Wind 2/10 Low
- Air quality 2/10 Low 1 unhealthy d/yr today · 1 by 30 yrs out
Nearby sold comps map
Loading sold comps map…
Walkable amenities ~0.75 mi
Loading nearby amenities…
Taxation est. · year 1
- Rental income
- $19,775
- − Mortgage interest
- −$9,355
- − Property taxes
- −$2,850
- − Insurance
- −$835
- − Repairs & maintenance
- −$1,582
- − Management
- −$1,582
- − Depreciation
- −$4,858
- Taxable loss
- −$1,286
- Est. tax savings @ 24.0%
- +$309
- After-tax cash flow
- $1,737/yr
For passive investors: Depreciation is non-cash, so a rental often shows a tax loss while cash-flowing — sheltering income. Rental losses are passive: they offset passive income freely, and up to $25,000/yr can offset ordinary (W-2) income if you actively participate and your MAGI is under $100k (phasing out to $0 by $150k); unused losses carry forward. On sale, claimed depreciation is recaptured at up to 25%, and gains may owe capital-gains tax (a 1031 exchange can defer both). Figures are a year-1 estimate at your 24.0% rate — not tax advice; consult a CPA.
Schools (NCES district)
- District
- Rich Twp Hsd 227
- NCES district ID
- 1733420
- Math proficiency
- 5% ▼ -3.00%
- Reading proficiency
- 12% ▬ 0.00%
- Median HH income
- $56,056
- Composite
- 8.93/100
- National rank
- #9885
- State rank
- #577 of 620 in IL
Livability — Richton Park
- Score
- 69/100
- State rank
- #415
- US rank
- #8530
Category grades
Schools grade is shown separately in the Schools card above.
Census & demographics
- Census place
- Richton Park, IL
- County
- Cook County · 4,486,803 people
- City population
- 12,848
- Metro
- Chicago-Naperville-Elgin, IL-IN-WI
- Population (ZIP)
- 12,848
- Household income
- $64,494
- Rent vs Own
- Severe rent burden
- 799.0
Population outlook (Cook County) Hauer SSP2
- Today (2025)
- 5,347,519 people
- By 2030
- 5,357,703 · +0.2%
- By 2040
- 5,324,924 · -0.4%
- By 2050
- 5,230,762 · -2.2%
- By 2075
- 4,785,735 · -10.5%
- By 2100
- 4,188,836 · -21.7%
Race, ethnicity, and origin ACS 2023
- Neighborhood character
- Predominantly Black (88%)
- Race & ethnicity
- Black 88% White 7% Hispanic / Latino 2% Two or more races 1%
- Common ancestry
- Romanian 1%
- Foreign-born
- 3% · Canada
- Languages at home
- 94% English-only · Spanish 3% French/Haitian/Cajun 1% German/W. Germanic 1%
Political lean MEDSL · Cook
- 2024 margin
- Solid D (+42.0) · D 70.4% · R 28.4% · Other 1.2%
- 2008→2024 swing
- -11.4pp toward R · 2008: 53.4pp · 2024: 42.0pp
- All cycles
- 2024: D+42.0 2020: D+50.3 2016: D+53.0 2012: D+49.4 2008: D+53.4
Not yet ingested
- Civics
- —
Market trends
- HPI YoY
- ▼ -48.01%
- Current HPI
- 226.6786
- Rent YoY
- —
- Metro
- Chicago-Naperville-Elgin, IL-IN-WI
- State GDP YoY
- ▲ 1.59%
- F500 in state
- 60
Industry mix (Fortune 500 HQ in IL)
| Industry | F500 HQs | Revenue |
|---|---|---|
| Insurance | 4 | $201B |
|
||
| Consumer Goods | 4 | $87B |
|
||
| Industrial Machinery | 3 | $64B |
|
||
| Healthcare | 2 | $55B |
|
||
| Retail / Pharmacy | 1 | $148B |
|
||
| Agriculture / Food | 1 | $86B |
|
||
Price history
+421.9% since first listed9 events — show timeline
- 2026-05-13 Listed $167,000 MRED as Distributed by MLS Grid
- 2020-10-30 Sold (Public Records) $110,000 Public Records
- 2020-06-01 Pending — MRED as Distributed by MLS Grid
- 2020-05-03 Listed — MRED as Distributed by MLS Grid
- 2020-04-10 Listing Removed — MRED as Distributed by MLS Grid
- 2019-10-15 Listed — MRED as Distributed by MLS Grid
- 2019-01-11 Sold (MLS) $32,000 MRED as Distributed by MLS Grid
- 2018-11-02 Pending — MRED as Distributed by MLS Grid
- 2018-11-01 Listed $32,000 MRED as Distributed by MLS Grid
Property tax history
+2.9%/yrLatest (2023): $2,850 · +96.9% YoY. Source: county tax records.
Cash-flow waterfall
monthlySold comps — $/sqft
last 12 mo · ≤1 miLoading sold comps…