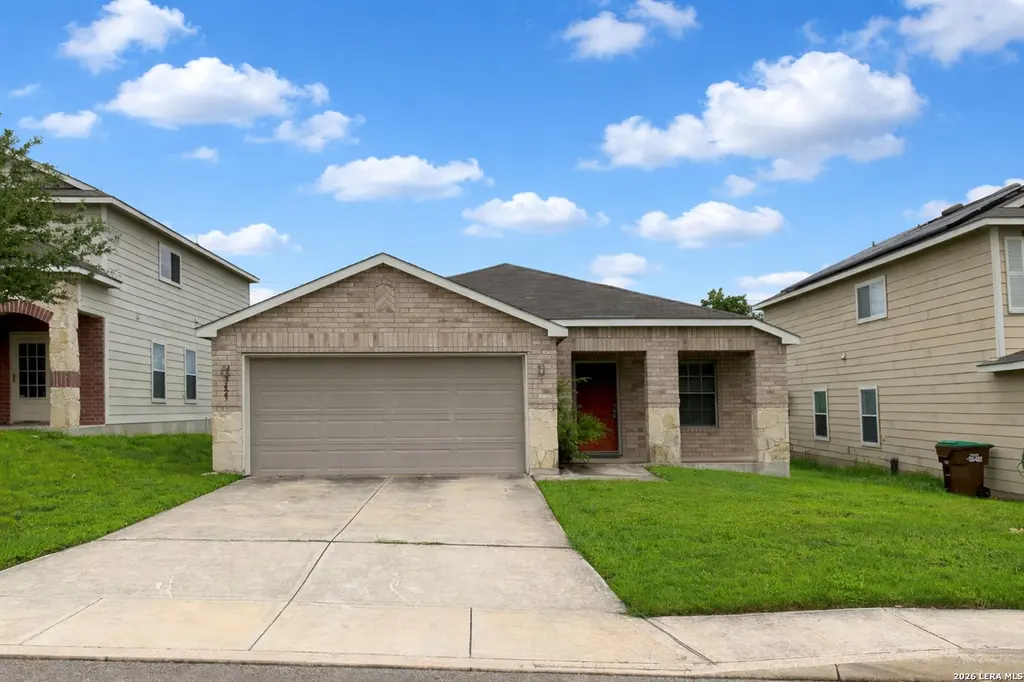
3423 Bisley · San Antonio, TX
Flood risk 1/10 · Minimal
- FEMA flood zone
- X (unshaded)
- Chance of flooding over 30 yrs
- 0.0%
- Est. flood insurance / yr
- $507 – $1,088
Fire risk 5/10 · Moderate
- Est. fire insurance / yr
- $1,222 – $2,270
Heat risk 8/10 · Major
- Hot days now (above 110°F)
- 7 days/yr
- Hot days in 30 yrs
- 22 days/yr
Wind risk 7/10 · Major
- Chance of severe wind over 30 yrs
- 78.0%
Air-quality risk 2/10 · Minimal
- Unhealthy air days now
- 1 days/yr
- Unhealthy air days in 30 yrs
- 1 days/yr
Risk factors via First Street. Map © Google.
Why this score? — see what drove the D grade
The composite is a weighted blend of 9 inputs, each scored 0–100. Each bar is that input's sub-score; the figure is the points it added to the 100-point composite (weight × sub-score).
- ARV discount +14.6/15.0
- Cash flow +9.4/30.0
- Livability +4.0/5.0
- 1% rule +3.6/10.0
- DSCR +2.7/10.0
- Condition / age +2.5/5.0
- Schools +2.2/10.0
- Rent growth +1.7/5.0
- Appreciation +0.0/10.0
$199,900
🖨 Deal sheet (PDF) 📄 Offer letter ✓ Due diligence
Listing remarks MLS
Great 3 bedroom, 2 bath, well maintained single story home! Features include a built-in microwave, flat top stove and a good size backyard. Nice subdivision in a convenient location with easy access to Loop 1604, Hwy 90 and Lackland AFB. This is a must see!
Key facts
- Flat top stove
- Good size backyard
- Convenient location
Tags
Neighborhood map
What this means for you Summary
Snapshot
- This is a 3-bed/2.0-bath single-family listed at $200k.
Deal economics
- At list price, monthly cash flow is $-141 ($-2k/yr) — negative.
- To cash-flow at today's rent, offer at most $175k (12.5% below list).
- To meet the 1% rule (rent ≥ 1% of price), the offer needs to be $173k (13.6% below list).
- Recommended offer: $173k (13.6% below list) — sets the bar for 1% rule.
- Cap rate 5.4% vs local median 3.8% in San Antonio — top-decile yield for the area; either an underpriced asset or a hidden risk that comps aren't pricing in. Stress-test before assuming the spread holds.
Location & tenants
- Location reads 80/100 on livability (#31 in TX, #1,616 nationally) — a professional / high-income tenant draw. Strengths: amenities A+, commute A+, cost of living A+; Watch: crime F.
- Southwest ISD (rural): math 21% / reading 31% proficiency, ranked #701 of 826 in TX (top 85%) — low school quality limits family demand, transient renter base, plan for 1-2y turnover; 75% free/reduced lunch — lower-income household profile, screen leases tightly.
- Zoned schools: Kriewald Rd El (math 33% / reading 45%, grade F, #1,651 of 4,322 statewide, top 39%, 520 students, 72% FRL); Francis R Scobee Middle (math 23% / reading 30%, grade F, #1,200 of 1,662 statewide, top 73%, 856 students, 73% FRL); Southwest H S (math 17% / reading 39%, grade F, #1,170 of 1,632 statewide, top 72%, 2,152 students, 72% FRL) — zoned schools at 73% FRL track the district average.
- Market conditions: Rents falling (-3.0%/yr); 1172 active listings in the ZIP; 40 comparable units currently listed for rent nearby; rentals at typical pace (median 26d on market — plan ~3-4 weeks tenant-placement turnaround); solid renter incomes; 8,308 units permitted in Bexar County in 2024 (2,506 in 5+ unit buildings).
Forward outlook
- Local home prices are declining (-3.0%/yr); year-one equity from $1k of loan paydown is wiped out by about $6k of value loss. Plan a longer hold.
- Bexar County population projected at +50% by 2050 — long-run rental-demand tailwind backs the buy-and-hold thesis.
Negotiation context
- It's been on market 94 days — a 9% lower offer ($182k) is reasonable based on typical stale-listing flexibility.
- 4 sale attempts since 3y ago; this cycle's ask has dropped $20k (9%) from the opening price — seller is motivated, your offer sets the floor, not the list.
Risks & watch-outs
- Climate carrying-cost: major wind risk, 78% chance of damaging wind over 30y; moderate wildfire risk; extreme-heat days projected 7→22/yr by 2055 (HVAC capex compounding) — expect insurance premiums to compound above CPI over the hold.
Questions for the listing agent
- What do current leases actually rent for vs. the listed asking? Can we see a recent rent roll and the last 12 months of T-12 income?
- It's been on market 94 days. Have you received any prior offers? Is the seller open to a 14% concession, seller financing, or rate buy-down credit?
- What does the HOA fee cover, when was the last increase, and are there any pending special assessments or reserve-fund shortfalls?
- Why hasn't it sold? Are there any deal-killer items the seller is aware of (foundation, flood, title, zoning, code violations)?
- Is there a deadline driving the sale (1031 exchange, divorce, estate, relocation)? That informs how much negotiation room exists.
- Crime grade is F in this area — have there been break-ins, vandalism, or insurance claims at this property in the last 3 years? What carrier currently insures it and at what premium?
- The area grade is low — what's the realistic commute time and amenity access for the typical tenant pool here? Any planned neighborhood developments (good or bad) we should know about?
- What's the average days-on-market for RENTAL listings here right now (not sales)? A rising rental-DOM trend means longer vacancies and softer asking-rent achievability than the comps imply.
- What's the recent tenant-quality profile in this submarket — average credit score on applications, eviction rate, late-payment / NSF rate, and stable-employment percentage? A property-management company in the area should have these aggregated.
- How much new for-sale + rental construction is in the pipeline within 1–3 miles? Heavy new supply typically softens prices + rents 12–24 months out; constrained supply supports both.
Investment metrics
- 1% rule
- 0.86% ✗
- Cap rate
- 5.45%
- Cash-on-cash
- -3.03%
- DSCR
- 0.87
- GRM
- 9.6
CMA / ARV
- ARV (median comp)
- $237,303
- List price
- $199,900
- Delta
- -15.76%
- Verdict
- UNDERPRICED
- Comps
- 20 within 1.0 mi
Show comp detail 12 sales within ~0.75 mi
| Address | Dist | Beds/Ba | Sqft | Sold | Price | $/sf | Match |
|---|---|---|---|---|---|---|---|
| 11344 Silver Rose | 0.44mi | 3/2.0 | 1,520 (+7%) | 1mo | $257,000 | $169 | 66 |
| 2515 Westgard | 0.46mi | 3/2.5 | 1,501 (+6%) | 4mo | $214,890 | $143 | 63 |
| 2938 Wentwood | 0.64mi | 3/2.0 | 1,446 (+2%) | 4mo | $250,000 | $173 | 63 |
| 11339 Jarbo Pass | 0.74mi | 3/2.0 | 1,398 (-1%) | 3mo | $225,000 | $161 | 61 |
| 11410 Hatchet Pass | 0.68mi | 3/1.0 | 1,375 (-3%) | 3mo | $134,900 | $98 | 57 |
| 11142 Bold Forbes | 0.46mi | 4/2.0 (+1) | 1,524 (+8%) | 5mo | $239,900 | $157 | 57 |
| 10906 Rosin Jaw | 0.65mi | 3/2.0 | 1,521 (+8%) | 1mo | $214,000 | $141 | 56 |
| 11014 Rosin Jaw Trl | 0.67mi | 3/2.0 | 1,528 (+8%) | 3mo | $229,000 | $150 | 53 |
| 3130 Smoke | 0.72mi | 3/2.0 | 1,329 (-6%) | 5mo | $199,700 | $150 | 52 |
| 11406 Clints Wl | 0.64mi | 3/2.0 | 1,248 (-12%) | 1mo | $135,000 | $108 | 50 |
| 11331 Yuba | 0.74mi | 3/2.5 | 1,523 (+8%) | 2mo | $199,900 | $131 | 50 |
| 11339 Yuba Trl | 0.72mi | 3/2.0 | 1,271 (-10%) | 2mo | $219,000 | $172 | 48 |
Match score weights: distance 35% · size 25% · config 20% · recency 20%. Top-matched comps best support the ARV.
Projected returns pro-forma
-3.0% appreciation · 0.0% rent growth · sell at horizon
- IRR
- -25.0%
- Equity multiple
- 0.17×
- Total profit
- $-46,344
- Equity at exit
- $29,806
- IRR
- -35.6%
- Equity multiple
- -0.27×
- Total profit
- $-71,084
- Equity at exit
- $17,284
Cash invested: $55,972 (down + closing). Projections, not guarantees.
Landlord ↔ Tenant lean methodology
- Overall (STATE)
- 87 Strongly Landlord-Friendly
- State Texas
- 87 Strongly Landlord-Friendly · R+5
- County
- — inherits STATE
- City
- — inherits STATE
ZIP-level market 78245
- Home prices YoY
- -18.5%
- Rents YoY
- -3.0%
- Active inventory
- 1172
- Price-to-rent
- 9.6×
Monthly cashflow live
- Estimated rent
- $1,728 high interval (Pro) →
- Mortgage (P&I)
- −$1,048
- Tax from tax record
- −$345 /mo · $4,134/yr
- Insurance
- −$83
- HOA
- −$30
- Vacancy / Maint / Mgmt
- −$363
- Net cashflow
- $-141
Break-even live
Sensitivity live
| Price | -10% $-28 | -5% $-85 | +0% $-141 | +5% $-198 | +10% $-254 |
|---|---|---|---|---|---|
| Rent | -10% $-278 | -5% $-209 | +0% $-141 | +5% $-73 | +10% $-5 |
| Rate | -1.0pp $-40 | -0.5pp $-90 | base $-141 | +0.5pp $-193 | +1.0pp $-246 |
UW: 25.0% down · 7.5% · 30yr · 1.5% tax · 5.0% vac · 8.0% maint · 8.0% mgmt
Financing live
Cash to close
- Down payment
- $49,975
- Closing costs
- $5,997
- Reserves months
- —
- Total cash needed
- —
Loan-product check · same deal, 3 products live
Conventional
25% down · 7.5% · 30yr
- Down + closing
- —
- Monthly P&I
- —
- Monthly cashflow
- —
- DSCR
- —
- Eligible?
- —
Personal DTI + credit; lowest rate.
DSCR
20% down · 8.5% · 30yr
- Down + closing
- —
- Monthly P&I
- —
- Monthly cashflow
- —
- DSCR
- —
- Eligible?
- —
No personal income docs; deal must DSCR.
Hard money
10% down · 12.0% · 12mo
- Down + closing
- —
- Monthly P&I
- —
- Monthly cashflow
- —
- DSCR
- —
- Eligible?
- —
Short-term bridge; refi at stabilization.
Rent comps 40 comps
| Address | Beds | Baths | Sqft | Rent | $/sqft | DOM | Units | Dist |
|---|---|---|---|---|---|---|---|---|
| 10943 Livewater Trl San Antonio, TX | 3.0 | 2.5 | 1812 | $1,900 | $1.05 | 26d | 1 | 0.12mi |
| 10919 Livewater Trl San Antonio, TX | 3.0 | 2.5 | 1812 | $1,595 | $0.88 | 45d | 1 | 0.14mi |
| 11215 Aristides San Antonio, TX | 4.0 | 2.0 | 1520 | $1,925 | $1.27 | 6d | 1 | 0.27mi |
| 10707 Rimfire Run Ln San Antonio, TX | 3.0 | 2.5 | 1680 | $1,575 | $0.94 | 26d | 1 | 0.31mi |
| 3735 Browning Blf San Antonio, TX | 3.0 | 2.5 | 1564 | $1,475 | $0.94 | 6d | 1 | 0.35mi |
| 11328 Silver Rose San Antonio, TX | 3.0 | 2.0 | 1691 | $1,870 | $1.11 | 45d | 1 | 0.40mi |
| 3839 Browning Blf San Antonio, TX | 3.0 | 2.0 | 1566 | $1,899 | $1.21 | 45d | 1 | 0.44mi |
| 11348 Top Hat San Antonio, TX | 3.0 | 2.0 | 1658 | $1,775 | $1.07 | 45d | 1 | 0.48mi |
| 10909 Charreada Trl San Antonio, TX | 3.0 | 2.0 | 1739 | $1,800 | $1.04 | 26d | 1 | 0.49mi |
| 11510 Hatchet Pass Dr San Antonio, TX | 3.0 | 2.0 | 1385 | $2,000 | $1.44 | 26d | 1 | 0.56mi |
| 2422 Buffalo Pass Dr San Antonio, TX | 3.0 | 2.5 | 1500 | $1,500 | $1.00 | 45d | 1 | 0.57mi |
| 2923 Black River Ln San Antonio, TX | 3.0 | 2.0 | 1251 | $1,520 | $1.22 | 45d | 1 | 0.60mi |
| 2730 Bear Springs Dr San Antonio, TX | 3.0 | 2.0 | 1582 | $1,650 | $1.04 | 16d | 1 | 0.70mi |
| 2917 Wentwood Run San Antonio, TX | 4.0 | 2.0 | 1650 | $1,825 | $1.11 | 18d | 1 | 0.70mi |
| 3011 Lindenwood Way San Antonio, TX | 3.0 | 2.5 | 1700 | $1,955 | $1.15 | 26d | 1 | 0.72mi |
| 11323 Pink Star San Antonio, TX | 3.0 | 2.0 | 1695 | $1,675 | $0.99 | 0d | 1 | 0.72mi |
| 2730 Mud Lake Dr San Antonio, TX | 3.0 | 2.0 | 1287 | $1,550 | $1.20 | 6d | 1 | 0.73mi |
| 2730 Mud Lake Dr San Antonio, TX | 3.0 | 2.0 | 1287 | $1,550 | $1.20 | 26d | 1 | 0.73mi |
| 11371 Fish Spgs San Antonio, TX | 3.0 | 2.0 | 1312 | $1,475 | $1.12 | 6d | 1 | 0.75mi |
| 11442 Potter Vly San Antonio, TX | 3.0 | 2.0 | 1356 | $1,500 | $1.11 | 6d | 1 | 0.76mi |
| 11366 Olney Spgs San Antonio, TX | 3.0 | 2.0 | 1436 | $1,395 | $0.97 | 26d | 1 | 0.77mi |
| 11302 Cache Path San Antonio, TX | 3.0 | 2.5 | 1697 | $1,700 | $1.00 | 6d | 1 | 0.78mi |
| 11331 Two Wells Dr San Antonio, TX | 2.0 | 2.0 | 1103 | $1,350 | $1.22 | 26d | 1 | 0.81mi |
| 10247 Sunrise Fld San Antonio, TX | 3.0 | 2.5 | 1177 | $1,530 | $1.30 | 45d | 1 | 0.84mi |
| 3230 Bear Springs Dr San Antonio, TX | 4.0 | 2.5 | 1652 | $2,150 | $1.30 | 0d | 1 | 0.85mi |
| 11427 Long Trl San Antonio, TX | 3.0 | 2.5 | 1444 | $2,400 | $1.66 | 0d | 1 | 0.87mi |
| 10227 Brad Fld San Antonio, TX | 4.0 | 2.5 | 1443 | $1,680 | $1.16 | 45d | 1 | 0.88mi |
| 10203 Sunset Fld San Antonio, TX | 3.0 | 2.0 | 1270 | $1,550 | $1.22 | 14d | 1 | 0.94mi |
| 2891 Cherry Field Dr San Antonio, TX | 3.0 | 1.0 | 1136 | $1,300 | $1.14 | 26d | 1 | 0.94mi |
| 10215 Athens Fld San Antonio, TX | 3.0 | 2.5 | 1160 | $1,450 | $1.25 | 0d | 1 | 0.96mi |
| 2210 Muddy Peak Dr San Antonio, TX | 3.0 | 2.5 | 1623 | $1,650 | $1.02 | 26d | 1 | 1.03mi |
| 11326 Widefield Ln San Antonio, TX | 3.0 | 2.0 | 1328 | $1,425 | $1.07 | 45d | 1 | 1.03mi |
| 10243 Raven Field Dr San Antonio, TX | 3.0 | 2.0 | 1023 | $1,700 | $1.66 | 45d | 1 | 1.04mi |
| 10239 Raven Field Dr San Antonio, TX | 3.0 | 2.5 | 1252 | $1,620 | $1.29 | 0d | 1 | 1.04mi |
| 2840 Tengyc Bow San Antonio, TX | 4.0 | 2.0 | 1704 | $1,775 | $1.04 | 46d | 1 | 1.05mi |
| 3303 Mission Riv San Antonio, TX | 3.0 | 2.0 | 1489 | $1,850 | $1.24 | 45d | 1 | 1.06mi |
| 10714 Ranchland Fox San Antonio, TX | 3.0 | 2.5 | 1844 | $1,800 | $0.98 | 45d | 1 | 1.07mi |
| 3232 Onion Crk San Antonio, TX | 3.0 | 2.0 | 1168 | $1,495 | $1.28 | 45d | 1 | 1.09mi |
| 3111 Lamoka Lk San Antonio, TX | 3.0 | 2.5 | 1509 | $1,600 | $1.06 | 45d | 1 | 1.10mi |
| 3111 Lamoka Lk San Antonio, TX | 3.0 | 3.0 | 1508 | $1,600 | $1.06 | 4d | 1 | 1.10mi |
HOA detail
- Monthly dues
- $30 · $360/yr
Listing history 20 events
-
2026-06-21days on market $199,900 Active 94 DOM
-
2026-06-18days on market $199,900 Active 91 DOM
-
2026-06-17days on market $199,900 Active 90 DOM
-
2026-06-16days on market $199,900 Active 89 DOM
-
2026-06-15days on market $199,900 Active 88 DOM
-
2026-06-13days on market $199,900 Active 86 DOM
-
2026-06-09days on market $199,900 Active 82 DOM
-
2026-06-08days on market $199,900 Active 81 DOM
-
2026-06-07days on market $199,900 Active 80 DOM
-
2026-06-04days on market $199,900 Active 77 DOM
-
2026-06-03days on market $199,900 Active 76 DOM
-
2026-06-02days on market $199,900 Active 75 DOM
-
2026-06-01statusdays on market $199,900 Active 74 DOM
-
2026-05-31days on market $199,900 Price Change 73 DOM
-
2026-03-19$220,000 New 257-char remark
Show marketing remark (257 chars)
Great 3 bedroom, 2 bath, well maintained single story home! Features include a built-in microwave, flat top stove and a good size backyard. Nice subdivision in a convenient location with easy access to Loop 1604, Hwy 90 and Lackland AFB. This is a must see!
-
2026-01-16$1,600
-
2024-04-10historical $1,650
-
2024-01-18$1,650
-
2024-01-18historical $1,650
-
2023-12-19$1,650
ⓘ Source: listings_history table (triggers on properties + properties_extension) + one-shot
backfill from property_details.listing_events for pre-trigger history.
Tax reassessment forecast TX · Resets to sale price
- Current annual tax
- $4,134 · $345/mo
- Projected year-2 tax
- $4,134 · $345/mo
- Expected delta
- $0/yr ($0/mo · 0.0%)
ⓘ Screening estimate from a state-policy table — verify with the county assessor before closing.
Climate risk First Street
- Flood 1/10 Low FEMA zone X (unshaded) · 0% chance over 30 yrs
- Wildfire 5/10 Major
- Heat 8/10 Severe 7 d/yr ≥110°F today · 22 d/yr by 30 yrs out
- Wind 7/10 Severe 78% chance of damaging wind over 30 yrs
- Air quality 2/10 Low 1 unhealthy d/yr today · 1 by 30 yrs out
Nearby sold comps map
Loading sold comps map…
Walkable amenities ~0.75 mi
Loading nearby amenities…
Taxation est. · year 1
- Rental income
- $20,733
- − Mortgage interest
- −$11,198
- − Property taxes
- −$4,134
- − Insurance
- −$1,000
- − Repairs & maintenance
- −$1,659
- − Management
- −$1,659
- − HOA
- −$360
- − Depreciation
- −$5,815
- Taxable loss
- −$5,091
- Est. tax savings @ 24.0%
- +$1,222
- After-tax cash flow
- $-472/yr
For passive investors: Depreciation is non-cash, so a rental often shows a tax loss while cash-flowing — sheltering income. Rental losses are passive: they offset passive income freely, and up to $25,000/yr can offset ordinary (W-2) income if you actively participate and your MAGI is under $100k (phasing out to $0 by $150k); unused losses carry forward. On sale, claimed depreciation is recaptured at up to 25%, and gains may owe capital-gains tax (a 1031 exchange can defer both). Figures are a year-1 estimate at your 24.0% rate — not tax advice; consult a CPA.
Schools (NCES district)
- District
- Southwest ISD
- NCES district ID
- 4840950
- Math proficiency
- 21% ▼ -21.00%
- Reading proficiency
- 31% ▼ -5.00%
- Median HH income
- $43,362
- Composite
- 22.22/100
- National rank
- #8153
- State rank
- #701 of 826 in TX
Livability — San Antonio
- Score
- 80/100
- State rank
- #31
- US rank
- #1616
Category grades
Schools grade is shown separately in the Schools card above.
Census & demographics
- County
- Bexar County · 1,990,555 people
- City population
- 1,806,925
- Metro
- San Antonio-New Braunfels, TX
- Population (ZIP)
- 96,015
- Household income
- $90,029
- Rent vs Own
- Severe rent burden
- 2466.0
Population outlook (Bexar County) Hauer SSP2
- Today (2025)
- 2,336,851 people
- By 2030
- 2,560,728 · +9.6%
- By 2040
- 3,020,569 · +29.3%
- By 2050
- 3,493,522 · +49.5%
- By 2075
- 4,668,459 · +99.8%
- By 2100
- 5,533,242 · +136.8%
Race, ethnicity, and origin ACS 2023
- Neighborhood character
- Majority Hispanic (64%)
- Race & ethnicity
- Hispanic / Latino 64% Two or more races 27% White 20% Black 9% Asian 2%
- Hispanic origin (detail)
- Mexican 53% Puerto Rican 2%
- Common ancestry
- Slovak 1% Lithuanian 1% Romanian 1%
- Foreign-born
- 9% · Canada, Vietnam
- Languages at home
- 66% English-only · Spanish 30% Arabic 1% Tagalog/Filipino 1%
Political lean MEDSL · Bexar
- 2024 margin
- Lean D (+9.8) · D 54.3% · R 44.6% · Other 1.1%
- 2008→2024 swing
- +4.2pp toward D · 2008: 5.6pp · 2024: 9.8pp
- All cycles
- 2024: D+9.8 2020: D+18.2 2016: D+13.5 2012: D+4.6 2008: D+5.6
Not yet ingested
- Civics
- —
Market trends
- HPI YoY
- ▼ -53.31%
- Current HPI
- 234.7931
- Rent YoY
- ▼ -3.02%
- Metro
- San Antonio-New Braunfels, TX
- State GDP YoY
- ▲ 3.95%
- F500 in state
- 110
Industry mix (Fortune 500 HQ in TX)
| Industry | F500 HQs | Revenue |
|---|---|---|
| Energy | 16 | $1,198B |
|
||
| Technology | 5 | $198B |
|
||
| Engineering / Construction | 4 | $72B |
|
||
| Energy Services | 3 | $60B |
|
||
| Utilities | 3 | $41B |
|
||
| Healthcare | 2 | $330B |
|
||
Price history
+13233.3% since first listed6 events — show timeline
- 2026-03-19 Listed $220,000 LERA
- 2026-01-16 Listed for Rent $1,600 SABOR
- 2024-04-10 Rental Removed $1,650 APPFOLIO
- 2024-01-18 Listed for Rent $1,650 APPFOLIO
- 2024-01-18 Rental Removed $1,650 SABOR
- 2023-12-19 Listed for Rent $1,650 SABOR
Property tax history
+3.6%/yrLatest (2025): $4,134 · -5.1% YoY. Source: county tax records.
Cash-flow waterfall
monthlySold comps — $/sqft
last 12 mo · ≤1 miLoading sold comps…