13887 La Porte Rd · Clipper Mills, CA
Flood risk 1/10 · Minimal
- FEMA flood zone
- D
- Chance of flooding over 30 yrs
- 0.0%
- Est. flood insurance / yr
- $544 – $1,084
Fire risk 8/10 · Major
- Est. fire insurance / yr
- $659 – $1,223
Heat risk 3/10 · Minor
- Hot days now (above 91°F)
- 4 days/yr
- Hot days in 30 yrs
- 9 days/yr
Wind risk 1/10 · Minimal
- Chance of severe wind over 30 yrs
- —
Air-quality risk 10/10 · Severe
- Unhealthy air days now
- 38 days/yr
- Unhealthy air days in 30 yrs
- 41 days/yr
Risk factors via First Street. Map © Google.
Why this score? — see what drove the C- grade
The composite is a weighted blend of 9 inputs, each scored 0–100. Each bar is that input's sub-score; the figure is the points it added to the 100-point composite (weight × sub-score).
- Cash flow +15.9/30.0
- ARV discount +15.0/15.0
- Appreciation +5.0/10.0
- DSCR +4.9/10.0
- 1% rule +3.5/10.0
- Livability +2.7/5.0
- Rent growth +2.5/5.0
- Condition / age +2.5/5.0
- Schools +1.8/10.0
$200,000
🖨 Deal sheet 📄 Offer letter ✓ Due diligence
Listing remarks
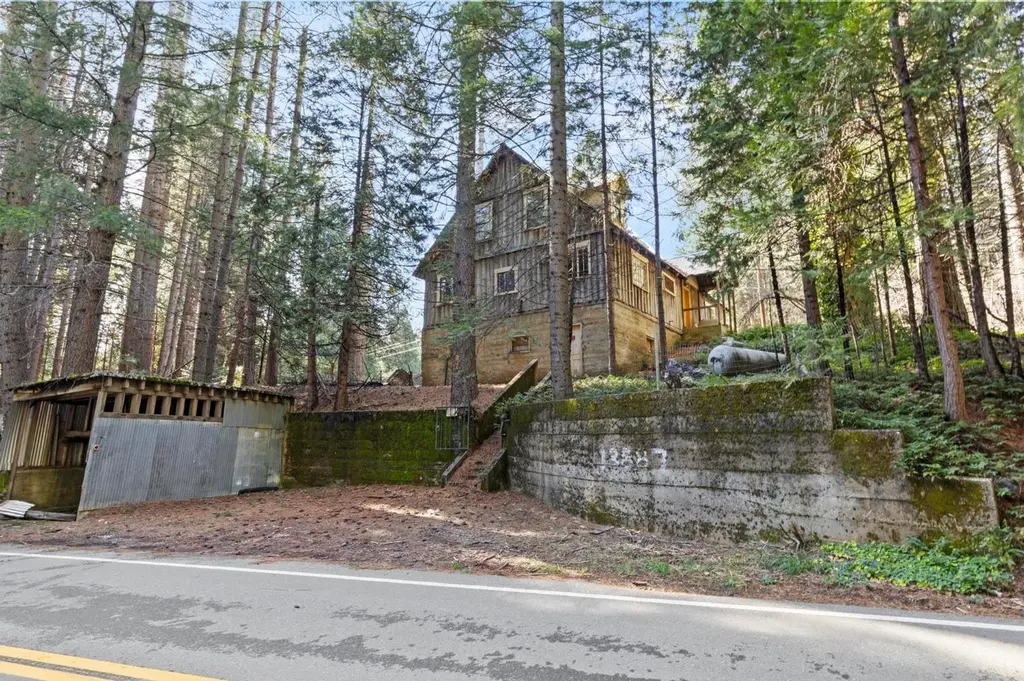
Own a genuine piece of California Gold Rush history the remains of Eagleville, the 1850s foothill hideaway First settled in 1851, this was the miners' headquarters where grizzlies roamed. The town boasted a hotel, store, barbershop, school, and a thriving community that later included the North Star Hotel along La Porte Road. Tales of Indian burial mounds and covered-wagon traffic only add to the allure. Today, this exact 8.78-acre parcel is your rare chance to step into that story and write the next chapter. At the heart of it all stands a 1948 rustic cabin with great construction quality for the time and undeniable charm 2,300 sq ft, 4 bedrooms, 2 baths, built into the hillside with
Key facts
- Metal roof
- Wood stove
- Full basement
Tags
Neighborhood map
What this means for you Summary
Snapshot
- This is a 4-bed/1.0-bath single-family listed at $200k.
Deal economics
- At list price, monthly cash flow is $94 ($1k/yr) — positive.
- The deal already cash-flows at list — no discount required.
- To meet the 1% rule (rent ≥ 1% of price), the offer needs to be $170k (14.9% below list).
- Recommended offer: $170k (14.9% below list) — sets the bar for 1% rule.
Location & tenants
- Location reads 53/100 on livability (#976 in CA) — a working-class tenant base; expect higher turnover. Strengths: crime A, employment B, housing B; Watch: schools F, amenities F, commute F.
- Marysville Joint Unified (suburban): math 14% / reading 28% proficiency, ranked #455 of 517 in CA (top 88%) — low school quality limits family demand, transient renter base, plan for 1-2y turnover; 68% free/reduced lunch — lower-income household profile, screen leases tightly.
- Market conditions: 11 active listings in the ZIP; 750 units permitted in Yuba County in 2024 (41 in 5+ unit buildings).
Forward outlook
- In year one you build about $7k of equity ($1k loan paydown + $6k appreciation (3.0% local appreciation)).
- Yuba County population projected to shrink 3% by 2050 — rents likely to lag national; underwrite the cash flow, not the appreciation.
- At projected returns (3.0% appreciation + 3.0% rent growth), your $56k cash investment doubles in ~6 years — after that, you're playing with house money.
- By year 5, paydown + projected appreciation supports a ~$32k cash-out refi (75% LTV) — recoverable capital for the next deal without selling this one.
Negotiation context
- It's been on market 123 days — a 12% lower offer ($176k) is reasonable based on typical stale-listing flexibility.
- Current owner paid $160k; 25% above their basis — modest negotiation headroom, anchor on the comps not their cost.
Risks & watch-outs
- Watch-outs: built in 1948 — expect roof / HVAC / electrical / plumbing capex.
- Climate carrying-cost: severe wildfire risk — expect insurance premiums to compound above CPI over the hold.
Questions for the listing agent
- It's been on market 123 days. Have you received any prior offers? Is the seller open to a 15% concession, seller financing, or rate buy-down credit?
- Built in 1948 — when were the roof, HVAC, electrical panel, plumbing, and water heater last replaced?
- Why hasn't it sold? Are there any deal-killer items the seller is aware of (foundation, flood, title, zoning, code violations)?
- Is there a deadline driving the sale (1031 exchange, divorce, estate, relocation)? That informs how much negotiation room exists.
- Schools are F-rated, which usually means shorter tenancies and higher turnover. Who's the typical renter profile here, and what's been the actual vacancy rate?
- What's the average days-on-market for RENTAL listings here right now (not sales)? A rising rental-DOM trend means longer vacancies and softer asking-rent achievability than the comps imply.
- What's the recent tenant-quality profile in this submarket — average credit score on applications, eviction rate, late-payment / NSF rate, and stable-employment percentage? A property-management company in the area should have these aggregated.
- How much new for-sale + rental construction is in the pipeline within 1–3 miles? Heavy new supply typically softens prices + rents 12–24 months out; constrained supply supports both.
Investment metrics
- 1% rule
- 0.85% ✗
- Cap rate
- 6.86%
- Cash-on-cash
- 2.02%
- DSCR
- 1.09
- GRM
- 9.8
CMA / ARV
- ARV (median comp)
- $247,388
- List price
- $200,000
- Delta
- -19.16%
- Verdict
- UNDERPRICED
- Comps
- 2 within 2.0 mi
Projected returns pro-forma
3.0% appreciation · 3.0% rent growth · sell at horizon
- IRR
- 9.4%
- Equity multiple
- 1.54×
- Total profit
- $30,040
- Equity at exit
- $89,929
- IRR
- 11.8%
- Equity multiple
- 2.76×
- Total profit
- $98,481
- Equity at exit
- $138,591
Cash invested: $56,000 (down + closing). Projections, not guarantees.
Landlord ↔ Tenant lean methodology
- Overall (STATE)
- 18 Strongly Tenant-Friendly
- State California
- 18 Strongly Tenant-Friendly · D+13
- County
- — inherits STATE
- City
- — inherits STATE
ZIP-level market 95981
- Active inventory
- 11
- Price-to-rent
- 9.8×
Monthly cashflow live
- Estimated rent
- $1,701 medium interval (Pro) →
- Mortgage (P&I)
- −$1,049
- Tax from tax record
- −$118 /mo · $1,411/yr
- Insurance
- −$83
- HOA
- −$0
- Vacancy / Maint / Mgmt
- −$357
- Net cashflow
- $94
Break-even live
UW: 25.0% down · 7.5% · 30yr · 1.5% tax · 5.0% vac · 8.0% maint · 8.0% mgmt
Financing live
Cash to close
- Down payment
- $50,000
- Closing costs
- $6,000
- Reserves months
- —
- Total cash needed
- —
Loan-product check · same deal, 3 products live
Conventional
25% down · 7.5% · 30yr
- Down + closing
- —
- Monthly P&I
- —
- Monthly cashflow
- —
- DSCR
- —
- Eligible?
- —
Personal DTI + credit; lowest rate.
DSCR
20% down · 8.5% · 30yr
- Down + closing
- —
- Monthly P&I
- —
- Monthly cashflow
- —
- DSCR
- —
- Eligible?
- —
No personal income docs; deal must DSCR.
Hard money
10% down · 12.0% · 12mo
- Down + closing
- —
- Monthly P&I
- —
- Monthly cashflow
- —
- DSCR
- —
- Eligible?
- —
Short-term bridge; refi at stabilization.
Listing history 21 events
-
2026-06-19days on market $200,000 Active 123 DOM
-
2026-06-18days on market $200,000 Active 122 DOM
-
2026-06-17days on market $200,000 Active 121 DOM
-
2026-06-16days on market $200,000 Active 120 DOM
-
2026-06-15days on market $200,000 Active 119 DOM
-
2026-06-14days on market $200,000 Active 117 DOM
-
2026-06-13days on market $200,000 Active 116 DOM
-
2026-06-10days on market $200,000 Active 114 DOM
-
2026-06-09days on market $200,000 Active 113 DOM
-
2026-06-08days on market $200,000 Active 112 DOM
-
2026-06-07days on market $200,000 Active 111 DOM
-
2026-06-05days on market $200,000 Active 108 DOM
-
2026-06-03days on market $200,000 Active 107 DOM
-
2026-06-02days on market $200,000 Active 106 DOM
-
2026-06-01days on market $200,000 Active 105 DOM
-
2026-05-31pricedays on market $200,000 Active 104 DOM
-
2026-05-30days on market $225,000 Active 103 DOM
-
2024-01-19soldstatus $160,000
-
2023-11-04historical
-
2023-05-06$195,000 Active
-
2020-05-07soldstatus $126,000
ⓘ Source: listings_history table (triggers on properties + properties_extension) + one-shot
backfill from property_details.listing_events for pre-trigger history.
Tax reassessment forecast CA · Resets to sale price
- Current annual tax
- $1,411 · $118/mo
- Projected year-2 tax
- $1,520 · $127/mo
- Expected delta
- +$109/yr (+$9/mo · 7.7%)
ⓘ Screening estimate from a state-policy table — verify with the county assessor before closing.
Climate risk First Street
- Flood 1/10 Low FEMA zone D · 0% chance over 30 yrs
- Wildfire 8/10 Severe
- Heat 3/10 Moderate 4 d/yr ≥91°F today · 9 d/yr by 30 yrs out
- Wind 1/10 Low
- Air quality 10/10 Extreme 38 unhealthy d/yr today · 41 by 30 yrs out
Nearby sold comps map
Loading sold comps map…
Walkable amenities ~0.75 mi
Loading nearby amenities…
Taxation est. · year 1
- Rental income
- $20,415
- − Mortgage interest
- −$11,203
- − Property taxes
- −$1,411
- − Insurance
- −$1,000
- − Repairs & maintenance
- −$1,633
- − Management
- −$1,633
- − Depreciation
- −$5,818
- Taxable loss
- −$2,284
- Est. tax savings @ 24.0%
- +$548
- After-tax cash flow
- $1,679/yr
For passive investors: Depreciation is non-cash, so a rental often shows a tax loss while cash-flowing — sheltering income. Rental losses are passive: they offset passive income freely, and up to $25,000/yr can offset ordinary (W-2) income if you actively participate and your MAGI is under $100k (phasing out to $0 by $150k); unused losses carry forward. On sale, claimed depreciation is recaptured at up to 25%, and gains may owe capital-gains tax (a 1031 exchange can defer both). Figures are a year-1 estimate at your 24.0% rate — not tax advice; consult a CPA.
Schools (NCES district)
- District
- Marysville Joint Unified
- NCES district ID
- 0624090
- Math proficiency
- 14% ▼ -13.00%
- Reading proficiency
- 28% ▼ -10.00%
- Median HH income
- $44,598
- Composite
- 18.18/100
- National rank
- #8961
- State rank
- #455 of 517 in CA
Livability — Clipper Mills
- Score
- 53/100
- State rank
- #976
- US rank
- #24598
Category grades
Schools grade is shown separately in the Schools card above.
Census & demographics
- Population (ZIP)
- 60
Population outlook (Yuba County) Hauer SSP2
- Today (2025)
- 75,432 people
- By 2030
- 75,358 · -0.1%
- By 2040
- 74,643 · -1.0%
- By 2050
- 72,937 · -3.3%
- By 2075
- 66,368 · -12.0%
- By 2100
- 54,524 · -27.7%
Race, ethnicity, and origin ACS 2023
- Neighborhood character
- Predominantly White (100%)
- Race & ethnicity
- White 100%
Political lean MEDSL · Yuba
- 2024 margin
- Strong R (+25.8) · D 35.7% · R 61.5% · Other 2.8%
- 2008→2024 swing
- -11.2pp toward R · 2008: -14.7pp · 2024: -25.8pp
- All cycles
- 2024: R+25.8 2020: R+21.6 2016: R+24.1 2012: R+19.5 2008: R+14.7
Not yet ingested
- Civics
- —
Market trends
- HPI YoY
- —
- Current HPI
- —
- Rent YoY
- —
- Metro
- —
- State GDP YoY
- ▲ 3.21%
- F500 in state
- 116
Industry mix (Fortune 500 HQ in CA)
| Industry | F500 HQs | Revenue |
|---|---|---|
| Technology | 27 | $1,492B |
|
||
| Financial Services | 3 | $174B |
|
||
| Retail | 3 | $44B |
|
||
| Insurance | 3 | $26B |
|
||
| Media / Entertainment | 2 | $115B |
|
||
| Pharmaceuticals / Biotech | 2 | $62B |
|
||
Price history
+27.0% since first listed4 events — show timeline
- 2024-01-19 Sold (Public Records) $160,000 Public Records
- 2023-11-04 Listing Removed — CRMLS
- 2023-05-06 Listed $195,000 CRMLS
- 2020-05-07 Sold (Public Records) $126,000 Public Records
Property tax history
+2.2%/yrLatest (2025): $1,411 · +1.7% YoY. Source: county tax records.
Cash-flow waterfall
monthlySold comps — $/sqft
last 12 mo · ≤1 miLoading sold comps…