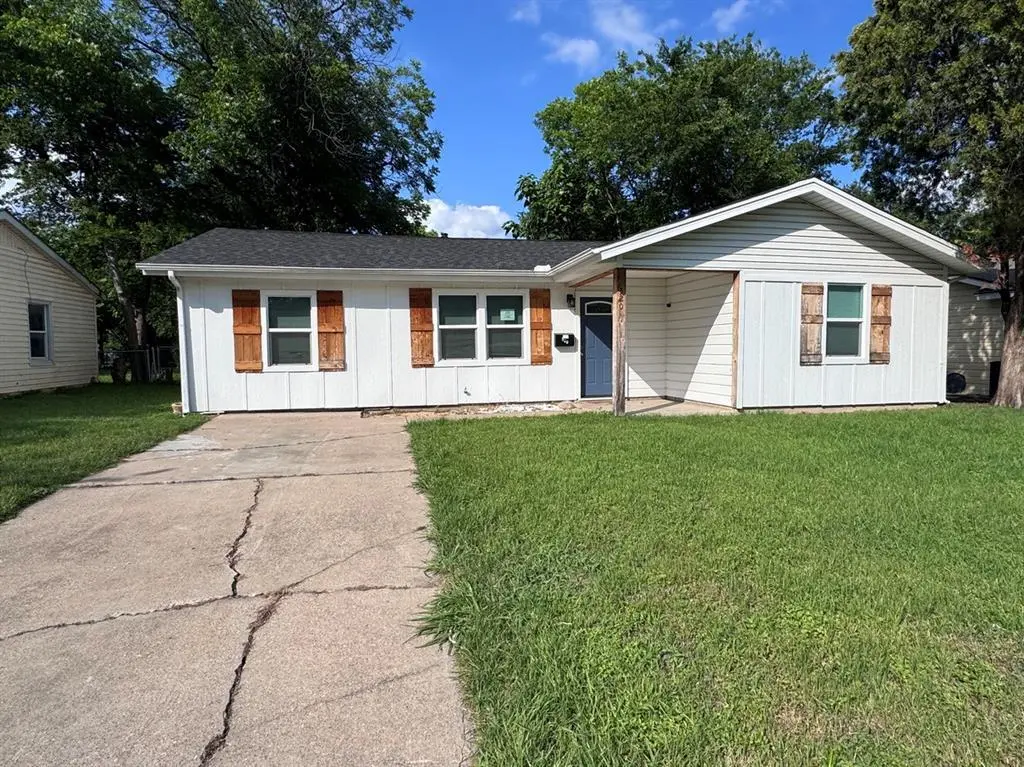
520 NW King St · Burleson, TX
Flood risk 1/10 · Minimal
- FEMA flood zone
- X (unshaded)
- Chance of flooding over 30 yrs
- 0.0%
- Est. flood insurance / yr
- $507 – $1,088
Fire risk 1/10 · Minimal
- Est. fire insurance / yr
- $1,222 – $2,270
Heat risk 7/10 · Major
- Hot days now (above 110°F)
- 7 days/yr
- Hot days in 30 yrs
- 24 days/yr
Wind risk 6/10 · Moderate
- Chance of severe wind over 30 yrs
- 27.0%
Air-quality risk 3/10 · Minor
- Unhealthy air days now
- 2 days/yr
- Unhealthy air days in 30 yrs
- 3 days/yr
Risk factors via First Street. Map © Google.
Why this score? — see what drove the D grade
The composite is a weighted blend of 9 inputs, each scored 0–100. Each bar is that input's sub-score; the figure is the points it added to the 100-point composite (weight × sub-score).
- Cash flow +12.2/30.0
- ARV discount +10.4/15.0
- 1% rule +4.7/10.0
- Schools +4.0/10.0
- Livability +4.0/5.0
- DSCR +3.6/10.0
- Rent growth +2.9/5.0
- Condition / age +2.5/5.0
- Appreciation +0.0/10.0
$193,000
🖨 Deal sheet 📄 Offer letter ✓ Due diligence
Listing remarks MLS
All that is left to do on this Home is Move In! The long list of updates start with Vinyl Plank Flooring, Cabinets, White Quartz Countertops, Island in the Kitchen, Energy Efficient Windows, Tile Flooring in Bathroom, Carpet in all Bedrooms, 12 Inches of Blown in Fiberglass Insulation, Raised Panel Doors, Larger Baseboards and Trim! That doesn't include the roof being replaced in 2022 with Ridge Vent. The home also has a 200 Amp Service panel with copper wiring and grounded outlets. The exterior has a fresh update with the popular Farmhouse Style. This home is conveniently located close to Old Town Burleson and Highway's I-35 West and State Highway 174. Come see the rest of the updates in Person!
Key facts
- Large center island
- Large backyard
- 8,146 sq ft lot
Tags
Property features AI
Finance
- Other: Subdivision: Montclair Add; County: Johnson
- Financial info: Listing accepts Cash, Conventional, FHA, and VA financing; Property is real estate owned
- HOA & community: No homeowners association
Exterior
- Parking: Driveway (no garage or carport)
- Security: Smoke detectors
- Utilities: City water; City sewer
- Home design: Single family residence; Residential property; One story; Not attached to another property
- Construction: Built in 1960; Wood construction; Slab foundation
- Exterior features: Chain link fence; Interior lot in a subdivision
Interior
- Kitchen: Eat-in kitchen with island; Dishwasher; Disposal; Electric range
- Bedrooms: Three bedrooms (all on main level); Primary bedroom on main level
- Flooring: Carpet; Luxury vinyl plank; Vinyl
- Bathrooms: One full bathroom
- Heating & cooling: Central heating (natural gas); Central air conditioning (electric); Ceiling fans
- Interior features: High speed internet available; Seven rooms total; One living area; One dining area; One-level home
- Laundry & utility: Full-size washer/dryer area; Utility closet; Electric water heater
Neighborhood map
What this means for you Summary
Snapshot
- This is a 3-bed/1.0-bath single-family listed at $193k.
Deal economics
- At list price, monthly cash flow is $-38 ($-456/yr) — negative.
- To cash-flow at today's rent, offer at most $186k (3.5% below list).
- To meet the 1% rule (rent ≥ 1% of price), the offer needs to be $187k (3.1% below list).
- Recommended offer: $186k (3.5% below list) — sets the bar for cash-flow.
- Cap rate 6.1% vs local median 3.5% in Burleson — top-decile yield for the area; either an underpriced asset or a hidden risk that comps aren't pricing in. Stress-test before assuming the spread holds.
Location & tenants
- Location reads 79/100 on livability (#53 in TX, #2,133 nationally) — a middle-class / working-renter tenant base. Strengths: employment A+, cost of living A+, housing A+; Watch: amenities F, commute F.
- Burleson ISD (suburban): math 41% / reading 48% proficiency, ranked #236 of 826 in TX (top 29%) — families likely to look elsewhere, expect single-tenant / working-renter base with shorter leases.
- Zoned schools: Jack Taylor El (math 30% / reading 34%, grade F, #2,268 of 4,322 statewide, top 55%, 544 students, 71% FRL) — zoned schools average 71% FRL vs 32% district-wide (39 pts higher); higher-poverty schools than district average — tighter screening recommended.
- Zoned-school proficiency averages 32% at this address vs 44% district-wide (-12 pts) — the specific schools serving this property underperform the Burleson ISD average; the district grade overstates school quality for this exact location.
- Market conditions: Rents rising (+1.8%/yr); 679 active listings in the ZIP; 34 comparable units currently listed for rent nearby; rentals at typical pace (median 25d on market — plan ~3-4 weeks tenant-placement turnaround); solid renter incomes; 2,152 units permitted in Johnson County in 2024 (76 in 5+ unit buildings).
Forward outlook
- Local home prices are declining (-3.0%/yr); year-one equity from $1k of loan paydown is wiped out by about $6k of value loss. Plan a longer hold.
- Johnson County population projected at +24% by 2050 — long-run rental-demand tailwind backs the buy-and-hold thesis.
Negotiation context
- It's been on market 35 days — a 3% lower offer ($187k) is reasonable based on typical stale-listing flexibility.
- 2 sale attempts since 4y ago with the ask held roughly flat each time — persistent listings suggest the price (not the market) is what's stuck; bring a comps-based counter.
Risks & watch-outs
- Watch-outs: property tax is 2.6% of price.
- Climate carrying-cost: major wind risk, 27% chance of damaging wind over 30y; extreme-heat days projected 7→24/yr by 2055 (HVAC capex compounding) — expect insurance premiums to compound above CPI over the hold.
Questions for the listing agent
- What do current leases actually rent for vs. the listed asking? Can we see a recent rent roll and the last 12 months of T-12 income?
- It's been on market 35 days. Have you received any prior offers? Is the seller open to a 3% concession, seller financing, or rate buy-down credit?
- Built in 1960 — when were the roof, HVAC, electrical panel, plumbing, and water heater last replaced?
- Property tax is high relative to price — has the assessment been appealed recently, and will the sale trigger a re-assessment?
- Is there a deadline driving the sale (1031 exchange, divorce, estate, relocation)? That informs how much negotiation room exists.
- The area grade is low — what's the realistic commute time and amenity access for the typical tenant pool here? Any planned neighborhood developments (good or bad) we should know about?
- What's the average days-on-market for RENTAL listings here right now (not sales)? A rising rental-DOM trend means longer vacancies and softer asking-rent achievability than the comps imply.
- What's the recent tenant-quality profile in this submarket — average credit score on applications, eviction rate, late-payment / NSF rate, and stable-employment percentage? A property-management company in the area should have these aggregated.
- How much new for-sale + rental construction is in the pipeline within 1–3 miles? Heavy new supply typically softens prices + rents 12–24 months out; constrained supply supports both.
Investment metrics
- 1% rule
- 0.97% ✗
- Cap rate
- 6.06%
- Cash-on-cash
- -0.84%
- DSCR
- 0.96
- GRM
- 8.6
CMA / ARV
- ARV (on-the-fly)
- $206,208
- Comps found
- 12
Show comp detail 12 sales within ~0.75 mi
| Address | Dist | Beds/Ba | Sqft | Sold | Price | $/sf | Match |
|---|---|---|---|---|---|---|---|
| 516 Renfro St | 0.07mi | 3/1.0 | 1,100 (+2%) | 4mo | $215,000 | $195 | 89 |
| 512 NW Lorna St | 0.06mi | 3/1.0 | 1,032 (-4%) | 2mo | $148,750 | $144 | 89 |
| 557 Hillery St | 0.14mi | 3/2.0 | 1,090 (+2%) | 9mo | $215,000 | $197 | 80 |
| 200 SW Moody St | 0.25mi | 3/1.5 | 1,143 (+6%) | 4mo | $165,000 | $144 | 73 |
| 109 SW Moody St | 0.21mi | 3/2.0 | 1,136 (+6%) | 9mo | $245,000 | $216 | 69 |
| 115 NE Taylor St | 0.17mi | 3/1.0 | 934 (-13%) | 2mo | $215,000 | $230 | 69 |
| 624 NW Douglas St | 0.38mi | 2/1.0 (-1) | 1,064 (-1%) | 9mo | $200,000 | $188 | 68 |
| 405 Marion Ln | 0.26mi | 3/2.0 | 1,170 (+9%) | 2mo | $163,000 | $139 | 67 |
| 318 NE Michael Dr | 0.27mi | 3/2.0 | 1,206 (+12%) | 4mo | $175,000 | $145 | 60 |
| 540 NW Mound St | 0.28mi | 3/2.0 | 1,206 (+12%) | 9mo | $250,000 | $207 | 55 |
| 624 NW Barbara Ln | 0.54mi | 3/2.0 | 1,195 (+11%) | 2mo | $225,000 | $188 | 50 |
| 345 N Field | 0.75mi | 2/1.5 (-1) | 1,094 (+2%) | 7mo | $209,999 | $192 | 49 |
Match score weights: distance 35% · size 25% · config 20% · recency 20%. Top-matched comps best support the ARV.
Projected returns pro-forma
-3.0% appreciation · 1.78% rent growth · sell at horizon
- IRR
- -19.2%
- Equity multiple
- 0.34×
- Total profit
- $-35,821
- Equity at exit
- $28,777
- IRR
- -14.7%
- Equity multiple
- 0.21×
- Total profit
- $-42,820
- Equity at exit
- $16,687
Cash invested: $54,040 (down + closing). Projections, not guarantees.
Landlord ↔ Tenant lean methodology
- Overall (STATE)
- 87 Strongly Landlord-Friendly
- State Texas
- 87 Strongly Landlord-Friendly · R+5
- County
- — inherits STATE
- City
- — inherits STATE
ZIP-level market 76028
- Home prices YoY
- -33.4%
- Rents YoY
- 1.8%
- Active inventory
- 679
- Price-to-rent
- 8.6×
Monthly cashflow live
- Estimated rent
- $1,870 high interval (Pro) →
- Mortgage (P&I)
- −$1,012
- Tax from tax record
- −$423 /mo · $5,074/yr
- Insurance
- −$80
- HOA
- −$0
- Vacancy / Maint / Mgmt
- −$393
- Net cashflow
- $-38
Break-even live
UW: 25.0% down · 7.5% · 30yr · 1.5% tax · 5.0% vac · 8.0% maint · 8.0% mgmt
Financing live
Cash to close
- Down payment
- $48,250
- Closing costs
- $5,790
- Reserves months
- —
- Total cash needed
- —
Loan-product check · same deal, 3 products live
Conventional
25% down · 7.5% · 30yr
- Down + closing
- —
- Monthly P&I
- —
- Monthly cashflow
- —
- DSCR
- —
- Eligible?
- —
Personal DTI + credit; lowest rate.
DSCR
20% down · 8.5% · 30yr
- Down + closing
- —
- Monthly P&I
- —
- Monthly cashflow
- —
- DSCR
- —
- Eligible?
- —
No personal income docs; deal must DSCR.
Hard money
10% down · 12.0% · 12mo
- Down + closing
- —
- Monthly P&I
- —
- Monthly cashflow
- —
- DSCR
- —
- Eligible?
- —
Short-term bridge; refi at stabilization.
Rent comps 34 comps
| Address | Beds | Baths | Sqft | Rent | $/sqft | DOM | Units | Dist |
|---|---|---|---|---|---|---|---|---|
| 532 NW King St Burleson, TX | 3.0 | 1.0 | 1300 | $1,550 | $1.19 | 43d | 1 | 0.05mi |
| 112 SW Murphy Rd Burleson, TX | 3.0 | 2.0 | 1210 | $1,850 | $1.53 | 2d | 1 | 0.17mi |
| 109 SW Cindy Ln Burleson, TX | 3.0 | 1.0 | 1276 | $1,700 | $1.33 | 43d | 1 | 0.19mi |
| 609 NW Lorna St Burleson, TX | 3.0 | 2.0 | 1381 | $1,800 | $1.30 | 43d | 1 | 0.19mi |
| 344 NW Renfro St Burleson, TX | 3.0 | 1.0 | 1026 | $1,580 | $1.54 | 24d | 1 | 0.24mi |
| 409 Oxford St Burleson, TX | 3.0 | 2.0 | 1402 | $1,995 | $1.42 | 43d | 1 | 0.36mi |
| 772 Hampshire Dr Burleson, TX | 3.0 | 2.0 | 1210 | $2,350 | $1.94 | 43d | 1 | 0.80mi |
| 517 Meadowcrest Dr Burleson, TX | 3.0 | 2.0 | 1305 | $2,050 | $1.57 | 16d | 1 | 0.92mi |
| 517 Meadowcrest Dr Burleson, TX | 3.0 | 2.0 | 1305 | $2,050 | $1.57 | 12d | 1 | 0.92mi |
| 621 Barkridge Trl Burleson, TX | 3.0 | 2.0 | 1444 | $2,000 | $1.39 | 12d | 1 | 0.93mi |
| 1120 Highcrest Dr Burleson, TX | 3.0 | 2.0 | 1462 | $2,100 | $1.44 | 16d | 1 | 1.00mi |
| 828 Vicksburg Ln Burleson, TX | 3.0 | 2.0 | 1241 | $2,000 | $1.61 | 43d | 1 | 1.02mi |
| NW Summercrest Blvd Burleson, TX | 3.0 | 1.5 | 1085 | $1,450 | $1.34 | 24d | 1 | 1.09mi |
| 812 NW Summercrest Blvd Apt B Burleson, TX | 3.0 | 1.5 | 1085 | $1,450 | $1.34 | 24d | 1 | 1.10mi |
| 236 S Scott St Burleson, TX | 3.0 | 2.0 | 1250 | $1,780 | $1.42 | 12d | 1 | 1.10mi |
| 105 SE Gardens Blvd Apt 112 Burleson, TX | 2.0 | 1.5 | 1019 | $1,425 | $1.40 | 7d | 1 | 1.13mi |
| 105 SE Gardens Blvd Apt 108 Burleson, TX | 2.0 | 1.5 | 1019 | $1,425 | $1.40 | 24d | 1 | 1.13mi |
| 716 SW Sunset Ln Burleson, TX | 3.0 | 1.0 | 1018 | $1,725 | $1.69 | 43d | 1 | 1.16mi |
| 207 Stefanie St Burleson, TX | 3.0 | 2.0 | 1145 | $1,695 | $1.48 | 24d | 1 | 1.16mi |
| 200 Village Creek Pkwy Unit 257 Burleson, TX | 2.0 | 2.0 | 1051 | $1,527 | $1.45 | 12d | 1 | 1.16mi |
| 200 Village Creek Pkwy Unit 2121 Burleson, TX | 2.0 | 2.0 | 1051 | $1,486 | $1.41 | 22d | 1 | 1.16mi |
| 812 Walnut St Burleson, TX | 3.0 | 2.0 | 1192 | $1,750 | $1.47 | 18d | 1 | 1.19mi |
| 444 E Renfro St Burleson, TX | 1.0–3.0 | 1.0–2.0 | 1094 | $2,250 | $2.06 | 1d | 1 | 1.21mi |
| 200 Village Creek Pkwy Unit 223 Burleson, TX | 2.0 | 2.0 | 1051 | $1,645 | $1.57 | 2d | 1 | 1.23mi |
| 450 E Renfro St Burleson, TX | 3.0 | 2.0 | 1413 | $2,135 | $1.51 | 43d | 1 | 1.23mi |
| 428 Tinker Trl Burleson, TX | 2.0 | 2.0 | 1329 | $1,735 | $1.31 | 17d | 1 | 1.25mi |
| 200 Village Creek Pkwy Burleson, TX | 1.0–2.0 | 1.0–2.0 | 905 | $1,852 | $2.05 | 20d | 11 | 1.26mi |
| 900 Vaughn Dr Burleson, TX | 3.0 | 2.0 | 1408 | $2,200 | $1.56 | 43d | 1 | 1.32mi |
| 1412 Anna Lea Ln Burleson, TX | 3.0 | 2.0 | 1293 | $1,925 | $1.49 | 3d | 1 | 1.32mi |
| 1008 Rock Springs Dr Burleson, TX | 3.0 | 2.0 | 1472 | $1,995 | $1.36 | 43d | 1 | 1.36mi |
| 912 Vaughn Dr Burleson, TX | 3.0 | 2.0 | 1144 | $1,700 | $1.49 | 16d | 1 | 1.36mi |
| 213 NW Jayellen Ave Burleson, TX | 4.0 | 2.0 | 1412 | $2,000 | $1.42 | 5d | 1 | 1.39mi |
| 634 Lisa St Burleson, TX | 3.0 | 2.0 | 1239 | $1,845 | $1.49 | 24d | 1 | 1.42mi |
| 128 Meador Ln Burleson, TX | 2.0 | 2.0 | 947 | $1,500 | $1.58 | 43d | 1 | 1.45mi |
Listing history 23 events
-
2026-06-18days on market $193,000 Active 35 DOM
-
2026-06-17pricedays on market $193,000 Active 34 DOM
-
2026-06-16days on market $202,500 Active 33 DOM
-
2026-06-15days on market $202,500 Active 32 DOM
-
2026-06-13days on market $202,500 Active 30 DOM
-
2026-06-09days on market $202,500 Active 26 DOM
-
2026-06-08days on market $202,500 Active 25 DOM
-
2026-06-07days on market $202,500 Active 24 DOM
-
2026-06-04days on market $202,500 Active 21 DOM
-
2026-06-03days on market $202,500 Active 20 DOM
-
2026-06-02days on market $202,500 Active 19 DOM
-
2026-06-01days on market $202,500 Active 18 DOM
-
2026-05-31days on market $202,500 Active 17 DOM
-
2026-05-14$202,500 Active
-
2022-08-01soldstatus
-
2022-07-29soldstatus Closed 706-char remark
Show marketing remark (706 chars)
All that is left to do on this Home is Move In! The long list of updates start with Vinyl Plank Flooring, Cabinets, White Quartz Countertops, Island in the Kitchen, Energy Efficient Windows, Tile Flooring in Bathroom, Carpet in all Bedrooms, 12 Inches of Blown in Fiberglass Insulation, Raised Panel Doors, Larger Baseboards and Trim! That doesn't include the roof being replaced in 2022 with Ridge Vent. The home also has a 200 Amp Service panel with copper wiring and grounded outlets. The exterior has a fresh update with the popular Farmhouse Style. This home is conveniently located close to Old Town Burleson and Highway's I-35 West and State Highway 174. Come see the rest of the updates in Person!
-
2022-07-14status Pending 706-char remark
Show marketing remark (706 chars)
All that is left to do on this Home is Move In! The long list of updates start with Vinyl Plank Flooring, Cabinets, White Quartz Countertops, Island in the Kitchen, Energy Efficient Windows, Tile Flooring in Bathroom, Carpet in all Bedrooms, 12 Inches of Blown in Fiberglass Insulation, Raised Panel Doors, Larger Baseboards and Trim! That doesn't include the roof being replaced in 2022 with Ridge Vent. The home also has a 200 Amp Service panel with copper wiring and grounded outlets. The exterior has a fresh update with the popular Farmhouse Style. This home is conveniently located close to Old Town Burleson and Highway's I-35 West and State Highway 174. Come see the rest of the updates in Person!
-
2022-07-03historical Active Option Contract 706-char remark
Show marketing remark (706 chars)
All that is left to do on this Home is Move In! The long list of updates start with Vinyl Plank Flooring, Cabinets, White Quartz Countertops, Island in the Kitchen, Energy Efficient Windows, Tile Flooring in Bathroom, Carpet in all Bedrooms, 12 Inches of Blown in Fiberglass Insulation, Raised Panel Doors, Larger Baseboards and Trim! That doesn't include the roof being replaced in 2022 with Ridge Vent. The home also has a 200 Amp Service panel with copper wiring and grounded outlets. The exterior has a fresh update with the popular Farmhouse Style. This home is conveniently located close to Old Town Burleson and Highway's I-35 West and State Highway 174. Come see the rest of the updates in Person!
-
2022-06-30price $250,000 706-char remark
Show marketing remark (706 chars)
All that is left to do on this Home is Move In! The long list of updates start with Vinyl Plank Flooring, Cabinets, White Quartz Countertops, Island in the Kitchen, Energy Efficient Windows, Tile Flooring in Bathroom, Carpet in all Bedrooms, 12 Inches of Blown in Fiberglass Insulation, Raised Panel Doors, Larger Baseboards and Trim! That doesn't include the roof being replaced in 2022 with Ridge Vent. The home also has a 200 Amp Service panel with copper wiring and grounded outlets. The exterior has a fresh update with the popular Farmhouse Style. This home is conveniently located close to Old Town Burleson and Highway's I-35 West and State Highway 174. Come see the rest of the updates in Person!
-
2022-06-21$255,000 Active 706-char remark
Show marketing remark (706 chars)
All that is left to do on this Home is Move In! The long list of updates start with Vinyl Plank Flooring, Cabinets, White Quartz Countertops, Island in the Kitchen, Energy Efficient Windows, Tile Flooring in Bathroom, Carpet in all Bedrooms, 12 Inches of Blown in Fiberglass Insulation, Raised Panel Doors, Larger Baseboards and Trim! That doesn't include the roof being replaced in 2022 with Ridge Vent. The home also has a 200 Amp Service panel with copper wiring and grounded outlets. The exterior has a fresh update with the popular Farmhouse Style. This home is conveniently located close to Old Town Burleson and Highway's I-35 West and State Highway 174. Come see the rest of the updates in Person!
-
2021-11-22soldstatus
-
2021-11-22soldstatus
-
2000-01-14soldstatus
ⓘ Source: listings_history table (triggers on properties + properties_extension) + one-shot
backfill from property_details.listing_events for pre-trigger history.
Tax reassessment forecast TX · Resets to sale price
- Current annual tax
- $5,074 · $423/mo
- Projected year-2 tax
- $5,074 · $423/mo
- Expected delta
- $0/yr ($0/mo · 0.0%)
ⓘ Screening estimate from a state-policy table — verify with the county assessor before closing.
Climate risk First Street
- Flood 1/10 Low FEMA zone X (unshaded) · 0% chance over 30 yrs
- Wildfire 1/10 Low
- Heat 7/10 Severe 7 d/yr ≥110°F today · 24 d/yr by 30 yrs out
- Wind 6/10 Major 27% chance of damaging wind over 30 yrs
- Air quality 3/10 Moderate 2 unhealthy d/yr today · 3 by 30 yrs out
Nearby sold comps map
Loading sold comps map…
Walkable amenities ~0.75 mi
Loading nearby amenities…
Taxation est. · year 1
- Rental income
- $22,441
- − Mortgage interest
- −$10,811
- − Property taxes
- −$5,074
- − Insurance
- −$965
- − Repairs & maintenance
- −$1,795
- − Management
- −$1,795
- − Depreciation
- −$5,615
- Taxable loss
- −$3,614
- Est. tax savings @ 24.0%
- +$867
- After-tax cash flow
- $412/yr
For passive investors: Depreciation is non-cash, so a rental often shows a tax loss while cash-flowing — sheltering income. Rental losses are passive: they offset passive income freely, and up to $25,000/yr can offset ordinary (W-2) income if you actively participate and your MAGI is under $100k (phasing out to $0 by $150k); unused losses carry forward. On sale, claimed depreciation is recaptured at up to 25%, and gains may owe capital-gains tax (a 1031 exchange can defer both). Figures are a year-1 estimate at your 24.0% rate — not tax advice; consult a CPA.
Schools (NCES district)
- District
- Burleson ISD
- NCES district ID
- 4812180
- Math proficiency
- 41% ▼ -8.00%
- Reading proficiency
- 48% ▼ -3.00%
- Median HH income
- $69,349
- Composite
- 40.05/100
- National rank
- #3818
- State rank
- #236 of 826 in TX
Livability — Burleson
- Score
- 79/100
- State rank
- #53
- US rank
- #2133
Category grades
Schools grade is shown separately in the Schools card above.
Census & demographics
- Census place
- Burleson, TX
- County
- Johnson County · 147,987 people
- City population
- 81,549
- Metro
- Dallas-Fort Worth-Arlington, TX
- Population (ZIP)
- 81,549
- Household income
- $101,138
- Rent vs Own
- Severe rent burden
- 1117.0
Population outlook (Johnson County) Hauer SSP2
- Today (2025)
- 179,678 people
- By 2030
- 189,208 · +5.3%
- By 2040
- 207,261 · +15.4%
- By 2050
- 223,064 · +24.1%
- By 2075
- 259,979 · +44.7%
- By 2100
- 275,395 · +53.3%
Race, ethnicity, and origin ACS 2023
- Neighborhood character
- Predominantly White (69%)
- Race & ethnicity
- White 69% Hispanic / Latino 19% Two or more races 11% Black 6% Asian 1%
- Hispanic origin (detail)
- Mexican 17%
- Common ancestry
- Lithuanian 2% Italian 2% Slovak 2%
- Foreign-born
- 5% · Canada
- Languages at home
- 88% English-only · Spanish 10% Other Indo-European 1%
Political lean MEDSL · Johnson
- 2024 margin
- Solid R (+51.4) · D 23.9% · R 75.3%
- 2008→2024 swing
- -3.9pp toward R · 2008: -47.5pp · 2024: -51.4pp
- All cycles
- 2024: R+51.4 2020: R+53.0 2016: R+58.3 2012: R+55.6 2008: R+47.5
Not yet ingested
- Civics
- —
Market trends
- HPI YoY
- ▼ -141.44%
- Current HPI
- 282.466
- Rent YoY
- ▲ 1.78%
- Metro
- Dallas-Fort Worth-Arlington, TX
- State GDP YoY
- ▲ 3.95%
- F500 in state
- 110
Industry mix (Fortune 500 HQ in TX)
| Industry | F500 HQs | Revenue |
|---|---|---|
| Energy | 16 | $1,198B |
|
||
| Technology | 5 | $198B |
|
||
| Engineering / Construction | 4 | $72B |
|
||
| Energy Services | 3 | $60B |
|
||
| Utilities | 3 | $41B |
|
||
| Healthcare | 2 | $330B |
|
||
Price history
-20.6% since first listed10 events — show timeline
- 2026-05-14 Listed $202,500 NTREIS
- 2022-08-01 Sold (Public Records) — Public Records
- 2022-07-29 Sold (MLS) — NTREIS
- 2022-07-14 Pending — NTREIS
- 2022-07-03 Contingent — NTREIS
- 2022-06-30 Price Changed $250,000 NTREIS
- 2022-06-21 Listed $255,000 NTREIS
- 2021-11-22 Sold (Public Records) — Public Records
- 2021-11-22 Sold (Public Records) — Public Records
- 2000-01-14 Sold (Public Records) — Public Records
Property tax history
+6.5%/yrLatest (2025): $5,074 · +18.2% YoY. Source: county tax records.
Cash-flow waterfall
monthlySold comps — $/sqft
last 12 mo · ≤1 miLoading sold comps…