 Duplex
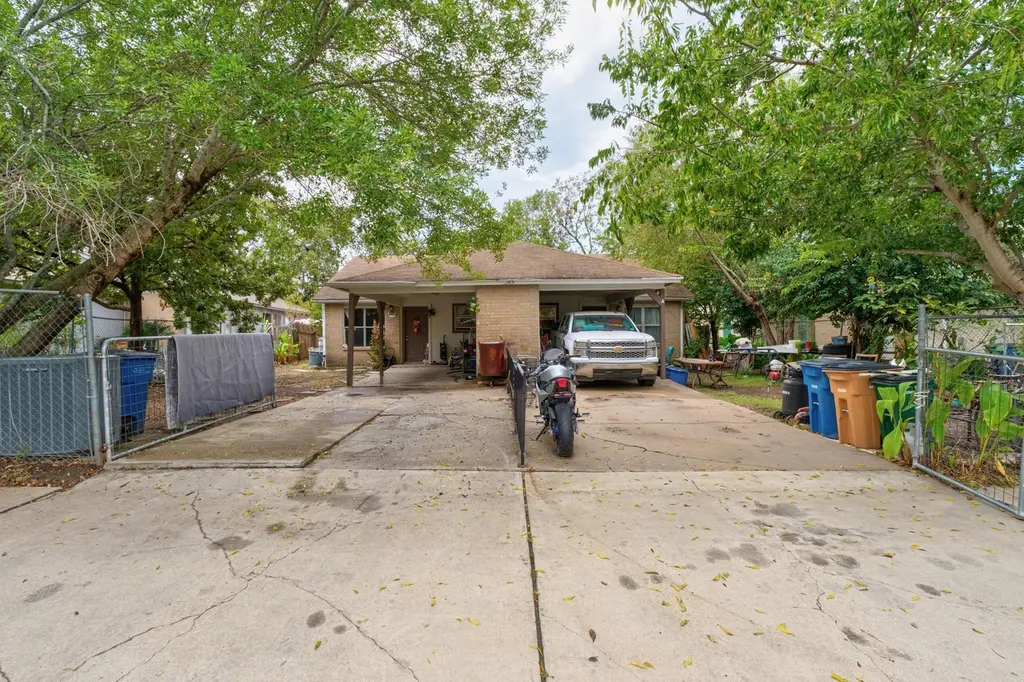
8203 Colony Loop Dr · Austin, TX
Flood risk 1/10 · Minimal
- FEMA flood zone
- X (unshaded)
- Chance of flooding over 30 yrs
- 0.0%
- Est. flood insurance / yr
- $507 – $1,088
Fire risk 5/10 · Moderate
- Est. fire insurance / yr
- $1,222 – $2,270
Heat risk 8/10 · Major
- Hot days now (above 108°F)
- 7 days/yr
- Hot days in 30 yrs
- 23 days/yr
Wind risk 8/10 · Major
- Chance of severe wind over 30 yrs
- 80.0%
Air-quality risk 2/10 · Minimal
- Unhealthy air days now
- 0 days/yr
- Unhealthy air days in 30 yrs
- 1 days/yr
Risk factors via First Street. Map © Google.
Why this score? — see what drove the D grade
The composite is a weighted blend of 9 inputs, each scored 0–100. Each bar is that input's sub-score; the figure is the points it added to the 100-point composite (weight × sub-score).
- Cash flow +12.7/30.0
- ARV discount +7.5/15.0
- Livability +4.1/5.0
- 1% rule +3.8/10.0
- DSCR +3.8/10.0
- Schools +3.4/10.0
- Rent growth +2.6/5.0
- Condition / age +2.5/5.0
- Appreciation +0.0/10.0
$320,000
🖨 Deal sheet 📄 Offer letter ✓ Due diligence
Multi-family units
County records classify this as Multi-Family (2-4 Unit). Listing-text estimate: 2 units. confirmed
Listing remarks MLS
Remodeled duplex in up and coming neighborhood. Lots of ongoing improvements in area. Great for Investors!!! Lots of tenant potential! New carpet, Tile, Countertops, Plumbing Fixtures, Lights/Fans, Wood Privacy Fence. A Must See!!FEMA - Unknown Restrictions: Unknown
Key facts
- Upgraded finishes
- Functional layout
- Peaceful area
Tags
Property features AI
Finance
- Other: Pets: dogs allowed
- Financial info: Two-unit property; Some units leased month-to-month; Reported actual rent for certain units: $1,300
Exterior
- Parking: Attached garage; One covered parking space (total 1)
- Utilities: Electricity available; Natural gas available; Public water; Public sewer
- Home design: Single-story building; Faces northeast; Resale property
- Construction: Brick and wood siding construction; Composition roof; Slab foundation; Year built (source: public records)
- Exterior features: Private yard; Covered patio/porch; Privacy fencing; Front yard
Interior
- Kitchen: Gas range
- Bedrooms: Multiple 2-bedroom units (see unit breakdown)
- Flooring: Laminate; Tile
- Bathrooms: Combination of full and half bathrooms across units
- Heating & cooling: Central heating; Central air conditioning
- Interior features: Ceiling fan(s); Wood-framed windows
- Laundry & utility: In-unit laundry
Neighborhood map
What this means for you Summary
Snapshot
- This is a 2 × 2-bed/1.0-bath units multifamily listed at $320k.
Deal economics
- At list price, monthly cash flow is $-37 ($-438/yr) — negative. Per door: $-18/mo.
- To cash-flow at today's rent, offer at most $314k (2.0% below list).
- To meet the 1% rule (rent ≥ 1% of price), the offer needs to be $281k (12.1% below list).
- Recommended offer: $281k (12.1% below list) — sets the bar for 1% rule.
- Cap rate 6.2% vs local median 1.8% in Austin — top-decile yield for the area; either an underpriced asset or a hidden risk that comps aren't pricing in. Stress-test before assuming the spread holds.
Location & tenants
- Location reads 82/100 on livability (#16 in TX, #1,208 nationally) — a professional / high-income tenant draw. Strengths: amenities A+, commute A+, employment A+; Watch: cost of living D, crime F.
- Austin ISD (urban): math 33% / reading 44% proficiency, ranked #431 of 826 in TX (top 52%) — families likely to look elsewhere, expect single-tenant / working-renter base with shorter leases.
- Market conditions: Rents flat; 176 active listings in the ZIP; 36 comparable units currently listed for rent nearby; rentals at typical pace (median 18d on market — plan ~3-4 weeks tenant-placement turnaround); solid renter incomes; 17,121 units permitted in Travis County in 2024 (11,963 in 5+ unit buildings).
- This rent runs 43% of the median local income ($78k/yr) — at the standard rent-burdened threshold; future hikes will face affordability resistance.
Forward outlook
- Local home prices are declining (-3.0%/yr); year-one equity from $2k of loan paydown is wiped out by about $10k of value loss. Plan a longer hold.
- Travis County population projected at +60% by 2050 — long-run rental-demand tailwind backs the buy-and-hold thesis.
Negotiation context
- It's been on market 203 days — a 12% lower offer ($282k) is reasonable based on typical stale-listing flexibility.
- 3 sale attempts since 21y ago; this cycle's ask has dropped $30k (9%) from the opening price — seller is motivated, your offer sets the floor, not the list.
- Current owner paid $115k; list at $320k implies a 178% gain — meaningful room to come down on a strong offer.
Risks & watch-outs
- Climate carrying-cost: severe wind risk, 80% chance of damaging wind over 30y; moderate wildfire risk; extreme-heat days projected 7→23/yr by 2055 (HVAC capex compounding) — expect insurance premiums to compound above CPI over the hold.
Questions for the listing agent
- What do current leases actually rent for vs. the listed asking? Can we see a recent rent roll and the last 12 months of T-12 income?
- It's been on market 203 days. Have you received any prior offers? Is the seller open to a 12% concession, seller financing, or rate buy-down credit?
- Can we see the unit-by-unit rent roll, current vacancy, and any below-market leases? What's the average tenancy length?
- What capital expenditures (roof, boiler, parking lot, exteriors) have been made in the last 5 years, and what's planned in the next 2?
- Why hasn't it sold? Are there any deal-killer items the seller is aware of (foundation, flood, title, zoning, code violations)?
- Is there a deadline driving the sale (1031 exchange, divorce, estate, relocation)? That informs how much negotiation room exists.
- Crime grade is F in this area — have there been break-ins, vandalism, or insurance claims at this property in the last 3 years? What carrier currently insures it and at what premium?
- The area grade is low — what's the realistic commute time and amenity access for the typical tenant pool here? Any planned neighborhood developments (good or bad) we should know about?
- What's the average days-on-market for RENTAL listings here right now (not sales)? A rising rental-DOM trend means longer vacancies and softer asking-rent achievability than the comps imply.
- What's the recent tenant-quality profile in this submarket — average credit score on applications, eviction rate, late-payment / NSF rate, and stable-employment percentage? A property-management company in the area should have these aggregated.
- How much new apartment / multifamily construction is in the pipeline within 1–3 miles? Heavy new supply (>2% of stock underway) typically softens rents 12–24 months out; light construction supports rent growth.
Investment metrics
- 1% rule
- 0.88% ✗
- Cap rate
- 6.16%
- Cash-on-cash
- -0.49%
- DSCR
- 0.98
- GRM
- 9.5
CMA / ARV
- ARV (on-the-fly)
- $319,884
- Comps found
- 1
Show comp detail 1 sale within ~0.75 mi
| Address | Dist | Beds/Ba | Sqft | Sold | Price | $/sf | Match |
|---|---|---|---|---|---|---|---|
| 8203 Colony Loop Dr | 0.00mi | 4/2.0 | 1,748 (0%) | 1mo | $320,000 | $183 | 95 |
Match score weights: distance 35% · size 25% · config 20% · recency 20%. Top-matched comps best support the ARV.
Projected returns pro-forma
-3.0% appreciation · 0.26% rent growth · sell at horizon
- IRR
- -20.3%
- Equity multiple
- 0.31×
- Total profit
- $-61,660
- Equity at exit
- $47,713
- IRR
- -21.1%
- Equity multiple
- 0.04×
- Total profit
- $-85,728
- Equity at exit
- $27,668
Cash invested: $89,600 (down + closing). Projections, not guarantees.
Landlord ↔ Tenant lean methodology
- Overall (STATE)
- 87 Strongly Landlord-Friendly
- State Texas
- 87 Strongly Landlord-Friendly · R+5
- County
- — inherits STATE
- City
- — inherits STATE
ZIP-level market 78724
- Home prices YoY
- -13.1%
- Rents YoY
- 0.3%
- Active inventory
- 176
- Price-to-rent
- 19.0×
Monthly cashflow live
- Estimated rent
- $2,814 high interval (Pro) →
- Mortgage (P&I)
- −$1,678
- Tax from tax record
- −$448 /mo · $5,378/yr
- Insurance
- −$133
- HOA
- −$0
- Vacancy / Maint / Mgmt
- −$591
- Net cashflow
- $-37
Break-even live
2-unit breakdown (identical units grouped — click to expand)
| Units | Beds | Baths | Est. rent |
|---|---|---|---|
| 2× units | 2 | 1 | $2,814 |
| #1 | 2 | 1 | $1,407 |
| #2 | 2 | 1 | $1,407 |
| Total (2 units) | $2,814 | ||
UW: 25.0% down · 7.5% · 30yr · 1.5% tax · 5.0% vac · 8.0% maint · 8.0% mgmt
Financing live
Cash to close
- Down payment
- $80,000
- Closing costs
- $9,600
- Reserves months
- —
- Total cash needed
- —
Loan-product check · same deal, 3 products live
Conventional
25% down · 7.5% · 30yr
- Down + closing
- —
- Monthly P&I
- —
- Monthly cashflow
- —
- DSCR
- —
- Eligible?
- —
Personal DTI + credit; lowest rate.
DSCR
20% down · 8.5% · 30yr
- Down + closing
- —
- Monthly P&I
- —
- Monthly cashflow
- —
- DSCR
- —
- Eligible?
- —
No personal income docs; deal must DSCR.
Hard money
10% down · 12.0% · 12mo
- Down + closing
- —
- Monthly P&I
- —
- Monthly cashflow
- —
- DSCR
- —
- Eligible?
- —
Short-term bridge; refi at stabilization.
Rent comps 36 comps
| Address | Beds | Baths | Sqft | Rent | $/sqft | DOM | Units | Dist |
|---|---|---|---|---|---|---|---|---|
| 7000 Decker Ln Austin, TX | 1.0–4.0 | 1.0–2.0 | 955 | $1,809 | $1.89 | 2d | 19 | 0.20mi |
| 8401 Garcreek Cir Austin, TX | 3.0 | 2.0 | 1200 | $1,850 | $1.54 | 2d | 1 | 0.21mi |
| 8305 Garcreek Cir Unit A&C Austin, TX | 3.0 | 2.5 | 1100 | $1,399 | $1.27 | 43d | 1 | 0.23mi |
| 8101 Loyola Ln Austin, TX | 1.0–3.0 | 1.0–3.5 | 1333 | $3,049 | $2.29 | 2d | 99 | 0.51mi |
| 8304 Mimi Ln Austin, TX | 4.0 | 2.5 | 2138 | $2,425 | $1.13 | 23d | 1 | 0.54mi |
| 8340 Mimi Ln Austin, TX | 3.0 | 2.5 | 1811 | $2,700 | $1.49 | 4d | 1 | 0.55mi |
| 8025 City Top Blvd Austin, TX | 3.0 | 2.0 | 1472 | $2,300 | $1.56 | 23d | 1 | 0.57mi |
| 8220 Linnie Ln Austin, TX | 4.0 | 2.5 | 2200 | $2,700 | $1.23 | 23d | 1 | 0.59mi |
| 7717 Lowenfield Dr Austin, TX | 3.0 | 2.0 | 1516 | $2,270 | $1.50 | 23d | 1 | 0.61mi |
| 6107 Decker Ln Austin, TX | 1.0–3.0 | 1.0–2.0 | 991 | $2,785 | $2.81 | 1d | 62 | 0.65mi |
| 7925 Linnie Ln Austin, TX | 4.0 | 2.5 | 2216 | $2,395 | $1.08 | 4d | 1 | 0.66mi |
| 7512 Daves Landing Dr Austin, TX | 3.0 | 2.0 | 1366 | $2,200 | $1.61 | 23d | 1 | 0.67mi |
| 6109 Decker Ln Austin, TX | 3.0 | 2.0 | 1513 | $2,275 | $1.50 | 16d | 1 | 0.68mi |
| 9351 Decker Lake Rd Austin, TX | 1.0–4.0 | 1.0–2.0 | 1002 | $1,999 | $2.00 | 1d | 12 | 0.81mi |
| 6308 Perlita Dr Austin, TX | 3.0 | 2.5 | 1438 | $1,895 | $1.32 | 43d | 1 | 0.85mi |
| 8000 Decker Ln Unit 8033 Austin, TX | 3.0 | 2.0 | 1227 | $1,763 | $1.44 | 3d | 1 | 0.88mi |
| 6013 Florencia Ln Austin, TX | 3.0 | 3.0 | 1957 | $3,600 | $1.84 | 11d | 1 | 0.91mi |
| 7120 Carwill Dr Austin, TX | 3.0 | 2.0 | 1500 | $2,000 | $1.33 | 14d | 1 | 0.92mi |
| 6809 Jaired Dr Austin, TX | 3.0 | 2.0 | 1162 | $1,900 | $1.64 | 43d | 1 | 0.94mi |
| 6902 Colony Park Dr Austin, TX | 4.0 | 1.5 | 1500 | $2,250 | $1.50 | 23d | 1 | 0.95mi |
| 7320 Muffin Dr Austin, TX | 3.0 | 2.0 | 1499 | $2,045 | $1.36 | 14d | 1 | 0.97mi |
| 5928 Signal Pt Austin, TX | 4.0 | 2.0 | 1500 | $1,800 | $1.20 | 44d | 1 | 1.07mi |
| 7601 Daffan Ln Unit 711 Austin, TX | 3.0 | 2.0 | 1568 | $1,763 | $1.12 | 17d | 1 | 1.09mi |
| 5929 Alsace Trl Austin, TX | 3.0 | 2.0 | 1320 | $1,950 | $1.48 | 23d | 1 | 1.10mi |
| 5724 Signal Pt Austin, TX | 3.0 | 2.0 | 1320 | $1,725 | $1.31 | 43d | 1 | 1.15mi |
| 7601 Daffan Ln Austin, TX | 3.0–4.0 | 2.0 | 1400 | $1,599 | $1.14 | 4d | 1 | 1.16mi |
| 7009 Zachary Dr Austin, TX | 3.0 | 2.0 | 1827 | $2,900 | $1.59 | 17d | 1 | 1.19mi |
| 9212 China Rose Dr Austin, TX | 3.0 | 2.0 | 1429 | $1,800 | $1.26 | 43d | 1 | 1.21mi |
| 6400 Loyola Ln Austin, TX | 2.0–3.0 | 2.0 | 1035 | $1,349 | $1.30 | 12d | 1 | 1.23mi |
| 5813 Knoll Pines Pass Austin, TX | 3.0 | 2.0 | 1516 | $1,750 | $1.15 | 4d | 1 | 1.26mi |
| 5517 Agatha Cir Austin, TX | 3.0 | 2.5 | 1627 | $2,850 | $1.75 | 4d | 1 | 1.27mi |
| 6200 Loyola Ln Austin, TX | 1.0–3.0 | 1.0–2.0 | 946 | $1,119 | $1.18 | 4d | 9 | 1.32mi |
| 5717 Levenwood Ln Austin, TX | 3.0 | 2.0 | 1510 | $1,895 | $1.25 | 17d | 1 | 1.33mi |
| 5334 Sendero Hills Pkwy Austin, TX | 3.0 | 3.0 | 2166 | $4,299 | $1.98 | 23d | 1 | 1.41mi |
| 9025 Sun Shower Bnd Austin, TX | 3.0 | 2.0 | 1704 | $2,200 | $1.29 | 23d | 1 | 1.42mi |
| 7506 Walnut Creek Hike and Bike Trl Austin, TX | 3.0 | 2.0 | 1456 | $1,249 | $0.86 | 43d | 1 | 1.44mi |
Listing history 14 events
-
2026-05-22status Pending
-
2026-05-01historical Active Under Contract
-
2026-04-21price $320,000
-
2025-10-31$350,000 Active
-
2006-02-17soldstatus $115,000
-
2006-02-16soldstatus 266-char remark
Show marketing remark (266 chars)
Remodeled duplex in up and coming neighborhood. Lots of ongoing improvements in area. Great for Investors!!! Lots of tenant potential! New carpet, Tile, Countertops, Plumbing Fixtures, Lights/Fans, Wood Privacy Fence. A Must See!!FEMA - Unknown Restrictions: Unknown
-
2006-01-18historical 266-char remark
Show marketing remark (266 chars)
Remodeled duplex in up and coming neighborhood. Lots of ongoing improvements in area. Great for Investors!!! Lots of tenant potential! New carpet, Tile, Countertops, Plumbing Fixtures, Lights/Fans, Wood Privacy Fence. A Must See!!FEMA - Unknown Restrictions: Unknown
-
2005-09-14$120,000 266-char remark
Show marketing remark (266 chars)
Remodeled duplex in up and coming neighborhood. Lots of ongoing improvements in area. Great for Investors!!! Lots of tenant potential! New carpet, Tile, Countertops, Plumbing Fixtures, Lights/Fans, Wood Privacy Fence. A Must See!!FEMA - Unknown Restrictions: Unknown
-
2005-06-12historical
-
2005-06-07soldstatus
-
2005-05-18
-
1988-11-30soldstatus $34,900
-
1987-02-03soldstatus
-
1984-04-06soldstatus
ⓘ Source: listings_history table (triggers on properties + properties_extension) + one-shot
backfill from property_details.listing_events for pre-trigger history.
Tax reassessment forecast TX · Resets to sale price
- Current annual tax
- $5,378 · $448/mo
- Projected year-2 tax
- $5,856 · $488/mo
- Expected delta
- +$478/yr (+$40/mo · 8.9%)
ⓘ Screening estimate from a state-policy table — verify with the county assessor before closing.
Climate risk First Street
- Flood 1/10 Low FEMA zone X (unshaded) · 0% chance over 30 yrs
- Wildfire 5/10 Major
- Heat 8/10 Severe 7 d/yr ≥108°F today · 23 d/yr by 30 yrs out
- Wind 8/10 Severe 80% chance of damaging wind over 30 yrs
- Air quality 2/10 Low 0 unhealthy d/yr today · 1 by 30 yrs out
Nearby sold comps map
Loading sold comps map…
Walkable amenities ~0.75 mi
Loading nearby amenities…
Taxation est. · year 1
- Rental income
- $33,768
- − Mortgage interest
- −$17,925
- − Property taxes
- −$5,378
- − Insurance
- −$1,600
- − Repairs & maintenance
- −$2,701
- − Management
- −$2,701
- − Depreciation
- −$9,309
- Taxable loss
- −$5,847
- Est. tax savings @ 24.0%
- +$1,403
- After-tax cash flow
- $965/yr
For passive investors: Depreciation is non-cash, so a rental often shows a tax loss while cash-flowing — sheltering income. Rental losses are passive: they offset passive income freely, and up to $25,000/yr can offset ordinary (W-2) income if you actively participate and your MAGI is under $100k (phasing out to $0 by $150k); unused losses carry forward. On sale, claimed depreciation is recaptured at up to 25%, and gains may owe capital-gains tax (a 1031 exchange can defer both). Figures are a year-1 estimate at your 24.0% rate — not tax advice; consult a CPA.
Schools (NCES district)
- District
- Austin ISD
- NCES district ID
- 4808940
- Math proficiency
- 33% ▼ -19.00%
- Reading proficiency
- 44% ▼ -7.00%
- Median HH income
- $54,627
- Composite
- 33.65/100
- National rank
- #5397
- State rank
- #431 of 826 in TX
Livability — Austin
- Score
- 82/100
- State rank
- #16
- US rank
- #1208
Category grades
Schools grade is shown separately in the Schools card above.
Census & demographics
- Census place
- Austin, TX
- County
- Travis County · 1,299,254 people
- City population
- 1,066,854
- Metro
- Austin-Round Rock-Georgetown, TX
- Population (ZIP)
- 31,103
- Household income
- $77,926
- Rent vs Own
- Severe rent burden
- 873.0
Population outlook (Travis County) Hauer SSP2
- Today (2025)
- 1,545,133 people
- By 2030
- 1,729,269 · +11.9%
- By 2040
- 2,097,596 · +35.8%
- By 2050
- 2,463,890 · +59.5%
- By 2075
- 3,249,374 · +110.3%
- By 2100
- 3,801,868 · +146.1%
Race, ethnicity, and origin ACS 2023
- Neighborhood character
- Diverse neighborhood (Simpson 0.56)
- Race & ethnicity
- Hispanic / Latino 63% Two or more races 30% Black 15% White 15% Asian 3%
- Hispanic origin (detail)
- Mexican 54% Puerto Rican 2% Cuban 1%
- Common ancestry
- Slovak 2% Lithuanian 1%
- Foreign-born
- 23% · Canada, Jamaica, China
- Languages at home
- 48% English-only · Spanish 48% Other Asian/Pacific 1% Other Indo-European 1%
Political lean MEDSL · Travis
- 2024 margin
- Solid D (+39.3) · D 68.8% · R 29.4% · Other 1.8%
- 2008→2024 swing
- +9.9pp toward D · 2008: 29.4pp · 2024: 39.3pp
- All cycles
- 2024: D+39.3 2020: D+45.0 2016: D+38.9 2012: D+23.9 2008: D+29.4
Not yet ingested
- Civics
- —
Market trends
- HPI YoY
- ▼ -42.92%
- Current HPI
- 284.1007
- Rent YoY
- ▲ 0.26%
- Metro
- Austin-Round Rock-Georgetown, TX
- State GDP YoY
- ▲ 3.95%
- F500 in state
- 110
Industry mix (Fortune 500 HQ in TX)
| Industry | F500 HQs | Revenue |
|---|---|---|
| Energy | 16 | $1,198B |
|
||
| Technology | 5 | $198B |
|
||
| Engineering / Construction | 4 | $72B |
|
||
| Energy Services | 3 | $60B |
|
||
| Utilities | 3 | $41B |
|
||
| Healthcare | 2 | $330B |
|
||
Price history
+816.9% since first listed14 events — show timeline
- 2026-05-22 Pending — Unlock MLS
- 2026-05-01 Contingent — Unlock MLS
- 2026-04-21 Price Changed $320,000 Unlock MLS
- 2025-10-31 Listed $350,000 Unlock MLS
- 2006-02-17 Sold (Public Records) $115,000 Public Records
- 2006-02-16 Sold (MLS) — Unlock MLS
- 2006-01-18 Delisted — Unlock MLS
- 2005-09-14 Listed $120,000 Unlock MLS
- 2005-06-12 Delisted — Unlock MLS
- 2005-06-07 Sold (Public Records) — Public Records
- 2005-05-18 Listed — Unlock MLS
- 1988-11-30 Sold (Public Records) $34,900 Public Records
- 1987-02-03 Sold (Public Records) — Public Records
- 1984-04-06 Sold (Public Records) — Public Records
Property tax history
+4.8%/yrLatest (2026): $5,378 · -27.2% YoY. Source: county tax records.
Cash-flow waterfall
monthlySold comps — $/sqft
last 12 mo · ≤1 miLoading sold comps…