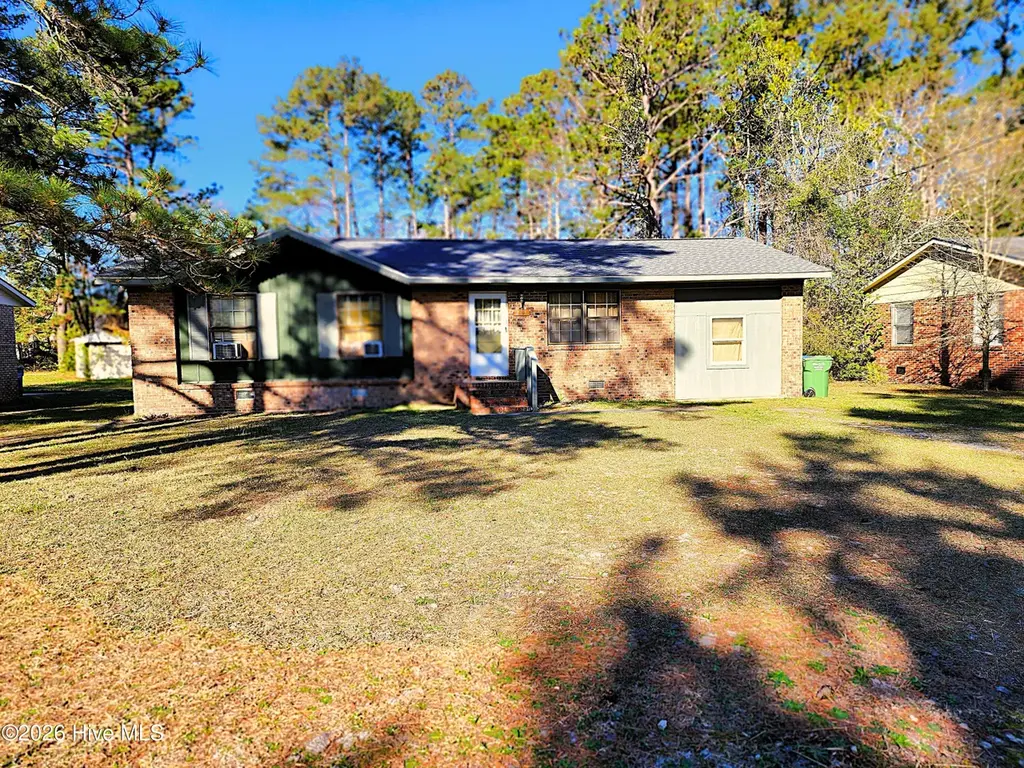
213 Barclay Hills Dr · Wilmington, NC
Flood risk 1/10 · Minimal
- FEMA flood zone
- X (unshaded)
- Chance of flooding over 30 yrs
- 0.0%
- Est. flood insurance / yr
- $507 – $1,088
Fire risk 4/10 · Minor
- Est. fire insurance / yr
- $906 – $1,684
Heat risk 9/10 · Severe
- Hot days now (above 105°F)
- 7 days/yr
- Hot days in 30 yrs
- 19 days/yr
Wind risk 8/10 · Major
- Chance of severe wind over 30 yrs
- 99.0%
Air-quality risk 2/10 · Minimal
- Unhealthy air days now
- 1 days/yr
- Unhealthy air days in 30 yrs
- 1 days/yr
Risk factors via First Street. Map © Google.
Why this score? — see what drove the C+ grade
The composite is a weighted blend of 9 inputs, each scored 0–100. Each bar is that input's sub-score; the figure is the points it added to the 100-point composite (weight × sub-score).
- Cash flow +25.4/30.0
- DSCR +8.4/10.0
- ARV discount +7.5/15.0
- 1% rule +5.8/10.0
- Schools +4.3/10.0
- Rent growth +3.5/5.0
- Livability +3.5/5.0
- Condition / age +2.5/5.0
- Appreciation +0.0/10.0
$160,000
🖨 Deal sheet 📄 Offer letter ✓ Due diligence
Listing remarks
Home to be sold as-is.
Key facts
- 0.41 acre lot
- Built 1971
Property features AI
Exterior
- Parking: Unpaved parking; Driveway; No garage
- Utilities: Cable available
- Home design: Single-family residence; One story; Entry level: 1
- Construction: Built with block, brick, and frame materials; Shingle roof
- Exterior features: No patio or porch; No fencing; Paved road access
Interior
- Bedrooms: Total of 7 rooms (includes bedrooms and living spaces)
- Bathrooms: 1 full bathroom; 1 half bathroom
- Heating & cooling: Baseboard electric heating; Wall/window air conditioning units
- Interior features: Crawl space basement; Has view
Neighborhood map
What this means for you Summary
Snapshot
- This is a 3-bed/1.5-bath single-family listed at $160k.
Deal economics
- At list price, monthly cash flow is $369 ($4k/yr) — positive.
- The deal already cash-flows at list — no discount required.
- Meets the 1% rule at list price ($2k rent vs $160k).
- Cap rate 9.1% vs local median 2.6% in Wilmington — top-decile yield for the area; either an underpriced asset or a hidden risk that comps aren't pricing in. Stress-test before assuming the spread holds.
Location & tenants
- Location reads 70/100 on livability (#142 in NC) — a middle-class / working-renter tenant base. Strengths: health & safety A+, cost of living B+, housing B+; Watch: amenities C-, employment C-, crime F.
- New Hanover County Schools (urban): math 48% / reading 53% proficiency, ranked #61 of 178 in NC (top 34%) — acceptable for families but not a draw, mixed tenant base, ~2y average lease.
- Zoned schools: College Park Elementary (math 23% / reading 33%, grade F, #1,022 of 1,410 statewide, top 73%, 457 students, 99% FRL); M C S Noble Middle (math 57% / reading 62%, grade B, #48 of 475 statewide, top 11%, 652 students, 32% FRL); Emsley A Laney High (math 62% / reading 63%, grade B-, #179 of 535 statewide, top 34%, 2,220 students, 42% FRL) — zoned schools average 58% FRL vs 42% district-wide (16 pts higher); higher-poverty schools than district average — tighter screening recommended.
- Market conditions: Rents rising (+3.9%/yr); 183 active listings in the ZIP; 32 comparable units currently listed for rent nearby; rentals at typical pace (median 21d on market — plan ~3-4 weeks tenant-placement turnaround); 2,581 units permitted in New Hanover County in 2024 (1,185 in 5+ unit buildings).
Forward outlook
- Local home prices are declining (-3.0%/yr); year-one equity from $1k of loan paydown is wiped out by about $5k of value loss. Plan a longer hold.
- New Hanover County population projected at +37% by 2050 — long-run rental-demand tailwind backs the buy-and-hold thesis.
- At projected returns (-3.0% appreciation + 3.9% rent growth), your $45k cash investment doubles in ~10 years — after that, you're playing with house money.
Negotiation context
- Only 1 days on market — expect competitive offers; lowballing is unlikely to land.
- Current owner paid $27k; list at $160k implies a 493% gain — meaningful room to come down on a strong offer.
Risks & watch-outs
- Climate carrying-cost: severe wind risk, 99% chance of damaging wind over 30y; extreme-heat days projected 7→19/yr by 2055 (HVAC capex compounding) — expect insurance premiums to compound above CPI over the hold.
Questions for the listing agent
- Built in 1971 — when were the roof, HVAC, electrical panel, plumbing, and water heater last replaced?
- Is there a deadline driving the sale (1031 exchange, divorce, estate, relocation)? That informs how much negotiation room exists.
- Crime grade is F in this area — have there been break-ins, vandalism, or insurance claims at this property in the last 3 years? What carrier currently insures it and at what premium?
- What's the average days-on-market for RENTAL listings here right now (not sales)? A rising rental-DOM trend means longer vacancies and softer asking-rent achievability than the comps imply.
- What's the recent tenant-quality profile in this submarket — average credit score on applications, eviction rate, late-payment / NSF rate, and stable-employment percentage? A property-management company in the area should have these aggregated.
- How much new for-sale + rental construction is in the pipeline within 1–3 miles? Heavy new supply typically softens prices + rents 12–24 months out; constrained supply supports both.
Investment metrics
- 1% rule
- 1.08% ✓
- Cap rate
- 9.06%
- Cash-on-cash
- 9.89%
- DSCR
- 1.44
- GRM
- 7.7
CMA / ARV
- ARV (on-the-fly)
- $325,950
- Comps found
- 12
Show comp detail 12 sales within ~0.75 mi
| Address | Dist | Beds/Ba | Sqft | Sold | Price | $/sf | Match |
|---|---|---|---|---|---|---|---|
| 210 Barclay Hills Dr | 0.04mi | 3/1.5 | 1,352 (+2%) | 17mo | $285,000 | $211 | 80 |
| 607 Sharease Cir | 0.32mi | 3/2.0 | 1,203 (-9%) | 2mo | $312,000 | $259 | 66 |
| 4516 Crawdad Ct | 0.62mi | 3/2.0 | 1,320 (-0%) | 8mo | $265,000 | $201 | 62 |
| 109 N 31st St | 0.54mi | 3/2.0 | 1,406 (+6%) | 1mo | $175,000 | $124 | 62 |
| 222 Evans Street A | 0.41mi | 3/1.0 | 1,183 (-11%) | 2mo | $160,125 | $135 | 59 |
| 628 Sharease Cir | 0.36mi | 3/2.0 | 1,202 (-9%) | 10mo | $300,000 | $250 | 57 |
| 26 Brogdon St Lot 31 | 0.58mi | 3/2.5 | 1,414 (+7%) | 1mo | $370,000 | $262 | 57 |
| 620 Tabor Ln | 0.51mi | 3/2.0 | 1,200 (-9%) | 2mo | $295,000 | $246 | 57 |
| 3612 Prices Ln | 0.25mi | 3/2.0 | 1,474 (+11%) | 16mo | $351,000 | $238 | 54 |
| 510 Manly Ave | 0.23mi | 3/2.0 | 1,146 (-14%) | 13mo | $199,900 | $174 | 54 |
| 4217 Sunglow Dr | 0.49mi | 3/2.0 | 1,186 (-10%) | 6mo | $297,500 | $251 | 53 |
| 4247 Sunglow Dr | 0.51mi | 3/2.0 | 1,160 (-12%) | 16mo | $325,000 | $280 | 41 |
Match score weights: distance 35% · size 25% · config 20% · recency 20%. Top-matched comps best support the ARV.
Projected returns pro-forma
-3.0% appreciation · 3.9% rent growth · sell at horizon
- IRR
- -0.5%
- Equity multiple
- 0.98×
- Total profit
- $-871
- Equity at exit
- $23,857
- IRR
- 10.0%
- Equity multiple
- 1.80×
- Total profit
- $35,933
- Equity at exit
- $13,834
Cash invested: $44,800 (down + closing). Projections, not guarantees.
Landlord ↔ Tenant lean methodology
- Overall (STATE)
- 85 Strongly Landlord-Friendly
- State North Carolina
- 85 Strongly Landlord-Friendly · R+3
- County
- — inherits STATE
- City
- — inherits STATE
ZIP-level market 28405
- Rents YoY
- 3.9%
- Active inventory
- 183
- Price-to-rent
- 7.7×
Monthly cashflow live
- Estimated rent
- $1,723 high interval (Pro) →
- Mortgage (P&I)
- −$839
- Tax from tax record
- −$86 /mo · $1,031/yr
- Insurance
- −$67
- HOA
- −$0
- Vacancy / Maint / Mgmt
- −$362
- Net cashflow
- $369
Break-even live
UW: 25.0% down · 7.5% · 30yr · 1.5% tax · 5.0% vac · 8.0% maint · 8.0% mgmt
Financing live
Cash to close
- Down payment
- $40,000
- Closing costs
- $4,800
- Reserves months
- —
- Total cash needed
- —
Loan-product check · same deal, 3 products live
Conventional
25% down · 7.5% · 30yr
- Down + closing
- —
- Monthly P&I
- —
- Monthly cashflow
- —
- DSCR
- —
- Eligible?
- —
Personal DTI + credit; lowest rate.
DSCR
20% down · 8.5% · 30yr
- Down + closing
- —
- Monthly P&I
- —
- Monthly cashflow
- —
- DSCR
- —
- Eligible?
- —
No personal income docs; deal must DSCR.
Hard money
10% down · 12.0% · 12mo
- Down + closing
- —
- Monthly P&I
- —
- Monthly cashflow
- —
- DSCR
- —
- Eligible?
- —
Short-term bridge; refi at stabilization.
Rent comps 32 comps
| Address | Beds | Baths | Sqft | Rent | $/sqft | DOM | Units | Dist |
|---|---|---|---|---|---|---|---|---|
| 200 Henry St Wilmington, NC | 3.0 | 2.0 | 1232 | $1,795 | $1.46 | 13d | 1 | 0.35mi |
| 700 Indica Ct #302 Wilmington, NC | 3.0 | 2.0 | 1300 | $1,400 | $1.08 | 21d | 1 | 0.47mi |
| 105 Montgomery Ave Wilmington, NC | 3.0 | 1.0 | 1000 | $1,750 | $1.75 | 21d | 1 | 0.50mi |
| 4615 McClelland Dr Wilmington, NC | 2.0 | 2.0 | 1029 | $1,350 | $1.31 | 21d | 1 | 0.65mi |
| 4633 Crawdad Ct Wilmington, NC | 2.0 | 2.0 | 1383 | $1,795 | $1.30 | 13d | 1 | 0.70mi |
| 331 S Turners Run Wilmington, NC | 1.0–3.0 | 1.0–2.0 | 905 | $1,279 | $1.41 | 21d | 1 | 0.71mi |
| 511 Cobblestone Dr Wilmington, NC | 1.0–3.0 | 1.0–3.0 | 875 | $1,650 | $1.89 | 13d | 14 | 0.73mi |
| 245 S Kerr Ave Wilmington, NC | 2.0 | 1.0–2.0 | 825 | $1,399 | $1.69 | 21d | 1 | 0.78mi |
| 361 Darlington Ave Wilmington, NC | 1.0–3.0 | 1.0–3.0 | 1039 | $1,772 | $1.71 | 13d | 21 | 0.82mi |
| 4711 Azalea Landing Dr Wilmington, NC | 3.0 | 1.0–2.0 | 1188 | $2,744 | $2.31 | 13d | 28 | 0.96mi |
| 4801 Kubeck Ct Unit 4849 Wilmington, NC | 2.0 | 2.0 | 900 | $1,150 | $1.28 | 21d | 1 | 1.03mi |
| 2603 McClammy St Unit 1 Wilmington, NC | 3.0 | 1.0 | 1082 | $1,900 | $1.76 | 21d | 1 | 1.04mi |
| 376 S Kerr Ave #301 Wilmington, NC | 3.0 | 3.0 | 962 | $1,395 | $1.45 | 21d | 1 | 1.07mi |
| 5034 Hunt Club Rd Wilmington, NC | 1.0–2.0 | 1.0–1.5 | 845 | $1,175 | $1.39 | 21d | 1 | 1.07mi |
| 370 S Kerr Ave #101 Wilmington, NC | 3.0 | 3.0 | 962 | $1,395 | $1.45 | 21d | 1 | 1.08mi |
| 5002 Hunters Trl Unit 5002-10 Wilmington, NC | 2.0 | 2.0 | 1297 | $1,600 | $1.23 | 21d | 1 | 1.11mi |
| 137 Dapple Ct Wilmington, NC | 1.0–2.0 | 1.5–2.0 | 775 | $1,575 | $2.03 | 13d | 14 | 1.11mi |
| 414 Mill Creek Ct Wilmington, NC | 1.0–3.0 | 1.0–3.0 | 1075 | $2,319 | $2.16 | 13d | 44 | 1.13mi |
| 412 S Kerr Ave Wilmington, NC | 2.0 | 1.0 | 950 | $1,675 | $1.76 | 13d | 1 | 1.17mi |
| 5208 Ringo Dr Wilmington, NC | 1.0–2.0 | 1.0–2.0 | 700 | $1,475 | $2.11 | 21d | 15 | 1.19mi |
| 909 Litchfield Way Unit 909-H Wilmington, NC | 3.0 | 2.0 | 1364 | $1,800 | $1.32 | 21d | 1 | 1.25mi |
| 4901 Randall Pkwy Wilmington, NC | 1.0–2.0 | 1.0 | 737 | $1,375 | $1.86 | 21d | 1 | 1.25mi |
| 522 S Kerr Ave Wilmington, NC | 2.0 | 2.0 | 892 | $1,198 | $1.34 | 21d | 2 | 1.25mi |
| 901 Litchfield Way Unit 901-K Wilmington, NC | 2.0 | 2.0 | 1234 | $1,500 | $1.22 | 21d | 1 | 1.26mi |
| 719 Melba Ct Unit 719-I Wilmington, NC | 3.0 | 2.0 | 1300 | $1,800 | $1.38 | 21d | 1 | 1.28mi |
| 703 Grathwol Dr Wilmington, NC | 1.0–2.0 | 1.0–2.0 | 726 | $1,433 | $1.97 | 13d | 15 | 1.29mi |
| 803 Bryce Ct Unit 803-K Wilmington, NC | 3.0 | 2.0 | 1364 | $1,700 | $1.25 | 21d | 1 | 1.38mi |
| 4524 Kimberly Way Wilmington, NC | 2.0 | 2.0 | 935 | $1,450 | $1.55 | 21d | 1 | 1.40mi |
| 610 S Kerr Ave Wilmington, NC | 2.0 | 2.0 | 1042 | $1,650 | $1.58 | 21d | 1 | 1.41mi |
| 614 S Kerr Ave Unit 308 Wilmington, NC | 2.0 | 2.0 | 1042 | $1,750 | $1.68 | 21d | 1 | 1.42mi |
| 615 S Kerr Ave Wilmington, NC | 3.0 | 3.0 | 1000 | $782 | $0.78 | 21d | 8 | 1.43mi |
| 505 Alpine Dr Wilmington, NC | 1.0–3.0 | 1.0–2.0 | 1009 | $1,810 | $1.79 | 13d | 9 | 1.49mi |
Listing history 3 events
-
2026-05-24status Pending
-
2026-05-23$160,000 Active
-
1977-03-01soldstatus $27,000
ⓘ Source: listings_history table (triggers on properties + properties_extension) + one-shot
backfill from property_details.listing_events for pre-trigger history.
Tax reassessment forecast NC · Resets to sale price
- Current annual tax
- $1,031 · $86/mo
- Projected year-2 tax
- $1,312 · $109/mo
- Expected delta
- +$281/yr (+$23/mo · 27.2%)
ⓘ Screening estimate from a state-policy table — verify with the county assessor before closing.
Climate risk First Street
- Flood 1/10 Low FEMA zone X (unshaded) · 0% chance over 30 yrs
- Wildfire 4/10 Moderate
- Heat 9/10 Extreme 7 d/yr ≥105°F today · 19 d/yr by 30 yrs out
- Wind 8/10 Severe 99% chance of damaging wind over 30 yrs
- Air quality 2/10 Low 1 unhealthy d/yr today · 1 by 30 yrs out
Nearby sold comps map
Loading sold comps map…
Walkable amenities ~0.75 mi
Loading nearby amenities…
Taxation est. · year 1
- Rental income
- $20,674
- − Mortgage interest
- −$8,962
- − Property taxes
- −$1,031
- − Insurance
- −$800
- − Repairs & maintenance
- −$1,654
- − Management
- −$1,654
- − Depreciation
- −$4,655
- Taxable income
- $1,918
- Est. tax owed @ 24.0%
- −$460
- After-tax cash flow
- $3,972/yr
For passive investors: Depreciation is non-cash, so a rental often shows a tax loss while cash-flowing — sheltering income. Rental losses are passive: they offset passive income freely, and up to $25,000/yr can offset ordinary (W-2) income if you actively participate and your MAGI is under $100k (phasing out to $0 by $150k); unused losses carry forward. On sale, claimed depreciation is recaptured at up to 25%, and gains may owe capital-gains tax (a 1031 exchange can defer both). Figures are a year-1 estimate at your 24.0% rate — not tax advice; consult a CPA.
Schools (NCES district)
- District
- New Hanover County Schools
- NCES district ID
- 3703330
- Math proficiency
- 48% ▼ -3.00%
- Reading proficiency
- 53% ▬ 0.00%
- Median HH income
- $49,406
- Composite
- 43.13/100
- National rank
- #3081
- State rank
- #61 of 178 in NC
Livability — Wilmington
- Score
- 70/100
- State rank
- #142
- US rank
- #8131
Category grades
Schools grade is shown separately in the Schools card above.
Census & demographics
- Census place
- Wilmington, NC
- County
- New Hanover County · 232,153 people
- City population
- 215,355
- Metro
- Wilmington, NC
- Population (ZIP)
- 35,467
- Household income
- $70,274
- Rent vs Own
- Severe rent burden
- 2089.0
Population outlook (New Hanover County) Hauer SSP2
- Today (2025)
- 259,517 people
- By 2030
- 279,586 · +7.7%
- By 2040
- 318,223 · +22.6%
- By 2050
- 354,831 · +36.7%
- By 2075
- 437,158 · +68.5%
- By 2100
- 486,769 · +87.6%
Race, ethnicity, and origin ACS 2023
- Neighborhood character
- Predominantly White (69%)
- Race & ethnicity
- White 69% Black 17% Hispanic / Latino 9% Two or more races 4% Asian 1%
- Hispanic origin (detail)
- Mexican 3% Puerto Rican 2%
- Common ancestry
- Slovak 3% Romanian 2% Italian 2%
- Foreign-born
- 8% · Canada, South Korea
- Languages at home
- 90% English-only · Spanish 7% Other Indo-European 2%
Political lean MEDSL · New Hanover
- 2024 margin
- Toss-up / Even · D 49.8% · R 49.1% · Other 1.1%
- 2008→2024 swing
- +2.0pp toward D · 2008: -1.4pp · 2024: 0.6pp
- All cycles
- 2024: D+0.6 2020: D+2.1 2016: R+4.1 2012: R+4.7 2008: R+1.4
Not yet ingested
- Civics
- —
Market trends
- HPI YoY
- ▼ -446.45%
- Current HPI
- 232.4987
- Rent YoY
- ▲ 3.90%
- Metro
- Wilmington, NC
- State GDP YoY
- ▲ 3.28%
- F500 in state
- 26
Industry mix (Fortune 500 HQ in NC)
| Industry | F500 HQs | Revenue |
|---|---|---|
| Financial Services | 2 | $213B |
|
||
| Retail | 2 | $95B |
|
||
| Industrial Conglomerate | 1 | $38B |
|
||
| Metals / Steel | 1 | $35B |
|
||
| Utilities | 1 | $30B |
|
||
| Industrial Machinery | 1 | $19B |
|
||
Price history
+492.6% since first listed3 events — show timeline
- 2026-05-24 Pending — Hive MLS
- 2026-05-23 Listed $160,000 Hive MLS
- 1977-03-01 Sold (Public Records) $27,000 Public Records
Property tax history
-1.1%/yrLatest (2025): $1,031 · -26.3% YoY. Source: county tax records.
Cash-flow waterfall
monthlySold comps — $/sqft
last 12 mo · ≤1 miLoading sold comps…