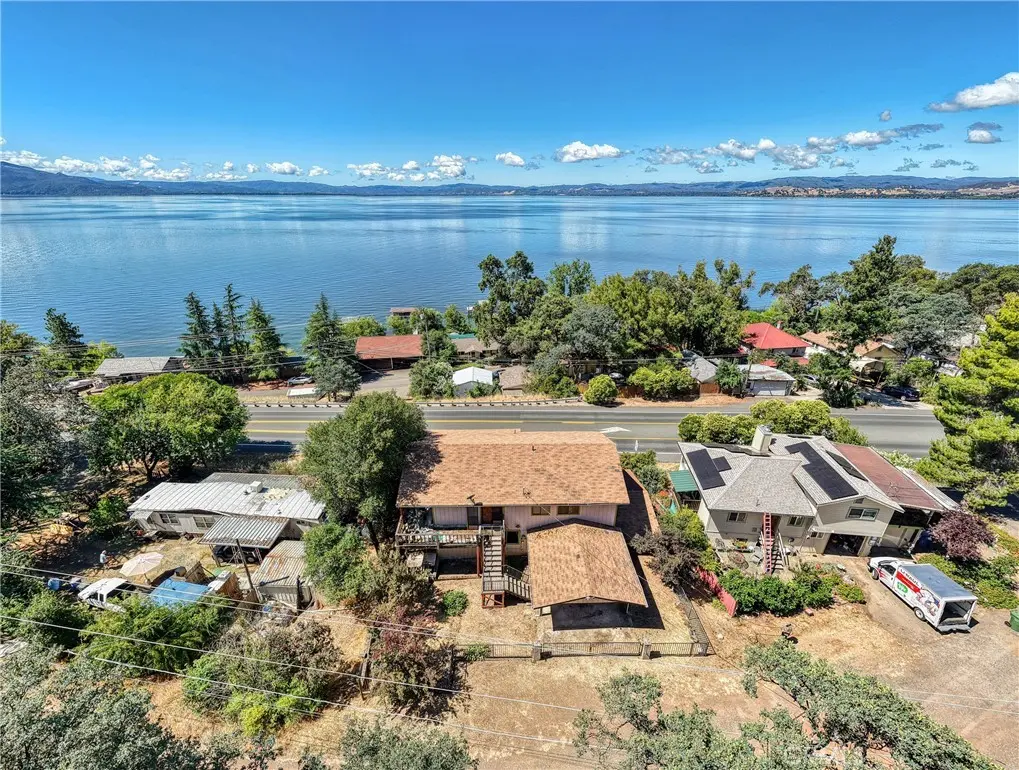
4150 E State Hwy 20 · Nice, CA
Flood risk 1/10 · Minimal
- FEMA flood zone
- X (unshaded)
- Chance of flooding over 30 yrs
- 0.0%
- Est. flood insurance / yr
- $507 – $1,088
Fire risk 9/10 · Severe
- Est. fire insurance / yr
- $659 – $1,223
Heat risk 6/10 · Moderate
- Hot days now (above 99°F)
- 9 days/yr
- Hot days in 30 yrs
- 19 days/yr
Wind risk 1/10 · Minimal
- Chance of severe wind over 30 yrs
- —
Air-quality risk 10/10 · Severe
- Unhealthy air days now
- 36 days/yr
- Unhealthy air days in 30 yrs
- 39 days/yr
Risk factors via First Street. Map © Google.
Why this score? — see what drove the B- grade
The composite is a weighted blend of 9 inputs, each scored 0–100. Each bar is that input's sub-score; the figure is the points it added to the 100-point composite (weight × sub-score).
- Cash flow +30.0/30.0
- DSCR +10.0/10.0
- 1% rule +7.9/10.0
- ARV discount +7.5/15.0
- Livability +3.0/5.0
- Rent growth +2.5/5.0
- Condition / age +2.5/5.0
- Schools +2.0/10.0
- Appreciation +0.0/10.0
$225,000
🖨 Deal sheet 📄 Offer letter ✓ Due diligence
Listing remarks
That view. Clear Lake stretching out in front of you, Mount Konocti on the horizon, and a price tag that makes serious investors stop scrolling. At $225,000, 4150 E Highway 20 is one of those rare Lake County opportunities where the numbers can really work if you bring the right vision and the right contractor. This three-level multi-unit property sits on a single parcel in Nice with lake views from multiple rooms, a massive covered carport, a fenced yard, and more square footage than most people expect at this price. The upper level features a large open living area with updated LVP flooring, mini split systems, a spacious kitchen with granite counters, stainless appliances, a built-in ref
Key facts
- Two unit property
- Fenced yard
- Updated flooring
Tags
Property features AI
Finance
- Other: Property contains 2 total units; No common walls between units
- HOA & community: Community features include watersports, hiking, fishing, mountainous terrain, lake access, and a rural setting
Exterior
- Parking: Attached garage; 2 garage spaces (2 parking spaces total)
- Utilities: Public sewer; Water connected (District/Public); Sewer connected
- Home design: Two stories; Entry level: 1; No accessory dwelling unit
- Construction: Year built reported by assessor
- Exterior features: House structure; No pool; Lot roughly 0–1 unit per acre
Interior
- Bedrooms: Bedrooms located on both upper and lower levels
- Flooring: Carpet; Wood; Laminated
- Bathrooms: One full bathroom; One half bathroom
- Heating & cooling: Ductless heating; Ductless cooling
- Interior features: Two-level interior; Entry at Burpee; Has a view; Main level contains 4 bedrooms and 2 bathrooms
- Laundry & utility: Laundry area in the garage
Neighborhood map
What this means for you Summary
Snapshot
- This is a 4-bed/1.5-bath single-family listed at $225k.
Deal economics
- At list price, monthly cash flow is $872 ($10k/yr) — positive.
- The deal already cash-flows at list — no discount required.
- Meets the 1% rule at list price ($3k rent vs $225k).
- Cap rate 10.9% vs local median 5.1% in Nice — top-decile yield for the area; either an underpriced asset or a hidden risk that comps aren't pricing in. Stress-test before assuming the spread holds.
Location & tenants
- Location reads 59/100 on livability (#652 in CA) — a working-class tenant base; expect higher turnover. Watch: health & safety C-, schools F, amenities F.
- Upper Lake Unified (rural): math 17% / reading 32% proficiency, ranked #433 of 517 in CA (top 84%) — low school quality limits family demand, transient renter base, plan for 1-2y turnover; 70% free/reduced lunch — lower-income household profile, screen leases tightly.
- Market conditions: 62 active listings in the ZIP; 1 comparable units currently listed for rent nearby; 107 units permitted in Lake County in 2024 (40 in 5+ unit buildings).
Forward outlook
- Local home prices are declining (-3.0%/yr); year-one equity from $2k of loan paydown is wiped out by about $7k of value loss. Plan a longer hold.
- Lake County population projected at -15% by 2050 — secular population decline; favor cash flow + early exit over multi-decade hold.
- At projected returns (-3.0% appreciation + 3.0% rent growth), your $63k cash investment doubles in ~8 years — after that, you're playing with house money.
Negotiation context
- Only 9 days on market — expect competitive offers; lowballing is unlikely to land.
- 10 sale attempts since 13y ago with the ask held roughly flat each time — persistent listings suggest the price (not the market) is what's stuck; bring a comps-based counter.
- Current owner paid $110k; list at $225k implies a 105% gain — meaningful room to come down on a strong offer.
Risks & watch-outs
- Climate carrying-cost: severe wildfire risk; extreme-heat days projected 9→19/yr by 2055 (HVAC capex compounding) — expect insurance premiums to compound above CPI over the hold.
Questions for the listing agent
- Is there a deadline driving the sale (1031 exchange, divorce, estate, relocation)? That informs how much negotiation room exists.
- Schools are F-rated, which usually means shorter tenancies and higher turnover. Who's the typical renter profile here, and what's been the actual vacancy rate?
- What's the average days-on-market for RENTAL listings here right now (not sales)? A rising rental-DOM trend means longer vacancies and softer asking-rent achievability than the comps imply.
- What's the recent tenant-quality profile in this submarket — average credit score on applications, eviction rate, late-payment / NSF rate, and stable-employment percentage? A property-management company in the area should have these aggregated.
- How much new for-sale + rental construction is in the pipeline within 1–3 miles? Heavy new supply typically softens prices + rents 12–24 months out; constrained supply supports both.
Investment metrics
- 1% rule
- 1.29% ✓
- Cap rate
- 10.95%
- Cash-on-cash
- 16.62%
- DSCR
- 1.74
- GRM
- 6.5
CMA / ARV
- ARV (on-the-fly)
- $803,264
- Comps found
- 2
Show comp detail 2 sales within ~0.75 mi
| Address | Dist | Beds/Ba | Sqft | Sold | Price | $/sf | Match |
|---|---|---|---|---|---|---|---|
| 4355 E Highway 20 | 0.20mi | 4/3.0 | 2,304 (-6%) | 20mo | $750,000 | $326 | 58 |
| 3753 Lakeview Dr | 0.59mi | 3/2.5 (-1) | 2,324 (-6%) | 11mo | $247,000 | $106 | 44 |
Match score weights: distance 35% · size 25% · config 20% · recency 20%. Top-matched comps best support the ARV.
Projected returns pro-forma
-3.0% appreciation · 3.0% rent growth · sell at horizon
- IRR
- 7.7%
- Equity multiple
- 1.30×
- Total profit
- $19,059
- Equity at exit
- $33,548
- IRR
- 17.0%
- Equity multiple
- 2.40×
- Total profit
- $87,974
- Equity at exit
- $19,454
Cash invested: $63,000 (down + closing). Projections, not guarantees.
Landlord ↔ Tenant lean methodology
- Overall (STATE)
- 18 Strongly Tenant-Friendly
- State California
- 18 Strongly Tenant-Friendly · D+13
- County
- — inherits STATE
- City
- — inherits STATE
ZIP-level market 95464
- Home prices YoY
- -20.2%
- Active inventory
- 62
- Price-to-rent
- 6.5×
Monthly cashflow live
- Estimated rent
- $2,900 medium interval (Pro) →
- Mortgage (P&I)
- −$1,180
- Tax from tax record
- −$145 /mo · $1,740/yr
- Insurance
- −$94
- HOA
- −$0
- Vacancy / Maint / Mgmt
- −$609
- Net cashflow
- $872
Break-even live
UW: 25.0% down · 7.5% · 30yr · 1.5% tax · 5.0% vac · 8.0% maint · 8.0% mgmt
Financing live
Cash to close
- Down payment
- $56,250
- Closing costs
- $6,750
- Reserves months
- —
- Total cash needed
- —
Loan-product check · same deal, 3 products live
Conventional
25% down · 7.5% · 30yr
- Down + closing
- —
- Monthly P&I
- —
- Monthly cashflow
- —
- DSCR
- —
- Eligible?
- —
Personal DTI + credit; lowest rate.
DSCR
20% down · 8.5% · 30yr
- Down + closing
- —
- Monthly P&I
- —
- Monthly cashflow
- —
- DSCR
- —
- Eligible?
- —
No personal income docs; deal must DSCR.
Hard money
10% down · 12.0% · 12mo
- Down + closing
- —
- Monthly P&I
- —
- Monthly cashflow
- —
- DSCR
- —
- Eligible?
- —
Short-term bridge; refi at stabilization.
Rent comps 1 comps
| Address | Beds | Baths | Sqft | Rent | $/sqft | DOM | Units | Dist |
|---|---|---|---|---|---|---|---|---|
| 3201 Springe St Unit 3 Nice, CA | 5.0 | 3.0 | 2950 | $2,900 | $0.98 | 43d | 1 | 1.00mi |
Listing history 8 events
-
2026-06-19days on market $225,000 Active 9 DOM
-
2026-06-18days on market $225,000 Active 8 DOM
-
2026-06-17days on market $225,000 Active 7 DOM
-
2026-06-16days on market $225,000 Active 6 DOM
-
2026-06-15days on market $225,000 Active 5 DOM
-
2026-06-14days on market $225,000 Active 3 DOM
-
2026-06-12remarks 699-char remark
-
2026-06-12$225,000 Active 2 DOM
ⓘ Source: listings_history table (triggers on properties + properties_extension) + one-shot
backfill from property_details.listing_events for pre-trigger history.
Tax reassessment forecast CA · Resets to sale price
- Current annual tax
- $1,740 · $145/mo
- Projected year-2 tax
- $1,740 · $145/mo
- Expected delta
- $0/yr ($0/mo · 0.0%)
ⓘ Screening estimate from a state-policy table — verify with the county assessor before closing.
Climate risk First Street
- Flood 1/10 Low FEMA zone X (unshaded) · 0% chance over 30 yrs
- Wildfire 9/10 Extreme
- Heat 6/10 Major 9 d/yr ≥99°F today · 19 d/yr by 30 yrs out
- Wind 1/10 Low
- Air quality 10/10 Extreme 36 unhealthy d/yr today · 39 by 30 yrs out
Nearby sold comps map
Loading sold comps map…
Walkable amenities ~0.75 mi
Loading nearby amenities…
Taxation est. · year 1
- Rental income
- $34,800
- − Mortgage interest
- −$12,603
- − Property taxes
- −$1,740
- − Insurance
- −$1,125
- − Repairs & maintenance
- −$2,784
- − Management
- −$2,784
- − Depreciation
- −$6,545
- Taxable income
- $7,218
- Est. tax owed @ 24.0%
- −$1,732
- After-tax cash flow
- $8,736/yr
For passive investors: Depreciation is non-cash, so a rental often shows a tax loss while cash-flowing — sheltering income. Rental losses are passive: they offset passive income freely, and up to $25,000/yr can offset ordinary (W-2) income if you actively participate and your MAGI is under $100k (phasing out to $0 by $150k); unused losses carry forward. On sale, claimed depreciation is recaptured at up to 25%, and gains may owe capital-gains tax (a 1031 exchange can defer both). Figures are a year-1 estimate at your 24.0% rate — not tax advice; consult a CPA.
Schools (NCES district)
- District
- Upper Lake Unified
- NCES district ID
- 0601442
- Math proficiency
- 17% ▼ -3.00%
- Reading proficiency
- 32% ▲ 1.00%
- Median HH income
- $35,872
- Composite
- 20.24/100
- National rank
- #8624
- State rank
- #433 of 517 in CA
Livability — Nice
- Score
- 59/100
- State rank
- #652
- US rank
- #20328
Category grades
Schools grade is shown separately in the Schools card above.
Census & demographics
- Census place
- Nice, CA
- City population
- 2,417
- Population (ZIP)
- 2,417
Population outlook (Lake County) Hauer SSP2
- Today (2025)
- 62,396 people
- By 2030
- 60,626 · -2.8%
- By 2040
- 56,453 · -9.5%
- By 2050
- 53,054 · -15.0%
- By 2075
- 47,663 · -23.6%
- By 2100
- 41,804 · -33.0%
Race, ethnicity, and origin ACS 2023
- Neighborhood character
- Diverse neighborhood (Simpson 0.61)
- Race & ethnicity
- White 55% Hispanic / Latino 29% Native American 17% Asian 3%
- Hispanic origin (detail)
- Mexican 28%
- Common ancestry
- Lithuanian 2% Scotch-Irish 1% Italian 1%
- Foreign-born
- 9% · Canada
- Languages at home
- 78% English-only · Spanish 20%
Political lean MEDSL · Lake
- 2024 margin
- Toss-up / Even · D 47.8% · R 49.2% · Other 3.0%
- 2008→2024 swing
- -20.6pp toward R · 2008: 19.3pp · 2024: -1.4pp
- All cycles
- 2024: R+1.4 2020: D+6.3 2016: D+3.7 2012: D+16.5 2008: D+19.3
Not yet ingested
- Civics
- —
Market trends
- HPI YoY
- ▼ -44.76%
- Current HPI
- 177.0701
- Rent YoY
- —
- Metro
- —
- State GDP YoY
- ▲ 3.21%
- F500 in state
- 116
Industry mix (Fortune 500 HQ in CA)
| Industry | F500 HQs | Revenue |
|---|---|---|
| Technology | 27 | $1,492B |
|
||
| Financial Services | 3 | $174B |
|
||
| Retail | 3 | $44B |
|
||
| Insurance | 3 | $26B |
|
||
| Media / Entertainment | 2 | $115B |
|
||
| Pharmaceuticals / Biotech | 2 | $62B |
|
||
Price history
+32.4% since first listed25 events — show timeline
- 2026-06-11 Listed $225,000 CRMLS
- 2026-06-10 Coming Soon $225,000 CRMLS
- 2026-04-24 Listing Removed — CRMLS
- 2026-03-25 Price Changed $274,900 CRMLS
- 2026-03-24 Price Changed $274,900 BAREIS
- 2026-01-05 Listed $284,500 BAREIS
- 2026-01-05 Listed $284,500 CRMLS
- 2025-12-16 Listing Removed — CRMLS
- 2025-11-10 Listed $285,500 BAREIS
- 2025-10-18 Listed $285,500 CRMLS
- 2014-12-01 Sold (MLS) $110,000 CRMLS
- 2014-11-14 Contingent — CRMLS
- 2014-10-24 Price Changed $120,000 CRMLS
- 2014-09-02 Relisted — CRMLS
- 2014-08-24 Pending — CRMLS
- 2014-06-05 Relisted — CRMLS
- 2014-06-05 Price Changed $139,900 CRMLS
- 2014-06-05 Listing Removed — CRMLS
- 2014-04-29 Relisted — CRMLS
- 2014-04-28 Delisted — CRMLS
- 2014-03-19 Price Changed $149,900 CRMLS
- 2014-01-23 Relisted — CRMLS
- 2014-01-22 Delisted — CRMLS
- 2013-10-14 Price Changed $159,999 CRMLS
- 2013-09-04 Listed $170,000 CRMLS
Property tax history
+0.4%/yrLatest (2025): $1,740 · +13.6% YoY. Source: county tax records.
Cash-flow waterfall
monthlySold comps — $/sqft
last 12 mo · ≤1 miLoading sold comps…