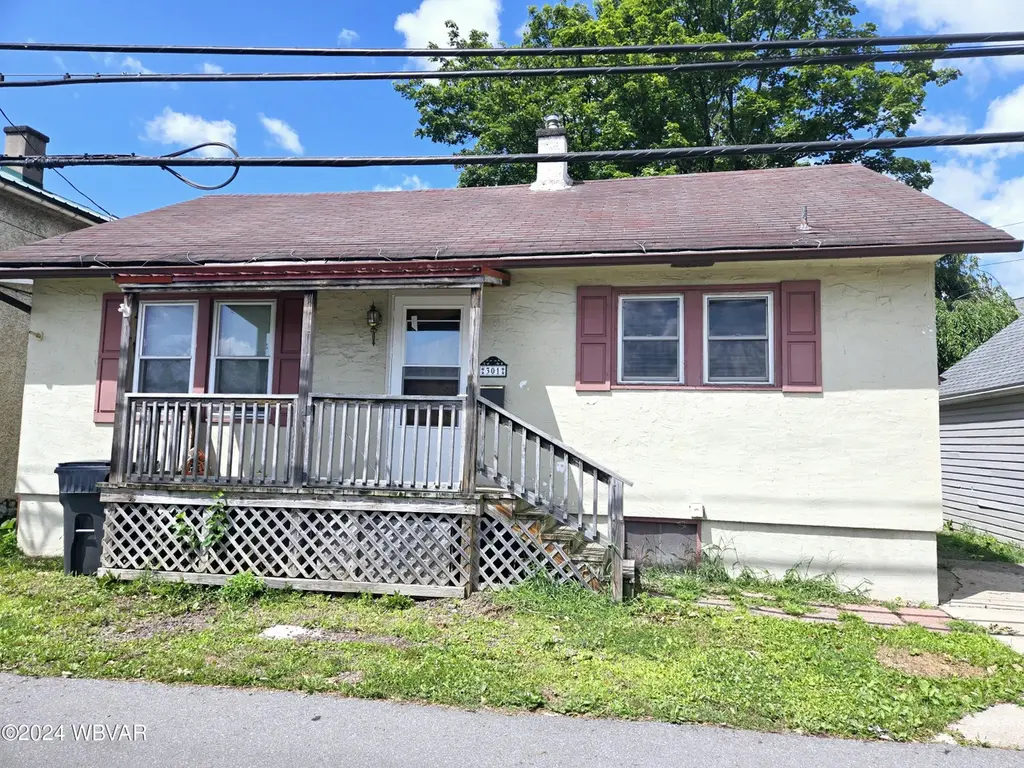
301 Catherine St · Williamsport, PA
Flood risk 4/10 · Minor
- FEMA flood zone
- X
- Chance of flooding over 30 yrs
- 0.24%
- Est. flood insurance / yr
- $473 – $860
Fire risk 1/10 · Minimal
- Est. fire insurance / yr
- $511 – $949
Heat risk 4/10 · Minor
- Hot days now (above 97°F)
- 7 days/yr
- Hot days in 30 yrs
- 16 days/yr
Wind risk 2/10 · Minimal
- Chance of severe wind over 30 yrs
- 1.0%
Air-quality risk 2/10 · Minimal
- Unhealthy air days now
- 0 days/yr
- Unhealthy air days in 30 yrs
- 1 days/yr
Risk factors via First Street. Map © Google.
Why this score? — see what drove the D grade
The composite is a weighted blend of 9 inputs, each scored 0–100. Each bar is that input's sub-score; the figure is the points it added to the 100-point composite (weight × sub-score).
- Cash flow +12.2/30.0
- ARV discount +7.5/15.0
- Livability +3.7/5.0
- DSCR +3.6/10.0
- Rent growth +3.6/5.0
- 1% rule +3.5/10.0
- Schools +3.5/10.0
- Condition / age +2.5/5.0
- Appreciation +0.0/10.0
$135,000
🖨 Deal sheet 📄 Offer letter ✓ Due diligence
Listing remarks MLS
East End Cape Cod is cute as a button and perfect for your next home. Convenient location in the Faxon area, close to bus route and grocery store. Updated kitchen and original hardwood floors throughout. 2 first floor bedrooms and 1.5 baths. 2nd floor 3rd bedroom and storage area. Private covered rear deck and fenced in backyard. Off Street Parking. So much charm, you will want it for yourself! Call Deb Williams at 570-916-1643 for your showing today!
Key facts
- Deck out back
- Fenced in yard
- 2,614 sq ft lot
Tags
Property features AI
Exterior
- Parking: Off-street parking with alley access
- Utilities: Public water
- Home design: Residential property
- Construction: Concrete, block and stone veneer construction; Block foundation; Shingle roof; Built above grade finished area of 960
- Exterior features: Covered patio/porch; Level lot; Has a view
Interior
- Kitchen: Range; Refrigerator
- Bedrooms: Total rooms: 4
- Flooring: Wood; Laminate; Vinyl
- Bathrooms: 1 full bathroom; 1 half bathroom
- Heating & cooling: Oil heating; Ceiling fan(s); No central air
- Interior features: Eat-in kitchen; Ceiling fan(s); Pantry
- Laundry & utility: Washer; Dryer
Neighborhood map
What this means for you Summary
Snapshot
- This is a 3-bed/1.0-bath single-family listed at $135k.
Deal economics
- At list price, monthly cash flow is $-27 ($-318/yr) — negative.
- To cash-flow at today's rent, offer at most $130k (3.5% below list).
- To meet the 1% rule (rent ≥ 1% of price), the offer needs to be $115k (14.5% below list).
- Recommended offer: $115k (14.5% below list) — sets the bar for 1% rule.
Location & tenants
- Location reads 74/100 on livability (#523 in PA, #4,841 nationally) — a middle-class / working-renter tenant base. Strengths: cost of living A+, housing A+, health & safety A+; Watch: crime C-, employment D, amenities F.
- Williamsport Area SD (urban): math 38% / reading 45% proficiency, ranked #349 of 539 in PA (top 65%) — families likely to look elsewhere, expect single-tenant / working-renter base with shorter leases.
- Market conditions: Rents rising fast (+4.4%/yr); 188 active listings in the ZIP; 4 comparable units currently listed for rent nearby; rentals lingering (median 44d on market — plan ~5-8 weeks vacancy on turnover, expect pricing pressure); 75% of comp listings sitting > 30 days — soft ceiling on asking rent; 73 units permitted in Lycoming County in 2024 (15 in 5+ unit buildings).
Forward outlook
- Local home prices are declining (-3.0%/yr); year-one equity from $933 of loan paydown is wiped out by about $4k of value loss. Plan a longer hold.
- Lycoming County population projected to shrink 10% by 2050 — rents likely to lag national; underwrite the cash flow, not the appreciation.
Negotiation context
- Only 7 days on market — expect competitive offers; lowballing is unlikely to land.
- 4 sale attempts since 12y ago with the ask held roughly flat each time — persistent listings suggest the price (not the market) is what's stuck; bring a comps-based counter.
Risks & watch-outs
- Watch-outs: built in 1950 — expect roof / HVAC / electrical / plumbing capex.
Questions for the listing agent
- What do current leases actually rent for vs. the listed asking? Can we see a recent rent roll and the last 12 months of T-12 income?
- Built in 1950 — when were the roof, HVAC, electrical panel, plumbing, and water heater last replaced?
- Is there a deadline driving the sale (1031 exchange, divorce, estate, relocation)? That informs how much negotiation room exists.
- The area grade is low — what's the realistic commute time and amenity access for the typical tenant pool here? Any planned neighborhood developments (good or bad) we should know about?
- What's the average days-on-market for RENTAL listings here right now (not sales)? A rising rental-DOM trend means longer vacancies and softer asking-rent achievability than the comps imply.
- What's the recent tenant-quality profile in this submarket — average credit score on applications, eviction rate, late-payment / NSF rate, and stable-employment percentage? A property-management company in the area should have these aggregated.
- How much new for-sale + rental construction is in the pipeline within 1–3 miles? Heavy new supply typically softens prices + rents 12–24 months out; constrained supply supports both.
Investment metrics
- 1% rule
- 0.85% ✗
- Cap rate
- 6.06%
- Cash-on-cash
- -0.84%
- DSCR
- 0.96
- GRM
- 9.8
CMA / ARV
No comps found within radius.
Projected returns pro-forma
-3.0% appreciation · 4.43% rent growth · sell at horizon
- IRR
- -16.1%
- Equity multiple
- 0.42×
- Total profit
- $-21,860
- Equity at exit
- $20,129
- IRR
- -5.4%
- Equity multiple
- 0.63×
- Total profit
- $-14,013
- Equity at exit
- $11,672
Cash invested: $37,800 (down + closing). Projections, not guarantees.
Landlord ↔ Tenant lean methodology
- Overall (STATE)
- 62 Landlord-Friendly
- State Pennsylvania
- 62 Landlord-Friendly · EVEN
- County
- — inherits STATE
- City
- — inherits STATE
ZIP-level market 17701
- Rents YoY
- 4.4%
- Active inventory
- 188
- Price-to-rent
- 9.8×
Monthly cashflow live
- Estimated rent
- $1,154 medium interval (Pro) →
- Mortgage (P&I)
- −$708
- Tax from tax record
- −$174 /mo · $2,086/yr
- Insurance
- −$56
- HOA
- −$0
- Vacancy / Maint / Mgmt
- −$242
- Net cashflow
- $-27
Break-even live
UW: 25.0% down · 7.5% · 30yr · 1.5% tax · 5.0% vac · 8.0% maint · 8.0% mgmt
Financing live
Cash to close
- Down payment
- $33,750
- Closing costs
- $4,050
- Reserves months
- —
- Total cash needed
- —
Loan-product check · same deal, 3 products live
Conventional
25% down · 7.5% · 30yr
- Down + closing
- —
- Monthly P&I
- —
- Monthly cashflow
- —
- DSCR
- —
- Eligible?
- —
Personal DTI + credit; lowest rate.
DSCR
20% down · 8.5% · 30yr
- Down + closing
- —
- Monthly P&I
- —
- Monthly cashflow
- —
- DSCR
- —
- Eligible?
- —
No personal income docs; deal must DSCR.
Hard money
10% down · 12.0% · 12mo
- Down + closing
- —
- Monthly P&I
- —
- Monthly cashflow
- —
- DSCR
- —
- Eligible?
- —
Short-term bridge; refi at stabilization.
Rent comps 4 comps
| Address | Beds | Baths | Sqft | Rent | $/sqft | DOM | Units | Dist |
|---|---|---|---|---|---|---|---|---|
| 1539 Northway Rd Unit NW455 Williamsport, PA | 2.0 | 1.0 | 700 | $850 | $1.21 | 43d | 1 | 0.89mi |
| 475 E 5th Ave Unit 6 South Williamsport, PA | 2.0 | 1.0 | 900 | $1,180 | $1.31 | 43d | 1 | 0.97mi |
| 480 E 5th Ave Unit 4 South Williamsport, PA | 2.0 | 1.0 | 900 | $1,200 | $1.33 | 43d | 1 | 0.99mi |
| 300 Valley Heights Dr Williamsport, PA | 1.0–3.0 | 1.0–2.0 | 1195 | $3,476 | $2.91 | 14d | 1 | 1.16mi |
Listing history 12 events
-
2026-05-22$135,000 Active
-
2024-08-19price $128,000
-
2024-08-05price $135,000
-
2024-07-19$139,000 Active
-
2022-12-23soldstatus $134,500
-
2021-03-12soldstatus $86,000
-
2021-03-05soldstatus 455-char remark
Show marketing remark (455 chars)
East End Cape Cod is cute as a button and perfect for your next home. Convenient location in the Faxon area, close to bus route and grocery store. Updated kitchen and original hardwood floors throughout. 2 first floor bedrooms and 1.5 baths. 2nd floor 3rd bedroom and storage area. Private covered rear deck and fenced in backyard. Off Street Parking. So much charm, you will want it for yourself! Call Deb Williams at 570-916-1643 for your showing today!
-
2021-01-13$86,500 455-char remark
Show marketing remark (455 chars)
East End Cape Cod is cute as a button and perfect for your next home. Convenient location in the Faxon area, close to bus route and grocery store. Updated kitchen and original hardwood floors throughout. 2 first floor bedrooms and 1.5 baths. 2nd floor 3rd bedroom and storage area. Private covered rear deck and fenced in backyard. Off Street Parking. So much charm, you will want it for yourself! Call Deb Williams at 570-916-1643 for your showing today!
-
2014-10-17soldstatus
-
2014-10-17soldstatus $86,000
-
2014-08-01$93,900
-
2004-07-07soldstatus $52,900
ⓘ Source: listings_history table (triggers on properties + properties_extension) + one-shot
backfill from property_details.listing_events for pre-trigger history.
Tax reassessment forecast PA · Partial reset (capped growth)
- Current annual tax
- $2,086 · $174/mo
- Projected year-2 tax
- $2,109 · $176/mo
- Expected delta
- +$24/yr (+$2/mo · 1.1%)
ⓘ Screening estimate from a state-policy table — verify with the county assessor before closing.
Climate risk First Street
- Flood 4/10 Moderate FEMA zone X · 24% chance over 30 yrs
- Wildfire 1/10 Low
- Heat 4/10 Moderate 7 d/yr ≥97°F today · 16 d/yr by 30 yrs out
- Wind 2/10 Low 100% chance of damaging wind over 30 yrs
- Air quality 2/10 Low 0 unhealthy d/yr today · 1 by 30 yrs out
Nearby sold comps map
Loading sold comps map…
Walkable amenities ~0.75 mi
Loading nearby amenities…
Taxation est. · year 1
- Rental income
- $13,846
- − Mortgage interest
- −$7,562
- − Property taxes
- −$2,086
- − Insurance
- −$675
- − Repairs & maintenance
- −$1,108
- − Management
- −$1,108
- − Depreciation
- −$3,927
- Taxable loss
- −$2,620
- Est. tax savings @ 24.0%
- +$629
- After-tax cash flow
- $311/yr
For passive investors: Depreciation is non-cash, so a rental often shows a tax loss while cash-flowing — sheltering income. Rental losses are passive: they offset passive income freely, and up to $25,000/yr can offset ordinary (W-2) income if you actively participate and your MAGI is under $100k (phasing out to $0 by $150k); unused losses carry forward. On sale, claimed depreciation is recaptured at up to 25%, and gains may owe capital-gains tax (a 1031 exchange can defer both). Figures are a year-1 estimate at your 24.0% rate — not tax advice; consult a CPA.
Schools (NCES district)
- District
- Williamsport Area SD
- NCES district ID
- 4226460
- Math proficiency
- 38% ▼ -9.00%
- Reading proficiency
- 45% ▼ -12.00%
- Median HH income
- $38,637
- Composite
- 34.63/100
- National rank
- #5150
- State rank
- #349 of 539 in PA
Livability — Williamsport
- Score
- 74/100
- State rank
- #523
- US rank
- #4841
Category grades
Schools grade is shown separately in the Schools card above.
Census & demographics
- Census place
- Williamsport, PA
- County
- Lycoming County · 43,104 people
- City population
- 43,104
- Metro
- Williamsport, PA
- Population (ZIP)
- 43,104
- Household income
- $53,237
- Rent vs Own
- Severe rent burden
- 2178.0
Population outlook (Lycoming County) Hauer SSP2
- Today (2025)
- 114,164 people
- By 2030
- 112,221 · -1.7%
- By 2040
- 107,613 · -5.7%
- By 2050
- 102,950 · -9.8%
- By 2075
- 92,987 · -18.5%
- By 2100
- 80,924 · -29.1%
Race, ethnicity, and origin ACS 2023
- Neighborhood character
- Predominantly White (80%)
- Race & ethnicity
- White 80% Black 10% Two or more races 7% Hispanic / Latino 3% Asian 1%
- Common ancestry
- Romanian 3% Lithuanian 2% Slovak 2%
- Foreign-born
- 2% · Canada
- Languages at home
- 96% English-only · Spanish 1% French/Haitian/Cajun 1% German/W. Germanic 1%
Political lean MEDSL · Lycoming
- 2024 margin
- Solid R (+41.5) · D 28.8% · R 70.3%
- 2008→2024 swing
- -17.3pp toward R · 2008: -24.2pp · 2024: -41.5pp
- All cycles
- 2024: R+41.5 2020: R+41.3 2016: R+44.8 2012: R+33.3 2008: R+24.2
Not yet ingested
- Civics
- —
Market trends
- HPI YoY
- ▼ -142.61%
- Current HPI
- 216.7203
- Rent YoY
- ▲ 4.43%
- Metro
- Williamsport, PA
- State GDP YoY
- ▲ 1.68%
- F500 in state
- 34
Industry mix (Fortune 500 HQ in PA)
| Industry | F500 HQs | Revenue |
|---|---|---|
| Healthcare | 2 | $309B |
|
||
| Insurance | 2 | $27B |
|
||
| Telecommunications / Media | 1 | $124B |
|
||
| Industrial Distribution | 1 | $22B |
|
||
| Financial Services | 1 | $20B |
|
||
| Chemicals / Materials | 1 | $18B |
|
||
Price history
+155.2% since first listed12 events — show timeline
- 2026-05-22 Listed $135,000 WBVAR
- 2024-08-19 Price Changed $128,000 WBVAR
- 2024-08-05 Price Changed $135,000 WBVAR
- 2024-07-19 Listed $139,000 WBVAR
- 2022-12-23 Sold (Public Records) $134,500 Public Records
- 2021-03-12 Sold (Public Records) $86,000 Public Records
- 2021-03-05 Sold (MLS) — WBVAR
- 2021-01-13 Listed $86,500 WBVAR
- 2014-10-17 Sold (Public Records) $86,000 Public Records
- 2014-10-17 Sold (MLS) — WBVAR
- 2014-08-01 Listed $93,900 WBVAR
- 2004-07-07 Sold (Public Records) $52,900 Public Records
Property tax history
+2.0%/yrLatest (2026): $2,086 · +2.5% YoY. Source: county tax records.
Cash-flow waterfall
monthlySold comps — $/sqft
last 12 mo · ≤1 miLoading sold comps…