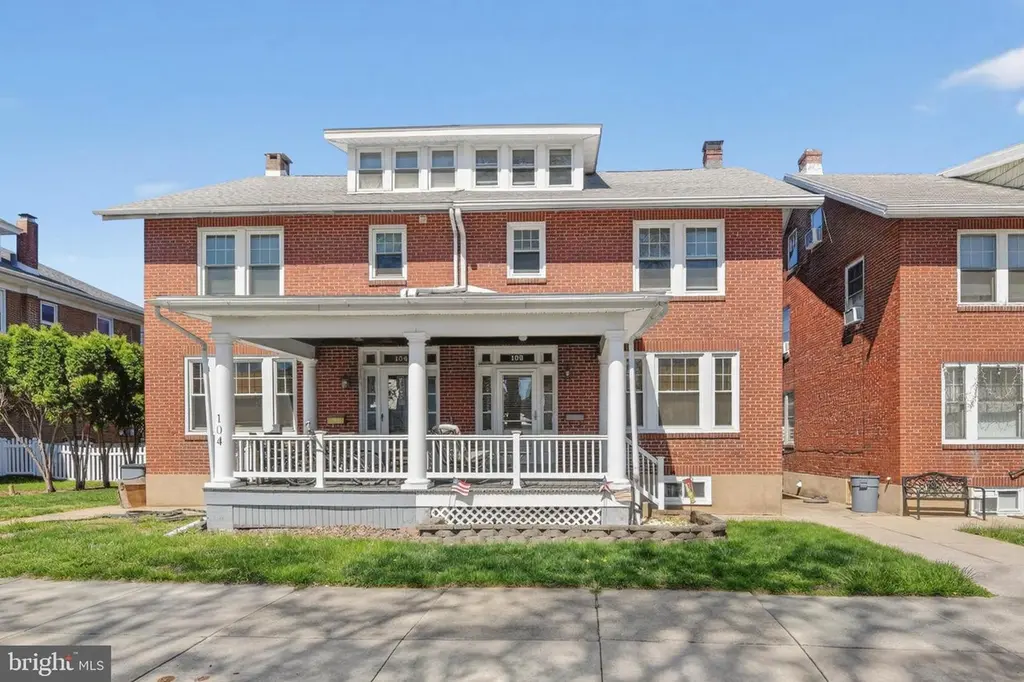
106 N Miller St · Shillington, PA
Flood risk 1/10 · Minimal
- FEMA flood zone
- X (unshaded)
- Chance of flooding over 30 yrs
- 0.0%
- Est. flood insurance / yr
- $473 – $860
Fire risk 1/10 · Minimal
- Est. fire insurance / yr
- $511 – $949
Heat risk 6/10 · Moderate
- Hot days now (above 100°F)
- 7 days/yr
- Hot days in 30 yrs
- 16 days/yr
Wind risk 4/10 · Minor
- Chance of severe wind over 30 yrs
- 16.0%
Air-quality risk 3/10 · Minor
- Unhealthy air days now
- 2 days/yr
- Unhealthy air days in 30 yrs
- 3 days/yr
Risk factors via First Street. Map © Google.
Why this score? — see what drove the D- grade
The composite is a weighted blend of 9 inputs, each scored 0–100. Each bar is that input's sub-score; the figure is the points it added to the 100-point composite (weight × sub-score).
- Cash flow +9.7/30.0
- ARV discount +7.7/15.0
- Livability +4.0/5.0
- Schools +3.6/10.0
- 1% rule +3.0/10.0
- DSCR +2.7/10.0
- Rent growth +2.5/5.0
- Condition / age +2.5/5.0
- Appreciation +0.0/10.0
$234,900
🖨 Deal sheet (PDF) 📄 Offer letter ✓ Due diligence
Listing remarks
Charming and well-maintained all-brick semi-detached home located in the desirable Governor Mifflin School District. This spacious property offers 4 bedrooms and 1 full bath, including a generously sized primary bedroom on the third floor featuring a walk-in closet. The home combines classic character with thoughtful updates, including newer windows and roof for added peace of mind. Enjoy relaxing on the updated synthetic wood front porch or entertaining on the spacious rear deck. Additional highlights include off-street parking for convenience and a highly accessible location close to schools, shopping, and everyday amenities.
Key facts
- 3 parking spots
- Built 1925
- Listed 4 days
Neighborhood map
What this means for you Summary
Snapshot
- This is a 3-bed/1.0-bath townhouse listed at $235k.
Deal economics
- At list price, monthly cash flow is $-155 ($-2k/yr) — negative.
- To cash-flow at today's rent, offer at most $208k (11.6% below list).
- To meet the 1% rule (rent ≥ 1% of price), the offer needs to be $189k (19.7% below list).
- Recommended offer: $189k (19.7% below list) — sets the bar for 1% rule.
Location & tenants
- Location reads 79/100 on livability (#230 in PA, #2,007 nationally) — a middle-class / working-renter tenant base. Strengths: crime A+, cost of living A+, housing A+; Watch: amenities F, commute F.
- Governor Mifflin SD (suburban): math 31% / reading 50% proficiency, ranked #325 of 539 in PA (top 60%) — families likely to look elsewhere, expect single-tenant / working-renter base with shorter leases.
- Zoned schools: Cumru El Sch (math 42% / reading 47%, grade F, #815 of 1,518 statewide, top 56%, 406 students, 56% FRL); Governor Mifflin Ms (math 18% / reading 51%, grade F, #328 of 512 statewide, top 65%, 629 students, 54% FRL); Governor Mifflin Shs (math 50% / reading 24%, grade F, #288 of 437 statewide, top 66%, 1,480 students, 44% FRL) — zoned schools average 51% FRL vs 27% district-wide (24 pts higher); higher-poverty schools than district average — tighter screening recommended.
- Market conditions: 90 active listings in the ZIP; 7 comparable units currently listed for rent nearby; rentals lingering (median 46d on market — plan ~5-8 weeks vacancy on turnover, expect pricing pressure); 57% of comp listings sitting > 30 days — soft ceiling on asking rent; solid renter incomes; 258 units permitted in Berks County in 2024 (27 in 5+ unit buildings).
Forward outlook
- Local home prices are declining (-3.0%/yr); year-one equity from $2k of loan paydown is wiped out by about $7k of value loss. Plan a longer hold.
- Berks County population projected at +3% by 2050 — modest demand growth; plan on rents tracking national, not racing it.
Negotiation context
- Only 4 days on market — expect competitive offers; lowballing is unlikely to land.
- Current owner paid $80k; list at $235k implies a 194% gain — meaningful room to come down on a strong offer.
Risks & watch-outs
- Watch-outs: built in 1925 — expect roof / HVAC / electrical / plumbing capex.
- Climate carrying-cost: extreme-heat days projected 7→16/yr by 2055 (HVAC capex compounding) — expect insurance premiums to compound above CPI over the hold.
Questions for the listing agent
- What do current leases actually rent for vs. the listed asking? Can we see a recent rent roll and the last 12 months of T-12 income?
- Built in 1925 — when were the roof, HVAC, electrical panel, plumbing, and water heater last replaced?
- Is there a deadline driving the sale (1031 exchange, divorce, estate, relocation)? That informs how much negotiation room exists.
- Schools are B-rated — typically a magnet for longer-tenancy family renters. What's the average tenant stay here, and is there a school-zone premium baked into asking?
- The area grade is low — what's the realistic commute time and amenity access for the typical tenant pool here? Any planned neighborhood developments (good or bad) we should know about?
- What's the average days-on-market for RENTAL listings here right now (not sales)? A rising rental-DOM trend means longer vacancies and softer asking-rent achievability than the comps imply.
- What's the recent tenant-quality profile in this submarket — average credit score on applications, eviction rate, late-payment / NSF rate, and stable-employment percentage? A property-management company in the area should have these aggregated.
- How much new for-sale + rental construction is in the pipeline within 1–3 miles? Heavy new supply typically softens prices + rents 12–24 months out; constrained supply supports both.
Investment metrics
- 1% rule
- 0.80% ✗
- Cap rate
- 5.50%
- Cash-on-cash
- -2.82%
- DSCR
- 0.87
- GRM
- 10.4
CMA / ARV
- ARV (on-the-fly)
- $235,972
- Comps found
- 12
Show comp detail 12 sales within ~0.75 mi
| Address | Dist | Beds/Ba | Sqft | Sold | Price | $/sf | Match |
|---|---|---|---|---|---|---|---|
| 106 N Miller St | 0.00mi | 4/1.0 (+1) | 1,364 (0%) | 1mo | $240,000 | $176 | 94 |
| 144 W Elm St | 0.06mi | 3/1.0 | 1,344 (-2%) | 1mo | $252,000 | $188 | 94 |
| 226 N Miller St | 0.10mi | 3/1.5 | 1,392 (+2%) | 1mo | $269,900 | $194 | 89 |
| 27 Pennsylvania Ave | 0.17mi | 3/1.0 | 1,400 (+3%) | 6mo | $259,900 | $186 | 83 |
| 137 E Elm St | 0.18mi | 3/1.5 | 1,444 (+6%) | 4mo | $249,900 | $173 | 76 |
| 108 S Sterley St | 0.27mi | 4/2.5 (+1) | 1,367 (+0%) | 2mo | $217,000 | $159 | 75 |
| 206 Hendel St | 0.41mi | 3/1.0 | 1,288 (-6%) | 0mo | $222,000 | $172 | 71 |
| 320 S Sterley St | 0.46mi | 3/1.0 | 1,280 (-6%) | 7mo | $245,000 | $191 | 62 |
| 311 Mifflin Blvd | 0.58mi | 2/1.0 (-1) | 1,242 (-9%) | 1mo | $184,900 | $149 | 52 |
| 10 Chesterwood Cir | 0.70mi | 3/1.5 | 1,536 (+13%) | 3mo | $259,900 | $169 | 42 |
| 106 Gretchen Dr | 0.55mi | 2/1.0 (-1) | 1,176 (-14%) | 7mo | $176,500 | $150 | 41 |
| 118 Gretchen Dr | 0.61mi | 2/1.5 (-1) | 1,176 (-14%) | 4mo | $165,000 | $140 | 38 |
Match score weights: distance 35% · size 25% · config 20% · recency 20%. Top-matched comps best support the ARV.
Projected returns pro-forma
-3.0% appreciation · 3.0% rent growth · sell at horizon
- IRR
- -21.0%
- Equity multiple
- 0.27×
- Total profit
- $-47,872
- Equity at exit
- $35,024
- IRR
- -14.3%
- Equity multiple
- 0.18×
- Total profit
- $-54,200
- Equity at exit
- $20,310
Cash invested: $65,772 (down + closing). Projections, not guarantees.
Landlord ↔ Tenant lean methodology
- Overall (STATE)
- 62 Landlord-Friendly
- State Pennsylvania
- 62 Landlord-Friendly · EVEN
- County
- — inherits STATE
- City
- — inherits STATE
ZIP-level market 19607
- Home prices YoY
- -14.1%
- Active inventory
- 90
- Price-to-rent
- 10.4×
Monthly cashflow live
- Estimated rent
- $1,885 high interval (Pro) →
- Mortgage (P&I)
- −$1,232
- Tax from tax record
- −$314 /mo · $3,773/yr
- Insurance
- −$98
- HOA
- −$0
- Vacancy / Maint / Mgmt
- −$396
- Net cashflow
- $-155
Break-even live
Sensitivity live
| Price | -10% $-22 | -5% $-88 | +0% $-155 | +5% $-221 | +10% $-288 |
|---|---|---|---|---|---|
| Rent | -10% $-304 | -5% $-229 | +0% $-155 | +5% $-80 | +10% $-6 |
| Rate | -1.0pp $-36 | -0.5pp $-95 | base $-155 | +0.5pp $-216 | +1.0pp $-277 |
UW: 25.0% down · 7.5% · 30yr · 1.5% tax · 5.0% vac · 8.0% maint · 8.0% mgmt
Financing live
Cash to close
- Down payment
- $58,725
- Closing costs
- $7,047
- Reserves months
- —
- Total cash needed
- —
Loan-product check · same deal, 3 products live
Conventional
25% down · 7.5% · 30yr
- Down + closing
- —
- Monthly P&I
- —
- Monthly cashflow
- —
- DSCR
- —
- Eligible?
- —
Personal DTI + credit; lowest rate.
DSCR
20% down · 8.5% · 30yr
- Down + closing
- —
- Monthly P&I
- —
- Monthly cashflow
- —
- DSCR
- —
- Eligible?
- —
No personal income docs; deal must DSCR.
Hard money
10% down · 12.0% · 12mo
- Down + closing
- —
- Monthly P&I
- —
- Monthly cashflow
- —
- DSCR
- —
- Eligible?
- —
Short-term bridge; refi at stabilization.
Rent comps 7 comps
| Address | Beds | Baths | Sqft | Rent | $/sqft | DOM | Units | Dist |
|---|---|---|---|---|---|---|---|---|
| 101 Washington St Shillington, PA | 2.0 | 1.0 | 1008 | $1,775 | $1.76 | 45d | 1 | 0.20mi |
| 330 N Wyomissing Ave Reading, PA | 2.0 | 1.0 | 903 | $1,950 | $2.16 | 45d | 1 | 0.20mi |
| 311 Mifflin Blvd Reading, PA | 2.0 | 1.0 | 1242 | $1,600 | $1.29 | 15d | 1 | 0.56mi |
| 8 Nassau Ct Reading, PA | 3.0 | 2.0 | 1260 | $1,900 | $1.51 | 15d | 1 | 1.11mi |
| 1401 Pershing Blvd Reading, PA | 2.0 | 1.0 | 1040 | $1,700 | $1.63 | 45d | 1 | 1.13mi |
| 1375 Pershing Blvd Unit D4 Reading, PA | 2.0 | 1.0 | 1000 | $1,700 | $1.70 | 45d | 1 | 1.22mi |
| 1342 W Wyomissing Blvd West Lawn, PA | 1.0–2.0 | 1.0–2.0 | 865 | $1,775 | $2.05 | 15d | 16 | 1.44mi |
Listing history 5 events
-
2026-04-29status Pending
-
2026-04-27historical
-
2026-04-24$234,900 Active
-
2026-04-23historical $234,900
-
1997-08-04soldstatus $80,000
ⓘ Source: listings_history table (triggers on properties + properties_extension) + one-shot
backfill from property_details.listing_events for pre-trigger history.
Tax reassessment forecast PA · Partial reset (capped growth)
- Current annual tax
- $3,773 · $314/mo
- Projected year-2 tax
- $3,773 · $314/mo
- Expected delta
- $0/yr ($0/mo · 0.0%)
ⓘ Screening estimate from a state-policy table — verify with the county assessor before closing.
Climate risk First Street
- Flood 1/10 Low FEMA zone X (unshaded) · 0% chance over 30 yrs
- Wildfire 1/10 Low
- Heat 6/10 Major 7 d/yr ≥100°F today · 16 d/yr by 30 yrs out
- Wind 4/10 Moderate 16% chance of damaging wind over 30 yrs
- Air quality 3/10 Moderate 2 unhealthy d/yr today · 3 by 30 yrs out
Nearby sold comps map
Loading sold comps map…
Walkable amenities ~0.75 mi
Loading nearby amenities…
Taxation est. · year 1
- Rental income
- $22,626
- − Mortgage interest
- −$13,158
- − Property taxes
- −$3,773
- − Insurance
- −$1,174
- − Repairs & maintenance
- −$1,810
- − Management
- −$1,810
- − Depreciation
- −$6,833
- Taxable loss
- −$5,934
- Est. tax savings @ 24.0%
- +$1,424
- After-tax cash flow
- $-432/yr
For passive investors: Depreciation is non-cash, so a rental often shows a tax loss while cash-flowing — sheltering income. Rental losses are passive: they offset passive income freely, and up to $25,000/yr can offset ordinary (W-2) income if you actively participate and your MAGI is under $100k (phasing out to $0 by $150k); unused losses carry forward. On sale, claimed depreciation is recaptured at up to 25%, and gains may owe capital-gains tax (a 1031 exchange can defer both). Figures are a year-1 estimate at your 24.0% rate — not tax advice; consult a CPA.
Schools (NCES district)
- District
- Governor Mifflin SD
- NCES district ID
- 4210860
- Math proficiency
- 31% ▼ -12.00%
- Reading proficiency
- 50% ▼ -11.00%
- Median HH income
- $60,881
- Composite
- 35.88/100
- National rank
- #4815
- State rank
- #325 of 539 in PA
Livability — Shillington
- Score
- 79/100
- State rank
- #230
- US rank
- #2007
Category grades
Schools grade is shown separately in the Schools card above.
Census & demographics
- Census place
- Shillington, PA
- County
- Berks County · 195,629 people
- Metro
- Reading, PA
- Population (ZIP)
- 24,045
- Household income
- $81,346
- Rent vs Own
- Severe rent burden
- 469.0
Population outlook (Berks County) Hauer SSP2
- Today (2025)
- 425,767 people
- By 2030
- 428,814 · +0.7%
- By 2040
- 433,463 · +1.8%
- By 2050
- 439,426 · +3.2%
- By 2075
- 478,647 · +12.4%
- By 2100
- 518,507 · +21.8%
Race, ethnicity, and origin ACS 2023
- Neighborhood character
- Predominantly White (67%)
- Race & ethnicity
- White 67% Hispanic / Latino 22% Two or more races 12% Black 5% Asian 1%
- Hispanic origin (detail)
- Mexican 3% Puerto Rican 14% Dominican 3%
- Common ancestry
- Romanian 5% Italian 2% Slovak 1%
- Foreign-born
- 7% · Canada, Jamaica
- Languages at home
- 83% English-only · Spanish 14% Russian/Polish/Slavic 1% Other Indo-European 1%
Political lean MEDSL · Berks
- 2024 margin
- R (+12.2) · D 43.4% · R 55.6%
- 2008→2024 swing
- -21.4pp toward R · 2008: 9.2pp · 2024: -12.2pp
- All cycles
- 2024: R+12.2 2020: R+8.2 2016: R+10.2 2012: R+0.6 2008: D+9.2
Not yet ingested
- Civics
- —
Market trends
- HPI YoY
- ▼ -46.25%
- Current HPI
- 282.2782
- Rent YoY
- —
- Metro
- Reading, PA
- State GDP YoY
- ▲ 1.68%
- F500 in state
- 34
Industry mix (Fortune 500 HQ in PA)
| Industry | F500 HQs | Revenue |
|---|---|---|
| Healthcare | 2 | $309B |
|
||
| Insurance | 2 | $27B |
|
||
| Telecommunications / Media | 1 | $124B |
|
||
| Industrial Distribution | 1 | $22B |
|
||
| Financial Services | 1 | $20B |
|
||
| Chemicals / Materials | 1 | $18B |
|
||
Price history
+193.6% since first listed5 events — show timeline
- 2026-04-29 Pending — BRIGHT MLS
- 2026-04-27 Listing Removed — BRIGHT MLS
- 2026-04-24 Listed $234,900 BRIGHT MLS
- 2026-04-23 Coming Soon $234,900 BRIGHT MLS
- 1997-08-04 Sold (Public Records) $80,000 Public Records
Property tax history
+2.2%/yrLatest (2026): $3,773 · +0.0% YoY. Source: county tax records.
Cash-flow waterfall
monthlySold comps — $/sqft
last 12 mo · ≤1 miLoading sold comps…