601 Gladys St · Lone Oak, TX
Flood risk 1/10 · Minimal
- FEMA flood zone
- X (unshaded)
- Chance of flooding over 30 yrs
- 0.0%
- Est. flood insurance / yr
- $507 – $1,088
Fire risk 5/10 · Moderate
- Est. fire insurance / yr
- $1,222 – $2,270
Heat risk 7/10 · Major
- Hot days now (above 110°F)
- 7 days/yr
- Hot days in 30 yrs
- 23 days/yr
Wind risk 6/10 · Moderate
- Chance of severe wind over 30 yrs
- 27.0%
Air-quality risk 2/10 · Minimal
- Unhealthy air days now
- 1 days/yr
- Unhealthy air days in 30 yrs
- 1 days/yr
Risk factors via First Street. Map © Google.
Why this score? — see what drove the B grade
The composite is a weighted blend of 9 inputs, each scored 0–100. Each bar is that input's sub-score; the figure is the points it added to the 100-point composite (weight × sub-score).
- Cash flow +22.1/30.0
- ARV discount +15.0/15.0
- Appreciation +10.0/10.0
- 1% rule +8.6/10.0
- DSCR +7.1/10.0
- Schools +3.7/10.0
- Livability +2.7/5.0
- Rent growth +2.5/5.0
- Condition / age +2.5/5.0
$129,900
🖨 Deal sheet 📄 Offer letter ✓ Due diligence
Listing remarks MLS
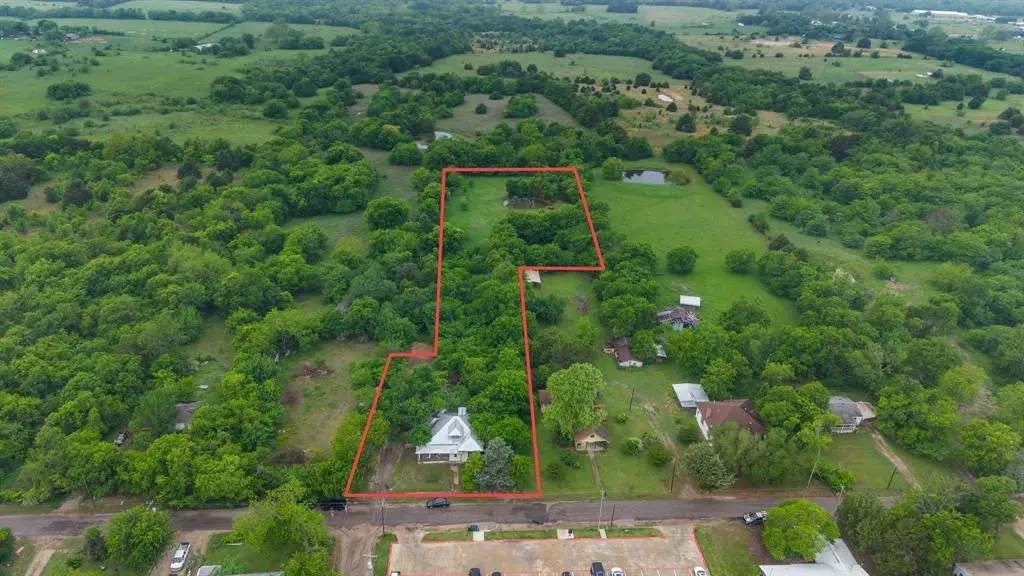
Opportunity awaits at 601 Gladys St in Lone Oak! Situated on approximately 3.75 acres with a pond, this property offers exceptional potential for investors, builders, or buyers looking for land in a growing area. This property is being sold as-is, in value for the land only. Whether you're looking to renovate, remove and rebuild, or hold as an investment, this property presents a rare chance to secure acreage with valuable features inside city limits. Bring your vision and unlock the possibilities this unique tract has to offer.
Key facts
- Unique tract
- Pond
- Inside city limits
Tags
Neighborhood map
What this means for you Summary
Snapshot
- This is a 4-bed/2.0-bath single-family listed at $130k.
Deal economics
- At list price, monthly cash flow is $208 ($2k/yr) — positive.
- The deal already cash-flows at list — no discount required.
- Meets the 1% rule at list price ($2k rent vs $130k).
- Recommended offer: $128k (1.5% below list) — sets the bar for market timing.
- Cap rate 8.2% vs local median 2.2% in Lone Oak — top-decile yield for the area; either an underpriced asset or a hidden risk that comps aren't pricing in. Stress-test before assuming the spread holds.
Location & tenants
- Location reads 53/100 on livability (#1,438 in TX) — a working-class tenant base; expect higher turnover. Strengths: cost of living A+, housing A+; Watch: schools D+, employment D+, crime F.
- Lone Oak ISD (rural): math 42% / reading 43% proficiency, ranked #310 of 826 in TX (top 38%) — families likely to look elsewhere, expect single-tenant / working-renter base with shorter leases.
- Market conditions: 115 active listings in the ZIP; 1,289 units permitted in Hunt County in 2024 (527 in 5+ unit buildings).
Forward outlook
- In year one you build about $14k of equity ($898 loan paydown + $13k appreciation (10.0% local appreciation)).
- Hunt County population projected at +15% by 2050 — modest demand growth; plan on rents tracking national, not racing it.
- At projected returns (10.0% appreciation + 3.0% rent growth), your $36k cash investment doubles in ~3 years — after that, you're playing with house money.
- By year 3, paydown + projected appreciation supports a ~$35k cash-out refi (75% LTV) — recoverable capital for the next deal without selling this one.
Negotiation context
- It's been on market 29 days — a 2% lower offer ($128k) is reasonable based on typical stale-listing flexibility.
Risks & watch-outs
- Watch-outs: property tax is 4.2% of price; built in 1905 — expect roof / HVAC / electrical / plumbing capex.
- Climate carrying-cost: major wind risk, 27% chance of damaging wind over 30y; moderate wildfire risk; extreme-heat days projected 7→23/yr by 2055 (HVAC capex compounding) — expect insurance premiums to compound above CPI over the hold.
Questions for the listing agent
- Built in 1905 — when were the roof, HVAC, electrical panel, plumbing, and water heater last replaced?
- Property tax is high relative to price — has the assessment been appealed recently, and will the sale trigger a re-assessment?
- Is there a deadline driving the sale (1031 exchange, divorce, estate, relocation)? That informs how much negotiation room exists.
- Schools are D-rated, which usually means shorter tenancies and higher turnover. Who's the typical renter profile here, and what's been the actual vacancy rate?
- Crime grade is F in this area — have there been break-ins, vandalism, or insurance claims at this property in the last 3 years? What carrier currently insures it and at what premium?
- What's the average days-on-market for RENTAL listings here right now (not sales)? A rising rental-DOM trend means longer vacancies and softer asking-rent achievability than the comps imply.
- What's the recent tenant-quality profile in this submarket — average credit score on applications, eviction rate, late-payment / NSF rate, and stable-employment percentage? A property-management company in the area should have these aggregated.
- How much new for-sale + rental construction is in the pipeline within 1–3 miles? Heavy new supply typically softens prices + rents 12–24 months out; constrained supply supports both.
Investment metrics
- 1% rule
- 1.36% ✓
- Cap rate
- 8.22%
- Cash-on-cash
- 6.87%
- DSCR
- 1.31
- GRM
- 6.1
CMA / ARV
- ARV (median comp)
- $258,576
- List price
- $129,900
- Delta
- -49.76%
- Verdict
- UNDERPRICED
- Comps
- 20 within 1.0 mi
Show comp detail 8 sales within ~0.75 mi
| Address | Dist | Beds/Ba | Sqft | Sold | Price | $/sf | Match |
|---|---|---|---|---|---|---|---|
| 601 Gladys St | 0.00mi | 4/2.0 | 1,780 (0%) | 1mo | $129,900 | $73 | 99 |
| 705 Gladys St | 0.13mi | 3/2.0 (-1) | 1,920 (+8%) | 12mo | $395,000 | $206 | 66 |
| 300 Church St | 0.46mi | 3/2.0 (-1) | 1,771 (-0%) | 21mo | $232,000 | $131 | 56 |
| 418 Mesa | 0.63mi | 4/2.0 | 1,670 (-6%) | 14mo | $269,000 | $161 | 49 |
| 103 Division St | 0.49mi | 5/3.0 (+1) | 1,976 (+11%) | 2mo | $225,000 | $114 | 48 |
| 416 Mesa | 0.61mi | 3/2.0 (-1) | 1,992 (+12%) | 10mo | $304,900 | $153 | 39 |
| 421 Mesa | 0.63mi | 4/2.0 | 1,961 (+10%) | 20mo | $315,000 | $161 | 37 |
| 424 Mesa Dr | 0.67mi | 3/2.0 (-1) | 1,600 (-10%) | 16mo | $284,900 | $178 | 34 |
Match score weights: distance 35% · size 25% · config 20% · recency 20%. Top-matched comps best support the ARV.
Projected returns pro-forma
10.0% appreciation · 3.0% rent growth · sell at horizon
- IRR
- 29.3%
- Equity multiple
- 3.32×
- Total profit
- $84,216
- Equity at exit
- $117,024
- IRR
- 25.5%
- Equity multiple
- 7.54×
- Total profit
- $237,981
- Equity at exit
- $252,367
Cash invested: $36,372 (down + closing). Projections, not guarantees.
Landlord ↔ Tenant lean methodology
- Overall (STATE)
- 87 Strongly Landlord-Friendly
- State Texas
- 87 Strongly Landlord-Friendly · R+5
- County
- — inherits STATE
- City
- — inherits STATE
ZIP-level market 75453
- Home prices YoY
- 25.2%
- Active inventory
- 115
- Price-to-rent
- 6.1×
Monthly cashflow live
- Estimated rent
- $1,769 medium interval (Pro) →
- Mortgage (P&I)
- −$681
- Tax from tax record
- −$454 /mo · $5,443/yr
- Insurance
- −$54
- HOA
- −$0
- Vacancy / Maint / Mgmt
- −$371
- Net cashflow
- $208
Break-even live
UW: 25.0% down · 7.5% · 30yr · 1.5% tax · 5.0% vac · 8.0% maint · 8.0% mgmt
Financing live
Cash to close
- Down payment
- $32,475
- Closing costs
- $3,897
- Reserves months
- —
- Total cash needed
- —
Loan-product check · same deal, 3 products live
Conventional
25% down · 7.5% · 30yr
- Down + closing
- —
- Monthly P&I
- —
- Monthly cashflow
- —
- DSCR
- —
- Eligible?
- —
Personal DTI + credit; lowest rate.
DSCR
20% down · 8.5% · 30yr
- Down + closing
- —
- Monthly P&I
- —
- Monthly cashflow
- —
- DSCR
- —
- Eligible?
- —
No personal income docs; deal must DSCR.
Hard money
10% down · 12.0% · 12mo
- Down + closing
- —
- Monthly P&I
- —
- Monthly cashflow
- —
- DSCR
- —
- Eligible?
- —
Short-term bridge; refi at stabilization.
Listing history 6 events
-
2026-05-15status Pending 534-char remark
Show marketing remark (534 chars)
Opportunity awaits at 601 Gladys St in Lone Oak! Situated on approximately 3.75 acres with a pond, this property offers exceptional potential for investors, builders, or buyers looking for land in a growing area. This property is being sold as-is, in value for the land only. Whether you're looking to renovate, remove and rebuild, or hold as an investment, this property presents a rare chance to secure acreage with valuable features inside city limits. Bring your vision and unlock the possibilities this unique tract has to offer.
-
2026-05-08historical Active Option Contract 534-char remark
Show marketing remark (534 chars)
Opportunity awaits at 601 Gladys St in Lone Oak! Situated on approximately 3.75 acres with a pond, this property offers exceptional potential for investors, builders, or buyers looking for land in a growing area. This property is being sold as-is, in value for the land only. Whether you're looking to renovate, remove and rebuild, or hold as an investment, this property presents a rare chance to secure acreage with valuable features inside city limits. Bring your vision and unlock the possibilities this unique tract has to offer.
-
2026-05-07price $129,900 534-char remark
Show marketing remark (534 chars)
Opportunity awaits at 601 Gladys St in Lone Oak! Situated on approximately 3.75 acres with a pond, this property offers exceptional potential for investors, builders, or buyers looking for land in a growing area. This property is being sold as-is, in value for the land only. Whether you're looking to renovate, remove and rebuild, or hold as an investment, this property presents a rare chance to secure acreage with valuable features inside city limits. Bring your vision and unlock the possibilities this unique tract has to offer.
-
2026-04-16$139,900 Active 534-char remark
Show marketing remark (534 chars)
Opportunity awaits at 601 Gladys St in Lone Oak! Situated on approximately 3.75 acres with a pond, this property offers exceptional potential for investors, builders, or buyers looking for land in a growing area. This property is being sold as-is, in value for the land only. Whether you're looking to renovate, remove and rebuild, or hold as an investment, this property presents a rare chance to secure acreage with valuable features inside city limits. Bring your vision and unlock the possibilities this unique tract has to offer.
-
2026-04-10soldstatus
-
2021-07-09soldstatus
ⓘ Source: listings_history table (triggers on properties + properties_extension) + one-shot
backfill from property_details.listing_events for pre-trigger history.
Tax reassessment forecast TX · Resets to sale price
- Current annual tax
- $5,443 · $454/mo
- Projected year-2 tax
- $5,443 · $454/mo
- Expected delta
- $0/yr ($0/mo · 0.0%)
ⓘ Screening estimate from a state-policy table — verify with the county assessor before closing.
Climate risk First Street
- Flood 1/10 Low FEMA zone X (unshaded) · 0% chance over 30 yrs
- Wildfire 5/10 Major
- Heat 7/10 Severe 7 d/yr ≥110°F today · 23 d/yr by 30 yrs out
- Wind 6/10 Major 27% chance of damaging wind over 30 yrs
- Air quality 2/10 Low 1 unhealthy d/yr today · 1 by 30 yrs out
Nearby sold comps map
Loading sold comps map…
Walkable amenities ~0.75 mi
Loading nearby amenities…
Taxation est. · year 1
- Rental income
- $21,222
- − Mortgage interest
- −$7,276
- − Property taxes
- −$5,443
- − Insurance
- −$650
- − Repairs & maintenance
- −$1,698
- − Management
- −$1,698
- − Depreciation
- −$3,779
- Taxable income
- $679
- Est. tax owed @ 24.0%
- −$163
- After-tax cash flow
- $2,336/yr
For passive investors: Depreciation is non-cash, so a rental often shows a tax loss while cash-flowing — sheltering income. Rental losses are passive: they offset passive income freely, and up to $25,000/yr can offset ordinary (W-2) income if you actively participate and your MAGI is under $100k (phasing out to $0 by $150k); unused losses carry forward. On sale, claimed depreciation is recaptured at up to 25%, and gains may owe capital-gains tax (a 1031 exchange can defer both). Figures are a year-1 estimate at your 24.0% rate — not tax advice; consult a CPA.
Schools (NCES district)
- District
- Lone Oak ISD
- NCES district ID
- 4828020
- Math proficiency
- 42% ▼ -9.00%
- Reading proficiency
- 43% ▼ -7.00%
- Median HH income
- $51,628
- Composite
- 36.72/100
- National rank
- #4593
- State rank
- #310 of 826 in TX
Livability — Lone Oak
- Score
- 53/100
- State rank
- #1438
- US rank
- #24556
Category grades
Schools grade is shown separately in the Schools card above.
Census & demographics
- Census place
- Lone Oak, TX
- Population (ZIP)
- 2,832
Population outlook (Hunt County) Hauer SSP2
- Today (2025)
- 97,090 people
- By 2030
- 100,452 · +3.5%
- By 2040
- 106,544 · +9.7%
- By 2050
- 111,218 · +14.6%
- By 2075
- 121,695 · +25.3%
- By 2100
- 123,683 · +27.4%
Race, ethnicity, and origin ACS 2023
- Neighborhood character
- Predominantly White (73%)
- Race & ethnicity
- White 73% Hispanic / Latino 17% Two or more races 7% Black 1%
- Hispanic origin (detail)
- Mexican 15%
- Common ancestry
- Italian 2% Portuguese 1% Romanian 1%
- Foreign-born
- 7% · Canada
- Languages at home
- 93% English-only · Spanish 6% Other Asian/Pacific 1%
Political lean MEDSL · Hunt
- 2024 margin
- Solid R (+55.5) · D 21.9% · R 77.4%
- 2008→2024 swing
- -14.9pp toward R · 2008: -40.6pp · 2024: -55.5pp
- All cycles
- 2024: R+55.5 2020: R+52.5 2016: R+56.3 2012: R+51.2 2008: R+40.6
Not yet ingested
- Civics
- —
Market trends
- HPI YoY
- ▲ 51.45%
- Current HPI
- 255.6167
- Rent YoY
- —
- Metro
- —
- State GDP YoY
- ▲ 3.95%
- F500 in state
- 110
Industry mix (Fortune 500 HQ in TX)
| Industry | F500 HQs | Revenue |
|---|---|---|
| Energy | 16 | $1,198B |
|
||
| Technology | 5 | $198B |
|
||
| Engineering / Construction | 4 | $72B |
|
||
| Energy Services | 3 | $60B |
|
||
| Utilities | 3 | $41B |
|
||
| Healthcare | 2 | $330B |
|
||
Price history
-7.1% since first listed6 events — show timeline
- 2026-05-15 Pending — NTREIS
- 2026-05-08 Contingent — NTREIS
- 2026-05-07 Price Changed $129,900 NTREIS
- 2026-04-16 Listed $139,900 NTREIS
- 2026-04-10 Sold (Public Records) — Public Records
- 2021-07-09 Sold (Public Records) — Public Records
Property tax history
+5.3%/yrLatest (2025): $5,443 · +15.4% YoY. Source: county tax records.
Cash-flow waterfall
monthlySold comps — $/sqft
last 12 mo · ≤1 miLoading sold comps…