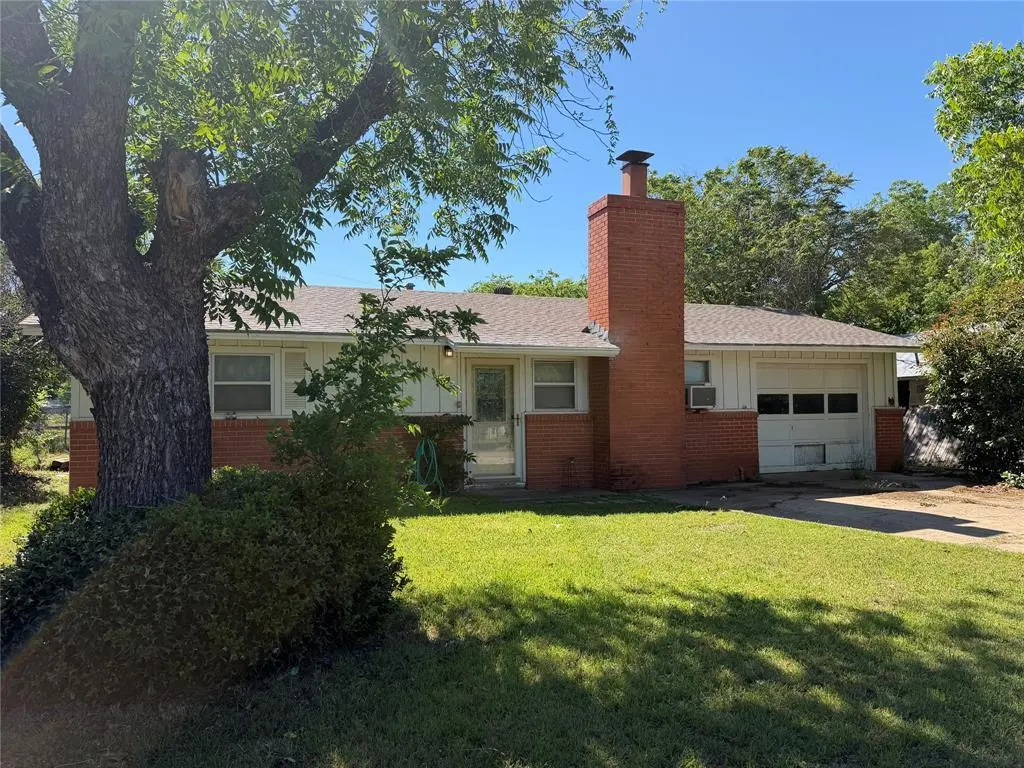
424 Vine St · Baird, TX
Flood risk 1/10 · Minimal
- FEMA flood zone
- X
- Chance of flooding over 30 yrs
- 0.0%
- Est. flood insurance / yr
- $507 – $1,088
Fire risk 8/10 · Major
- Est. fire insurance / yr
- $1,222 – $2,270
Heat risk 6/10 · Moderate
- Hot days now (above 104°F)
- 7 days/yr
- Hot days in 30 yrs
- 22 days/yr
Wind risk 4/10 · Minor
- Chance of severe wind over 30 yrs
- 14.0%
Air-quality risk 1/10 · Minimal
- Unhealthy air days now
- 0 days/yr
- Unhealthy air days in 30 yrs
- 0 days/yr
Risk factors via First Street. Map © Google.
Why this score? — see what drove the A grade
The composite is a weighted blend of 9 inputs, each scored 0–100. Each bar is that input's sub-score; the figure is the points it added to the 100-point composite (weight × sub-score).
- Cash flow +30.0/30.0
- ARV discount +15.0/15.0
- 1% rule +10.0/10.0
- DSCR +10.0/10.0
- Appreciation +8.9/10.0
- Livability +3.7/5.0
- Schools +3.6/10.0
- Rent growth +2.5/5.0
- Condition / age +2.5/5.0
$105,000
🖨 Deal sheet 📄 Offer letter ✓ Due diligence
Listing remarks MLS
Non traditional floor plan, huge room built for master is used for den with wet bar and opens to back yard, kitchen- dining- living has fireplace. 2 or 3 bedrooms, 2 baths, one car garage. Lot is irregular shape..
Key facts
- Built in storage
- Natural light
- Bar area
Tags
Property features AI
Finance
- Other: Possession at closing/funding; Survey available
- Financial info: Accepts cash and conventional financing
- HOA & community: No association
Exterior
- Parking: Attached garage; Garage faces front; 2-car single door; Inside entrance; 1 covered parking space; Garage approximately 13' wide by 23' long
- Utilities: City water; City sewer; Not in a municipal utility district
- Home design: Single-family residence; Residential property; One story; Built in 1960; Subdivision: Railroad - Baird
- Construction: Composition roof; Slab foundation
- Exterior features: Chain link fencing; Less than 0.5-acre lot
Interior
- Kitchen: Electric cooktop; Electric oven; Refrigerator
- Bedrooms: Primary bedroom (main level) with walk-in closet; Two additional bedrooms (main level)
- Flooring: Carpet; Laminate
- Bathrooms: Two full bathrooms
- Heating & cooling: Ceiling fan(s); Wall/window unit(s); Other heating
- Interior features: High-speed internet available; Paneling; Walk-in closet(s); One living area; One dining area; Room count: 5; One-level home
- Laundry & utility: Full-size washer/dryer area; Washer included; Dryer included
Neighborhood map
What this means for you Summary
Snapshot
- This is a 3-bed/2.0-bath single-family listed at $105k.
Deal economics
- At list price, monthly cash flow is $1k ($14k/yr) — positive.
- The deal already cash-flows at list — no discount required.
- Meets the 1% rule at list price ($2k rent vs $105k).
- Recommended offer: $103k (1.5% below list) — sets the bar for market timing.
Location & tenants
- Location reads 74/100 on livability (#195 in TX, #4,977 nationally) — a middle-class / working-renter tenant base. Strengths: cost of living A+, housing A+, health & safety A+; Watch: employment C-, amenities F, commute F.
- Baird ISD (rural): math 40% / reading 40% proficiency, ranked #731 of 1,141 in TX (top 64%) — families likely to look elsewhere, expect single-tenant / working-renter base with shorter leases; 63% free/reduced lunch — lower-income household profile, screen leases tightly.
- Zoned schools: Baird El (math 47% / reading 37%, grade F, #1,335 of 4,322 statewide, top 33%, 169 students, 57% FRL).
- Market conditions: 20 active listings in the ZIP; 11 units permitted in Callahan County in 2024 (0 in 5+ unit buildings).
Forward outlook
- In year one you build about $9k of equity ($726 loan paydown + $8k appreciation (7.7% local appreciation)).
- Callahan County population projected to shrink 5% by 2050 — rents likely to lag national; underwrite the cash flow, not the appreciation.
- At projected returns (7.7% appreciation + 3.0% rent growth), your $29k cash investment doubles in ~2 years — after that, you're playing with house money.
- By year 4, paydown + projected appreciation supports a ~$31k cash-out refi (75% LTV) — recoverable capital for the next deal without selling this one.
Negotiation context
- It's been on market 26 days — a 2% lower offer ($103k) is reasonable based on typical stale-listing flexibility.
- 2 sale attempts since 5y ago; this cycle's ask has dropped $15k (12%) from the opening price — seller is motivated, your offer sets the floor, not the list.
Risks & watch-outs
- Climate carrying-cost: severe wildfire risk; extreme-heat days projected 7→22/yr by 2055 (HVAC capex compounding) — expect insurance premiums to compound above CPI over the hold.
Questions for the listing agent
- Built in 1960 — when were the roof, HVAC, electrical panel, plumbing, and water heater last replaced?
- Is there a deadline driving the sale (1031 exchange, divorce, estate, relocation)? That informs how much negotiation room exists.
- What's the average days-on-market for RENTAL listings here right now (not sales)? A rising rental-DOM trend means longer vacancies and softer asking-rent achievability than the comps imply.
- What's the recent tenant-quality profile in this submarket — average credit score on applications, eviction rate, late-payment / NSF rate, and stable-employment percentage? A property-management company in the area should have these aggregated.
- How much new for-sale + rental construction is in the pipeline within 1–3 miles? Heavy new supply typically softens prices + rents 12–24 months out; constrained supply supports both.
Investment metrics
- 1% rule
- 2.31% ✓
- Cap rate
- 19.61%
- Cash-on-cash
- 47.55%
- DSCR
- 3.12
- GRM
- 3.6
CMA / ARV
- ARV (on-the-fly)
- $147,771
- Comps found
- 12
Show comp detail 12 sales within ~0.75 mi
| Address | Dist | Beds/Ba | Sqft | Sold | Price | $/sf | Match |
|---|---|---|---|---|---|---|---|
| 317 W 7th St | 0.18mi | 3/2.0 | 1,233 (-2%) | 5mo | $105,000 | $85 | 84 |
| 441 Race St | 0.11mi | 3/2.0 | 1,237 (-2%) | 15mo | $183,900 | $149 | 79 |
| 341 Callowhill St | 0.06mi | 2/2.0 (-1) | 1,284 (+2%) | 21mo | $149,900 | $117 | 72 |
| 533 Poplar St | 0.14mi | 2/1.0 (-1) | 1,312 (+4%) | 19mo | $165,000 | $126 | 62 |
| 940 Market St | 0.44mi | 3/2.0 | 1,322 (+5%) | 24mo | $155,000 | $117 | 52 |
| 717 W 3rd St | 0.27mi | 2/1.5 (-1) | 1,114 (-12%) | 14mo | $120,000 | $108 | 50 |
| 500 Peyton St | 0.36mi | 3/1.0 | 1,092 (-14%) | 11mo | $100,000 | $92 | 47 |
| 1040 N Ross Dr | 0.74mi | 3/1.0 | 1,260 (-0%) | 18mo | $160,000 | $127 | 46 |
| 1264 W 3rd St | 0.60mi | 3/2.0 | 1,356 (+7%) | 22mo | $134,900 | $99 | 42 |
| 725 E 6th St | 0.72mi | 3/1.5 | 1,130 (-10%) | 9mo | $160,000 | $142 | 40 |
| 808 Cherry St | 0.71mi | 3/2.0 | 1,362 (+8%) | 18mo | $59,900 | $44 | 39 |
| 408 Stella | 0.70mi | 2/1.5 (-1) | 1,184 (-6%) | 17mo | $62,400 | $53 | 36 |
Match score weights: distance 35% · size 25% · config 20% · recency 20%. Top-matched comps best support the ARV.
Projected returns pro-forma
7.74% appreciation · 3.0% rent growth · sell at horizon
- IRR
- 58.7%
- Equity multiple
- 4.94×
- Total profit
- $115,762
- Equity at exit
- $77,924
- IRR
- 54.1%
- Equity multiple
- 10.55×
- Total profit
- $280,816
- Equity at exit
- $152,950
Cash invested: $29,400 (down + closing). Projections, not guarantees.
Landlord ↔ Tenant lean methodology
- Overall (STATE)
- 87 Strongly Landlord-Friendly
- State Texas
- 87 Strongly Landlord-Friendly · R+5
- County
- — inherits STATE
- City
- — inherits STATE
ZIP-level market 79504
- Home prices YoY
- 5.0%
- Active inventory
- 20
- Price-to-rent
- 3.6×
Monthly cashflow live
- Estimated rent
- $2,423 medium interval (Pro) →
- Mortgage (P&I)
- −$551
- Tax from tax record
- −$155 /mo · $1,858/yr
- Insurance
- −$44
- HOA
- −$0
- Vacancy / Maint / Mgmt
- −$509
- Net cashflow
- $1,165
Break-even live
UW: 25.0% down · 7.5% · 30yr · 1.5% tax · 5.0% vac · 8.0% maint · 8.0% mgmt
Financing live
Cash to close
- Down payment
- $26,250
- Closing costs
- $3,150
- Reserves months
- —
- Total cash needed
- —
Loan-product check · same deal, 3 products live
Conventional
25% down · 7.5% · 30yr
- Down + closing
- —
- Monthly P&I
- —
- Monthly cashflow
- —
- DSCR
- —
- Eligible?
- —
Personal DTI + credit; lowest rate.
DSCR
20% down · 8.5% · 30yr
- Down + closing
- —
- Monthly P&I
- —
- Monthly cashflow
- —
- DSCR
- —
- Eligible?
- —
No personal income docs; deal must DSCR.
Hard money
10% down · 12.0% · 12mo
- Down + closing
- —
- Monthly P&I
- —
- Monthly cashflow
- —
- DSCR
- —
- Eligible?
- —
Short-term bridge; refi at stabilization.
Listing history 14 events
-
2026-06-09status $105,000 Pending 26 DOM
-
2026-06-08days on market $105,000 Active 26 DOM
-
2026-06-08days on market $105,000 Active 25 DOM
-
2026-06-05days on market $105,000 Active 23 DOM
-
2026-06-03days on market $105,000 Active 21 DOM
-
2026-06-02days on market $105,000 Active 20 DOM
-
2026-06-01days on market $105,000 Active 19 DOM
-
2026-05-31days on market $105,000 Active 18 DOM
-
2026-05-13$120,000 Active
-
2021-12-20soldstatus
-
2021-12-17soldstatus Sold 213-char remark
Show marketing remark (213 chars)
Non traditional floor plan, huge room built for master is used for den with wet bar and opens to back yard, kitchen- dining- living has fireplace. 2 or 3 bedrooms, 2 baths, one car garage. Lot is irregular shape..
-
2021-12-14status Pending 213-char remark
Show marketing remark (213 chars)
Non traditional floor plan, huge room built for master is used for den with wet bar and opens to back yard, kitchen- dining- living has fireplace. 2 or 3 bedrooms, 2 baths, one car garage. Lot is irregular shape..
-
2021-11-18historical Active Option Contract 213-char remark
Show marketing remark (213 chars)
Non traditional floor plan, huge room built for master is used for den with wet bar and opens to back yard, kitchen- dining- living has fireplace. 2 or 3 bedrooms, 2 baths, one car garage. Lot is irregular shape..
-
2021-11-05$69,000 Active 213-char remark
Show marketing remark (213 chars)
Non traditional floor plan, huge room built for master is used for den with wet bar and opens to back yard, kitchen- dining- living has fireplace. 2 or 3 bedrooms, 2 baths, one car garage. Lot is irregular shape..
ⓘ Source: listings_history table (triggers on properties + properties_extension) + one-shot
backfill from property_details.listing_events for pre-trigger history.
Tax reassessment forecast TX · Resets to sale price
- Current annual tax
- $1,858 · $155/mo
- Projected year-2 tax
- $1,922 · $160/mo
- Expected delta
- +$64/yr (+$5/mo · 3.4%)
ⓘ Screening estimate from a state-policy table — verify with the county assessor before closing.
Climate risk First Street
- Flood 1/10 Low FEMA zone X · 0% chance over 30 yrs
- Wildfire 8/10 Severe
- Heat 6/10 Major 7 d/yr ≥104°F today · 22 d/yr by 30 yrs out
- Wind 4/10 Moderate 14% chance of damaging wind over 30 yrs
- Air quality 1/10 Low 0 unhealthy d/yr today · 0 by 30 yrs out
Nearby sold comps map
Loading sold comps map…
Walkable amenities ~0.75 mi
Loading nearby amenities…
Taxation est. · year 1
- Rental income
- $29,075
- − Mortgage interest
- −$5,882
- − Property taxes
- −$1,858
- − Insurance
- −$525
- − Repairs & maintenance
- −$2,326
- − Management
- −$2,326
- − Depreciation
- −$3,055
- Taxable income
- $13,104
- Est. tax owed @ 24.0%
- −$3,145
- After-tax cash flow
- $10,834/yr
For passive investors: Depreciation is non-cash, so a rental often shows a tax loss while cash-flowing — sheltering income. Rental losses are passive: they offset passive income freely, and up to $25,000/yr can offset ordinary (W-2) income if you actively participate and your MAGI is under $100k (phasing out to $0 by $150k); unused losses carry forward. On sale, claimed depreciation is recaptured at up to 25%, and gains may owe capital-gains tax (a 1031 exchange can defer both). Figures are a year-1 estimate at your 24.0% rate — not tax advice; consult a CPA.
Schools (NCES district)
- District
- Baird ISD
- NCES district ID
- 4809280
- Math proficiency
- 40% ▲ 10.00%
- Reading proficiency
- 40% ▲ 5.00%
- Median HH income
- $43,351
- Composite
- 36.29/100
- National rank
- #9407
- State rank
- #731 of 1141 in TX
Livability — Baird
- Score
- 74/100
- State rank
- #195
- US rank
- #4977
Category grades
Schools grade is shown separately in the Schools card above.
Census & demographics
- Census place
- Baird, TX
- Population (ZIP)
- 2,995
Population outlook (Callahan County) Hauer SSP2
- Today (2025)
- 13,664 people
- By 2030
- 13,578 · -0.6%
- By 2040
- 13,283 · -2.8%
- By 2050
- 13,008 · -4.8%
- By 2075
- 12,354 · -9.6%
- By 2100
- 11,326 · -17.1%
Race, ethnicity, and origin ACS 2023
- Neighborhood character
- Predominantly White (84%)
- Race & ethnicity
- White 84% Hispanic / Latino 11% Two or more races 7% Black 2%
- Hispanic origin (detail)
- Mexican 10%
- Common ancestry
- Italian 16% Slovak 2% Iranian 1%
- Foreign-born
- 1% · Canada
- Languages at home
- 94% English-only · Spanish 6%
Political lean MEDSL · Callahan
- 2024 margin
- Solid R (+77.6) · D 10.9% · R 88.5%
- 2008→2024 swing
- -15.9pp toward R · 2008: -61.7pp · 2024: -77.6pp
- All cycles
- 2024: R+77.6 2020: R+77.3 2016: R+77.2 2012: R+69.8 2008: R+61.7
Not yet ingested
- Civics
- —
Market trends
- HPI YoY
- ▲ 7.74%
- Current HPI
- 161.9583
- Rent YoY
- —
- Metro
- —
- State GDP YoY
- ▲ 3.95%
- F500 in state
- 110
Industry mix (Fortune 500 HQ in TX)
| Industry | F500 HQs | Revenue |
|---|---|---|
| Energy | 16 | $1,198B |
|
||
| Technology | 5 | $198B |
|
||
| Engineering / Construction | 4 | $72B |
|
||
| Energy Services | 3 | $60B |
|
||
| Utilities | 3 | $41B |
|
||
| Healthcare | 2 | $330B |
|
||
Price history
+73.9% since first listed6 events — show timeline
- 2026-05-13 Listed $120,000 NTREIS
- 2021-12-20 Sold (Public Records) — Public Records
- 2021-12-17 Sold (MLS) — NTREIS
- 2021-12-14 Pending — NTREIS
- 2021-11-18 Contingent — NTREIS
- 2021-11-05 Listed $69,000 NTREIS
Property tax history
+6.3%/yrLatest (2025): $1,858 · -3.0% YoY. Source: county tax records.
Cash-flow waterfall
monthlySold comps — $/sqft
last 12 mo · ≤1 miLoading sold comps…