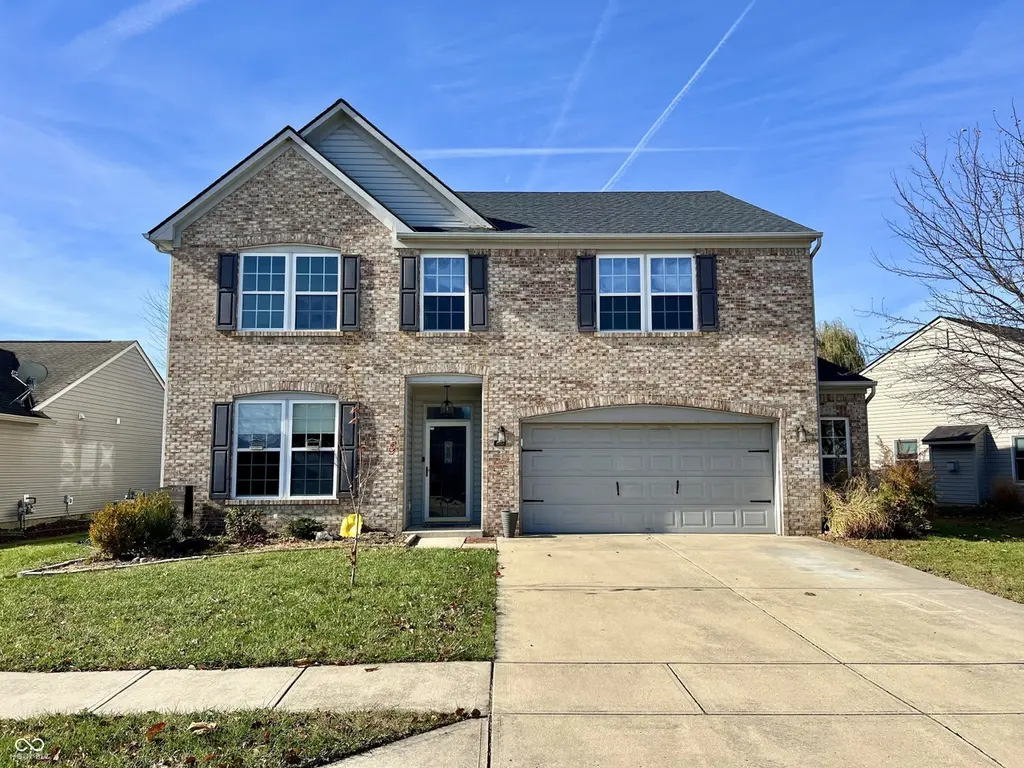
4088 Del Mar Ln · Plainfield, IN
Flood risk 1/10 · Minimal
- FEMA flood zone
- X (unshaded)
- Chance of flooding over 30 yrs
- 0.0%
- Est. flood insurance / yr
- $507 – $1,088
Fire risk 1/10 · Minimal
- Est. fire insurance / yr
- $717 – $1,331
Heat risk 4/10 · Minor
- Hot days now (above 101°F)
- 7 days/yr
- Hot days in 30 yrs
- 19 days/yr
Wind risk 2/10 · Minimal
- Chance of severe wind over 30 yrs
- 1.0%
Air-quality risk 3/10 · Minor
- Unhealthy air days now
- 2 days/yr
- Unhealthy air days in 30 yrs
- 3 days/yr
Risk factors via First Street. Map © Google.
Why this score? — see what drove the D- grade
The composite is a weighted blend of 9 inputs, each scored 0–100. Each bar is that input's sub-score; the figure is the points it added to the 100-point composite (weight × sub-score).
- ARV discount +13.6/15.0
- Cash flow +7.5/30.0
- Schools +5.5/10.0
- Livability +3.7/5.0
- Rent growth +3.4/5.0
- Condition / age +2.5/5.0
- DSCR +1.7/10.0
- 1% rule +1.5/10.0
- Appreciation +0.0/10.0
$349,900
🖨 Deal sheet 📄 Offer letter ✓ Due diligence
Listing remarks MLS
Bright and spacious, 2 story home with 4 BD/3 FULL BATH in Paddock of Saratoga near parks & trails. Great Room is open thru to the Kitchen, featuring a large pantry. Master Suite includes a huge walk-in closet...All 4 Bedrooms have walk-in closets. Upstairs has a large loft. Enjoy the beautiful pond view. Fully fenced back yard. Extra space in garage for storage. WINDOWS GALORE...Let the Sun Shine in!
Key facts
- Office sitting room
- Ss appliances
- Movable island
Tags
Property features AI
Finance
- HOA & community: HOA with mandatory fee; Semi-annual association fee; HOA covers entrance/common areas, insurance, maintenance, park and playground; Community amenities: park, playground; HOA governed by covenants and restrictions
Exterior
- Parking: Attached 2-car garage with keyless entry and garage door opener
- Security: Security system; Smoke alarm
- Utilities: Public water; Municipal sewer connected; Natural gas connected; Cable available
- Home design: Single-family residence; Two levels; Residential property
- Construction: Vinyl with brick exterior; Slab foundation
- Exterior features: Covered patio/porch; Fire pit; Full fence; Mature trees; Sidewalks; Storm sewer; Pond and water view (on waterfront)
Interior
- Kitchen: Dishwasher; Gas oven; Microwave with hood; Garbage disposal; Refrigerator; Water purifier
- Bedrooms: Primary bedroom with walk-in closet; Four upper-level bedrooms
- Bathrooms: Three full bathrooms; Primary bathroom with tub and shower
- Heating & cooling: Forced air heating (natural gas); Central air conditioning
- Interior features: Attic access; High ceilings; Walk-in closets; Eat-in kitchen; Pantry; Smart thermostat; Utility room
- Laundry & utility: Main-level laundry; Washer and dryer included; Tankless water heater; Water softener (owned)
Neighborhood map
What this means for you Summary
Snapshot
- This is a 4-bed/3.0-bath single-family listed at $350k.
Deal economics
- At list price, monthly cash flow is $-430 ($-5k/yr) — negative.
- To cash-flow at today's rent, offer at most $274k (21.7% below list).
- To meet the 1% rule (rent ≥ 1% of price), the offer needs to be $226k (35.4% below list).
- Recommended offer: $226k (35.4% below list) — sets the bar for 1% rule.
- Cap rate 4.8% vs local median 3.7% in Plainfield — top-decile yield for the area; either an underpriced asset or a hidden risk that comps aren't pricing in. Stress-test before assuming the spread holds.
Location & tenants
- Location reads 74/100 on livability (#69 in IN, #4,418 nationally) — a middle-class / working-renter tenant base. Strengths: cost of living A+, housing A+; Watch: health & safety C-, amenities F, commute F.
- Plainfield Community School Corporation (suburban): math 62% / reading 65% proficiency, ranked #11 of 301 in IN (top 4%) — acceptable for families but not a draw, mixed tenant base, ~2y average lease.
- Zoned schools: Plainfield High School (math 59% / reading 84%, grade B+, #15 of 369 statewide, top 4%, 1,782 students, 26% FRL) — zoned schools at 26% FRL track the district average.
- Market conditions: Rents rising (+3.6%/yr); 284 active listings in the ZIP; 3 comparable units currently listed for rent nearby; rentals lingering (median 44d on market — plan ~5-8 weeks vacancy on turnover, expect pricing pressure); 100% of comp listings sitting > 30 days — soft ceiling on asking rent; solid renter incomes; 1,294 units permitted in Hendricks County in 2024 (18 in 5+ unit buildings).
- This rent runs 30% of the median local income ($90k/yr) — at the standard rent-burdened threshold; future hikes will face affordability resistance.
Forward outlook
- Local home prices are declining (-3.0%/yr); year-one equity from $2k of loan paydown is wiped out by about $10k of value loss. Plan a longer hold.
- Hendricks County population projected at +35% by 2050 — long-run rental-demand tailwind backs the buy-and-hold thesis.
Negotiation context
- It's been on market 21 days — a 2% lower offer ($345k) is reasonable based on typical stale-listing flexibility.
- 3 sale attempts since 10y ago with the ask held roughly flat each time — persistent listings suggest the price (not the market) is what's stuck; bring a comps-based counter.
Questions for the listing agent
- What do current leases actually rent for vs. the listed asking? Can we see a recent rent roll and the last 12 months of T-12 income?
- What does the HOA fee cover, when was the last increase, and are there any pending special assessments or reserve-fund shortfalls?
- Is there a deadline driving the sale (1031 exchange, divorce, estate, relocation)? That informs how much negotiation room exists.
- Schools are A-rated — typically a magnet for longer-tenancy family renters. What's the average tenant stay here, and is there a school-zone premium baked into asking?
- The area grade is low — what's the realistic commute time and amenity access for the typical tenant pool here? Any planned neighborhood developments (good or bad) we should know about?
- What's the average days-on-market for RENTAL listings here right now (not sales)? A rising rental-DOM trend means longer vacancies and softer asking-rent achievability than the comps imply.
- What's the recent tenant-quality profile in this submarket — average credit score on applications, eviction rate, late-payment / NSF rate, and stable-employment percentage? A property-management company in the area should have these aggregated.
- How much new for-sale + rental construction is in the pipeline within 1–3 miles? Heavy new supply typically softens prices + rents 12–24 months out; constrained supply supports both.
Investment metrics
- 1% rule
- 0.65% ✗
- Cap rate
- 4.82%
- Cash-on-cash
- -5.27%
- DSCR
- 0.77
- GRM
- 12.9
CMA / ARV
- ARV (median comp)
- $404,493
- List price
- $349,900
- Delta
- -13.50%
- Verdict
- UNDERPRICED
- Comps
- 20 within 1.0 mi
Show comp detail 12 sales within ~0.75 mi
| Address | Dist | Beds/Ba | Sqft | Sold | Price | $/sf | Match |
|---|---|---|---|---|---|---|---|
| 4088 Del Mar Ln | 0.00mi | 4/3.0 | 2,740 (0%) | 0mo | $325,000 | $119 | 100 |
| 5778 Arlington Dr | 0.22mi | 4/2.5 | 2,764 (+1%) | 1mo | $350,000 | $127 | 85 |
| 4114 Spirea Dr | 0.20mi | 4/2.5 | 2,928 (+7%) | 2mo | $414,900 | $142 | 76 |
| 4011 Spirea Dr | 0.21mi | 4/2.5 | 3,056 (+12%) | 3mo | $406,900 | $133 | 67 |
| 5374 John Quincy Adams Ct | 0.48mi | 4/2.5 | 2,684 (-2%) | 6mo | $390,000 | $145 | 67 |
| 3610 Homestead Pl | 0.57mi | 5/2.5 (+1) | 2,787 (+2%) | 3mo | $369,900 | $133 | 61 |
| 5733 Yorktown Rd | 0.28mi | 4/2.5 | 2,350 (-14%) | 1mo | $349,900 | $149 | 60 |
| 5276 Oakbrook Dr | 0.64mi | 4/3.5 | 2,656 (-3%) | 6mo | $515,000 | $194 | 58 |
| 4104 Lotus St | 0.25mi | 5/2.5 (+1) | 3,115 (+14%) | 1mo | $415,000 | $133 | 58 |
| 5268 Oakbrook Dr | 0.60mi | 4/3.0 | 3,115 (+14%) | 2mo | $574,900 | $185 | 48 |
| 3581 Bartram Ln | 0.56mi | 3/3.5 (-1) | 2,472 (-10%) | 4mo | $375,000 | $152 | 47 |
| 5594 Beale St | 0.66mi | 5/2.5 (+1) | 2,971 (+8%) | 1mo | $375,000 | $126 | 47 |
Match score weights: distance 35% · size 25% · config 20% · recency 20%. Top-matched comps best support the ARV.
Projected returns pro-forma
-3.0% appreciation · 3.65% rent growth · sell at horizon
- IRR
- -24.7%
- Equity multiple
- 0.16×
- Total profit
- $-82,691
- Equity at exit
- $52,171
- IRR
- -18.8%
- Equity multiple
- -0.04×
- Total profit
- $-101,459
- Equity at exit
- $30,253
Cash invested: $97,972 (down + closing). Projections, not guarantees.
Landlord ↔ Tenant lean methodology
- Overall (STATE)
- 90 Strongly Landlord-Friendly
- State Indiana
- 90 Strongly Landlord-Friendly · R+11
- County
- — inherits STATE
- City
- — inherits STATE
ZIP-level market 46168
- Rents YoY
- 3.6%
- Active inventory
- 284
- Price-to-rent
- 12.9×
Monthly cashflow live
- Estimated rent
- $2,259 medium interval (Pro) →
- Mortgage (P&I)
- −$1,835
- Tax from tax record
- −$202 /mo · $2,420/yr
- Insurance
- −$146
- HOA
- −$32
- Vacancy / Maint / Mgmt
- −$474
- Net cashflow
- $-430
Break-even live
UW: 25.0% down · 7.5% · 30yr · 1.5% tax · 5.0% vac · 8.0% maint · 8.0% mgmt
Financing live
Cash to close
- Down payment
- $87,475
- Closing costs
- $10,497
- Reserves months
- —
- Total cash needed
- —
Loan-product check · same deal, 3 products live
Conventional
25% down · 7.5% · 30yr
- Down + closing
- —
- Monthly P&I
- —
- Monthly cashflow
- —
- DSCR
- —
- Eligible?
- —
Personal DTI + credit; lowest rate.
DSCR
20% down · 8.5% · 30yr
- Down + closing
- —
- Monthly P&I
- —
- Monthly cashflow
- —
- DSCR
- —
- Eligible?
- —
No personal income docs; deal must DSCR.
Hard money
10% down · 12.0% · 12mo
- Down + closing
- —
- Monthly P&I
- —
- Monthly cashflow
- —
- DSCR
- —
- Eligible?
- —
Short-term bridge; refi at stabilization.
Rent comps 3 comps
| Address | Beds | Baths | Sqft | Rent | $/sqft | DOM | Units | Dist |
|---|---|---|---|---|---|---|---|---|
| 5922 Juna Ave Unit 5922 Plainfield, IN | 4.0 | 3.5 | 2346 | $2,295 | $0.98 | 43d | 1 | 0.27mi |
| 5980 Lomita Ave Plainfield, IN | 3.0 | 2.5 | 1886 | $2,000 | $1.06 | 43d | 1 | 0.33mi |
| 269 N Vine St Plainfield, IN | 4.0 | 1.0 | 1794 | $1,625 | $0.91 | 43d | 1 | 1.23mi |
HOA detail
- Monthly dues
- $32 · $384/yr
Listing history 9 events
-
2026-05-04$349,900 Active 864-char remark
-
2026-01-17historical
-
2025-11-22price $349,900
-
2025-11-12$359,000 Active
-
2016-07-07soldstatus $200,000 Sold
Show marketing remark (408 chars)
Bright and spacious, 2 story home with 4 BD/3 FULL BATH in Paddock of Saratoga near parks & trails. Great Room is open thru to the Kitchen, featuring a large pantry. Master Suite includes a huge walk-in closet...All 4 Bedrooms have walk-in closets. Upstairs has a large loft. Enjoy the beautiful pond view. Fully fenced back yard. Extra space in garage for storage. WINDOWS GALORE...Let the Sun Shine in!
-
2016-06-23status Pending
Show marketing remark (408 chars)
Bright and spacious, 2 story home with 4 BD/3 FULL BATH in Paddock of Saratoga near parks & trails. Great Room is open thru to the Kitchen, featuring a large pantry. Master Suite includes a huge walk-in closet...All 4 Bedrooms have walk-in closets. Upstairs has a large loft. Enjoy the beautiful pond view. Fully fenced back yard. Extra space in garage for storage. WINDOWS GALORE...Let the Sun Shine in!
-
2016-05-27historical Active with Contingency
Show marketing remark (408 chars)
Bright and spacious, 2 story home with 4 BD/3 FULL BATH in Paddock of Saratoga near parks & trails. Great Room is open thru to the Kitchen, featuring a large pantry. Master Suite includes a huge walk-in closet...All 4 Bedrooms have walk-in closets. Upstairs has a large loft. Enjoy the beautiful pond view. Fully fenced back yard. Extra space in garage for storage. WINDOWS GALORE...Let the Sun Shine in!
-
2016-05-13price $204,900
Show marketing remark (408 chars)
Bright and spacious, 2 story home with 4 BD/3 FULL BATH in Paddock of Saratoga near parks & trails. Great Room is open thru to the Kitchen, featuring a large pantry. Master Suite includes a huge walk-in closet...All 4 Bedrooms have walk-in closets. Upstairs has a large loft. Enjoy the beautiful pond view. Fully fenced back yard. Extra space in garage for storage. WINDOWS GALORE...Let the Sun Shine in!
-
2016-04-15$207,900 Active
Show marketing remark (408 chars)
Bright and spacious, 2 story home with 4 BD/3 FULL BATH in Paddock of Saratoga near parks & trails. Great Room is open thru to the Kitchen, featuring a large pantry. Master Suite includes a huge walk-in closet...All 4 Bedrooms have walk-in closets. Upstairs has a large loft. Enjoy the beautiful pond view. Fully fenced back yard. Extra space in garage for storage. WINDOWS GALORE...Let the Sun Shine in!
ⓘ Source: listings_history table (triggers on properties + properties_extension) + one-shot
backfill from property_details.listing_events for pre-trigger history.
Tax reassessment forecast IN · Partial reset (capped growth)
- Current annual tax
- $2,420 · $202/mo
- Projected year-2 tax
- $2,697 · $225/mo
- Expected delta
- +$277/yr (+$23/mo · 11.5%)
ⓘ Screening estimate from a state-policy table — verify with the county assessor before closing.
Climate risk First Street
- Flood 1/10 Low FEMA zone X (unshaded) · 0% chance over 30 yrs
- Wildfire 1/10 Low
- Heat 4/10 Moderate 7 d/yr ≥101°F today · 19 d/yr by 30 yrs out
- Wind 2/10 Low 100% chance of damaging wind over 30 yrs
- Air quality 3/10 Moderate 2 unhealthy d/yr today · 3 by 30 yrs out
Nearby sold comps map
Loading sold comps map…
Walkable amenities ~0.75 mi
Loading nearby amenities…
Taxation est. · year 1
- Rental income
- $27,104
- − Mortgage interest
- −$19,600
- − Property taxes
- −$2,420
- − Insurance
- −$1,750
- − Repairs & maintenance
- −$2,168
- − Management
- −$2,168
- − HOA
- −$384
- − Depreciation
- −$10,179
- Taxable loss
- −$11,565
- Est. tax savings @ 24.0%
- +$2,776
- After-tax cash flow
- $-2,385/yr
For passive investors: Depreciation is non-cash, so a rental often shows a tax loss while cash-flowing — sheltering income. Rental losses are passive: they offset passive income freely, and up to $25,000/yr can offset ordinary (W-2) income if you actively participate and your MAGI is under $100k (phasing out to $0 by $150k); unused losses carry forward. On sale, claimed depreciation is recaptured at up to 25%, and gains may owe capital-gains tax (a 1031 exchange can defer both). Figures are a year-1 estimate at your 24.0% rate — not tax advice; consult a CPA.
Schools (NCES district)
- District
- Plainfield Community School Corporation
- NCES district ID
- 1808970
- Math proficiency
- 62% ▼ -8.00%
- Reading proficiency
- 65% ▼ -8.00%
- Median HH income
- $58,531
- Composite
- 54.79/100
- National rank
- #1315
- State rank
- #11 of 301 in IN
Livability — Plainfield
- Score
- 74/100
- State rank
- #69
- US rank
- #4418
Category grades
Schools grade is shown separately in the Schools card above.
Census & demographics
- Census place
- Plainfield, IN
- County
- Hendricks County · 143,373 people
- City population
- 38,826
- Metro
- Indianapolis-Carmel-Anderson, IN
- Population (ZIP)
- 38,826
- Household income
- $90,000
- Rent vs Own
- Severe rent burden
- 1029.0
Population outlook (Hendricks County) Hauer SSP2
- Today (2025)
- 187,418 people
- By 2030
- 201,494 · +7.5%
- By 2040
- 228,487 · +21.9%
- By 2050
- 253,068 · +35.0%
- By 2075
- 308,920 · +64.8%
- By 2100
- 336,510 · +79.6%
Race, ethnicity, and origin ACS 2023
- Neighborhood character
- Predominantly White (76%)
- Race & ethnicity
- White 76% Black 9% Two or more races 8% Hispanic / Latino 6% Asian 4%
- Hispanic origin (detail)
- Mexican 3%
- Common ancestry
- Italian 2% Lithuanian 1% Romanian 1%
- Foreign-born
- 7% · Canada, China
- Languages at home
- 90% English-only · Spanish 4% Other Indo-European 3% French/Haitian/Cajun 1%
Political lean MEDSL · Hendricks
- 2024 margin
- Strong R (+21.5) · D 38.4% · R 59.9% · Other 1.7%
- 2008→2024 swing
- +1.9pp toward D · 2008: -23.4pp · 2024: -21.5pp
- All cycles
- 2024: R+21.5 2020: R+23.9 2016: R+34.2 2012: R+34.9 2008: R+23.4
Not yet ingested
- Civics
- —
Market trends
- HPI YoY
- ▼ -136.23%
- Current HPI
- 205.5963
- Rent YoY
- ▲ 3.65%
- Metro
- Indianapolis-Carmel-Anderson, IN
- State GDP YoY
- ▲ 2.90%
- F500 in state
- 18
Industry mix (Fortune 500 HQ in IN)
| Industry | F500 HQs | Revenue |
|---|---|---|
| Industrial Machinery | 2 | $37B |
|
||
| Healthcare | 1 | $177B |
|
||
| Pharmaceuticals | 1 | $45B |
|
||
| Metals / Steel | 1 | $18B |
|
||
| Agriculture | 1 | $17B |
|
||
| Packaging | 1 | $12B |
|
||
Price history
+56.3% since first listed11 events — show timeline
- 2026-06-12 Sold (MLS) $325,000 MIBOR as Distributed by MLS Grid
- 2026-05-25 Pending — MIBOR as Distributed by MLS Grid
- 2026-05-04 Listed $349,900 MIBOR as Distributed by MLS Grid
- 2026-01-17 Listing Removed — MIBOR as Distributed by MLS Grid
- 2025-11-22 Price Changed $349,900 MIBOR as Distributed by MLS Grid
- 2025-11-12 Listed $359,000 MIBOR as Distributed by MLS Grid
- 2016-07-07 Sold (MLS) $200,000 MIBOR as Distributed by MLS Grid
- 2016-06-23 Pending — MIBOR as Distributed by MLS Grid
- 2016-05-27 Contingent — MIBOR as Distributed by MLS Grid
- 2016-05-13 Price Changed $204,900 MIBOR as Distributed by MLS Grid
- 2016-04-15 Listed $207,900 MIBOR as Distributed by MLS Grid
Property tax history
+3.4%/yrLatest (2025): $2,420 · +6.4% YoY. Source: county tax records.
Cash-flow waterfall
monthlySold comps — $/sqft
last 12 mo · ≤1 miLoading sold comps…