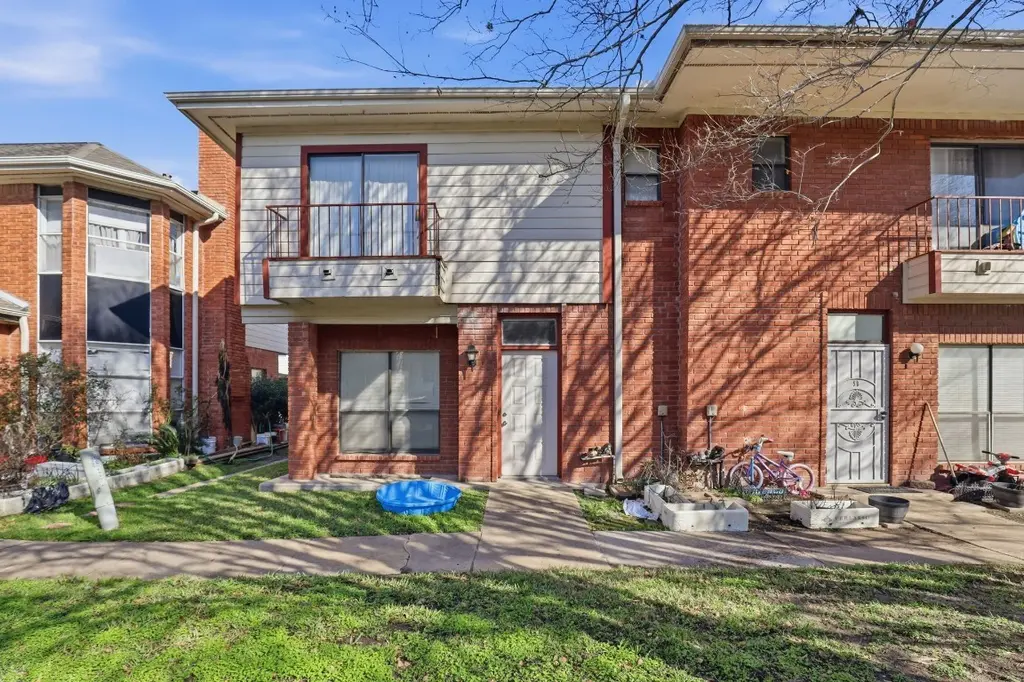
8320 Wild Rose St Unit 4B · Houston, TX
Flood risk 3/10 · Minor
- FEMA flood zone
- X (unshaded)
- Chance of flooding over 30 yrs
- 0.2%
- Est. flood insurance / yr
- $507 – $1,088
Fire risk 1/10 · Minimal
- Est. fire insurance / yr
- $1,222 – $2,270
Heat risk 9/10 · Severe
- Hot days now (above 110°F)
- 7 days/yr
- Hot days in 30 yrs
- 23 days/yr
Wind risk 9/10 · Severe
- Chance of severe wind over 30 yrs
- 99.0%
Air-quality risk 2/10 · Minimal
- Unhealthy air days now
- 2 days/yr
- Unhealthy air days in 30 yrs
- 2 days/yr
Risk factors via First Street. Map © Google.
Why this score? — see what drove the C- grade
The composite is a weighted blend of 9 inputs, each scored 0–100. Each bar is that input's sub-score; the figure is the points it added to the 100-point composite (weight × sub-score).
- ARV discount +15.0/15.0
- Cash flow +12.1/30.0
- 1% rule +9.8/10.0
- Livability +3.7/5.0
- DSCR +3.6/10.0
- Rent growth +3.0/5.0
- Condition / age +2.5/5.0
- Schools +2.1/10.0
- Appreciation +0.0/10.0
$89,900
🖨 Deal sheet 📄 Offer letter ✓ Due diligence
Listing remarks MLS
Welcome home to 8320 Wild Rose St #4B. Its a 2 story townhouse. Ground floor is tiled throughout. Spacious living area with a wood burning fireplace. Kitchen features laminate countertops, white appliances and cabinet space. Off the kitchen is a dining/breakfast area. A top the stairwell you will find a bedroom with ceiling fan and access to the bath. This bedroom has a utility closet with a stackable washer/dryer which will convey with the unit. Primary bedroom which host a large walk in closet with shelving. Great location and quick access to both Hwy 6 & the Westpark Tollway. Property is being sold as-is. Schedule your showing now!
Key facts
- Utility closet
- Laminate countertops
- Large walk in closet
Tags
Neighborhood map
What this means for you Summary
Snapshot
- This is a 2-bed/2.5-bath townhouse listed at $90k.
Deal economics
- At list price, monthly cash flow is $-20 ($-239/yr) — negative.
- To cash-flow at today's rent, offer at most $86k (3.9% below list).
- Meets the 1% rule at list price ($1k rent vs $90k).
- Recommended offer: $82k (9.0% below list) — sets the bar for market timing.
- Cap rate 6.0% vs local median 3.2% in Houston — top-decile yield for the area; either an underpriced asset or a hidden risk that comps aren't pricing in. Stress-test before assuming the spread holds.
Location & tenants
- Location reads 74/100 on livability (#184 in TX, #4,771 nationally) — a middle-class / working-renter tenant base. Strengths: amenities A+, cost of living A+, housing A+; Watch: schools D, crime F.
- Alief ISD (urban): math 23% / reading 28% proficiency, ranked #717 of 826 in TX (top 87%) — low school quality limits family demand, transient renter base, plan for 1-2y turnover; 74% free/reduced lunch — lower-income household profile, screen leases tightly.
- Market conditions: Rents rising (+1.9%/yr); 262 active listings in the ZIP; 36 comparable units currently listed for rent nearby; rentals at typical pace (median 22d on market — plan ~3-4 weeks tenant-placement turnaround); 29,883 units permitted in Harris County in 2024 (8,621 in 5+ unit buildings).
Forward outlook
- Local home prices are declining (-3.0%/yr); year-one equity from $622 of loan paydown is wiped out by about $3k of value loss. Plan a longer hold.
- Harris County population projected at +47% by 2050 — long-run rental-demand tailwind backs the buy-and-hold thesis.
Negotiation context
- It's been on market 119 days — a 9% lower offer ($82k) is reasonable based on typical stale-listing flexibility.
- 3 sale attempts since 21y ago; this cycle's ask has dropped $10k (10%) from the opening price — seller is motivated, your offer sets the floor, not the list.
Risks & watch-outs
- Watch-outs: property tax is 3.2% of price; HOA is 24% of rent.
- Climate carrying-cost: severe wind risk, 99% chance of damaging wind over 30y; extreme-heat days projected 7→23/yr by 2055 (HVAC capex compounding) — expect insurance premiums to compound above CPI over the hold.
Questions for the listing agent
- What do current leases actually rent for vs. the listed asking? Can we see a recent rent roll and the last 12 months of T-12 income?
- It's been on market 119 days. Have you received any prior offers? Is the seller open to a 9% concession, seller financing, or rate buy-down credit?
- Property tax is high relative to price — has the assessment been appealed recently, and will the sale trigger a re-assessment?
- What does the HOA fee cover, when was the last increase, and are there any pending special assessments or reserve-fund shortfalls?
- Why hasn't it sold? Are there any deal-killer items the seller is aware of (foundation, flood, title, zoning, code violations)?
- Is there a deadline driving the sale (1031 exchange, divorce, estate, relocation)? That informs how much negotiation room exists.
- Schools are D-rated, which usually means shorter tenancies and higher turnover. Who's the typical renter profile here, and what's been the actual vacancy rate?
- Crime grade is F in this area — have there been break-ins, vandalism, or insurance claims at this property in the last 3 years? What carrier currently insures it and at what premium?
- What's the average days-on-market for RENTAL listings here right now (not sales)? A rising rental-DOM trend means longer vacancies and softer asking-rent achievability than the comps imply.
- What's the recent tenant-quality profile in this submarket — average credit score on applications, eviction rate, late-payment / NSF rate, and stable-employment percentage? A property-management company in the area should have these aggregated.
- How much new for-sale + rental construction is in the pipeline within 1–3 miles? Heavy new supply typically softens prices + rents 12–24 months out; constrained supply supports both.
Investment metrics
- 1% rule
- 1.48% ✓
- Cap rate
- 6.03%
- Cash-on-cash
- -0.95%
- DSCR
- 0.96
- GRM
- 5.6
CMA / ARV
- ARV (median comp)
- $156,460
- List price
- $89,900
- Delta
- -42.54%
- Verdict
- UNDERPRICED
- Comps
- 20 within 1.0 mi
Show comp detail 1 sale within ~0.75 mi
| Address | Dist | Beds/Ba | Sqft | Sold | Price | $/sf | Match |
|---|---|---|---|---|---|---|---|
| 8320 Wild Rose St Unit 2B | 0.00mi | 2/1.5 | 1,043 (-13%) | 12mo | $125,000 | $120 | 64 |
Match score weights: distance 35% · size 25% · config 20% · recency 20%. Top-matched comps best support the ARV.
Projected returns pro-forma
-3.0% appreciation · 1.89% rent growth · sell at horizon
- IRR
- -19.6%
- Equity multiple
- 0.32×
- Total profit
- $-17,006
- Equity at exit
- $13,404
- IRR
- -16.1%
- Equity multiple
- 0.16×
- Total profit
- $-21,130
- Equity at exit
- $7,773
Cash invested: $25,172 (down + closing). Projections, not guarantees.
Landlord ↔ Tenant lean methodology
- Overall (STATE)
- 87 Strongly Landlord-Friendly
- State Texas
- 87 Strongly Landlord-Friendly · R+5
- County
- — inherits STATE
- City
- — inherits STATE
ZIP-level market 77083
- Home prices YoY
- -19.3%
- Rents YoY
- 1.9%
- Active inventory
- 262
- Price-to-rent
- 5.6×
Monthly cashflow live
- Estimated rent
- $1,329 high interval (Pro) →
- Mortgage (P&I)
- −$471
- Tax from tax record
- −$241 /mo · $2,892/yr
- Insurance
- −$37
- HOA
- −$320
- Vacancy / Maint / Mgmt
- −$279
- Net cashflow
- $-20
Break-even live
UW: 25.0% down · 7.5% · 30yr · 1.5% tax · 5.0% vac · 8.0% maint · 8.0% mgmt
Financing live
Cash to close
- Down payment
- $22,475
- Closing costs
- $2,697
- Reserves months
- —
- Total cash needed
- —
Loan-product check · same deal, 3 products live
Conventional
25% down · 7.5% · 30yr
- Down + closing
- —
- Monthly P&I
- —
- Monthly cashflow
- —
- DSCR
- —
- Eligible?
- —
Personal DTI + credit; lowest rate.
DSCR
20% down · 8.5% · 30yr
- Down + closing
- —
- Monthly P&I
- —
- Monthly cashflow
- —
- DSCR
- —
- Eligible?
- —
No personal income docs; deal must DSCR.
Hard money
10% down · 12.0% · 12mo
- Down + closing
- —
- Monthly P&I
- —
- Monthly cashflow
- —
- DSCR
- —
- Eligible?
- —
Short-term bridge; refi at stabilization.
Rent comps 36 comps
| Address | Beds | Baths | Sqft | Rent | $/sqft | DOM | Units | Dist |
|---|---|---|---|---|---|---|---|---|
| 13150 Bissonnet St Unit 2162 Houston, TX | 2.0 | 2.0 | 850 | $1,089 | $1.28 | 5d | 1 | 0.88mi |
| 13150 Bissonnet St Unit 13171 Houston, TX | 1.0 | 1.0 | 750 | $869 | $1.16 | 12d | 1 | 0.88mi |
| 13150 Bissonnet St Unit 422 Houston, TX | 2.0 | 2.0 | 850 | $1,089 | $1.28 | 7d | 1 | 0.88mi |
| 13150 Bissonnet St Unit 1162 Houston, TX | 1.0 | 1.0 | 750 | $834 | $1.11 | 7d | 1 | 0.88mi |
| 13150 Bissonnet St Unit 13207 Houston, TX | 2.0 | 2.0 | 850 | $1,081 | $1.27 | 3d | 1 | 0.88mi |
| 13150 Bissonnet St Unit 13224 Houston, TX | 1.0 | 1.0 | 750 | $831 | $1.11 | 3d | 1 | 0.88mi |
| 13150 Bissonnet St Unit 13201 Houston, TX | 1.0 | 1.0 | 750 | $864 | $1.15 | 43d | 1 | 0.88mi |
| 13156 Bissonnet St Houston, TX | 2.0 | 2.0 | 950 | $1,149 | $1.21 | 43d | 1 | 0.90mi |
| 13150 Bissonnet St Houston, TX | 1.0 | 1.0 | 750 | $823 | $1.10 | 12d | 1 | 0.92mi |
| 13150 Bissonnet St Unit 2047 Houston, TX | 2.0 | 2.0 | 850 | $1,124 | $1.32 | 11d | 1 | 0.95mi |
| 14501 Empanada Dr Houston, TX | 1.0–3.0 | 1.0–2.0 | 944 | $1,174 | $1.24 | 2d | 73 | 0.99mi |
| 7119 Brendam Ln Houston, TX | 2.0 | 1.5 | 1231 | $1,400 | $1.14 | 4d | 1 | 1.05mi |
| 13009 Greenway Chase Ct Houston, TX | 2.0 | 3.0 | 1422 | $1,350 | $0.95 | 43d | 1 | 1.05mi |
| 13009 Greenway Chase Ct #3009 Houston, TX | 2.0 | 2.5 | 1422 | $1,350 | $0.95 | 43d | 1 | 1.05mi |
| 13004 Greenway Chase Ct Houston, TX | 2.0 | 2.0 | 1332 | $1,500 | $1.13 | 43d | 1 | 1.08mi |
| 13034 Leader St Houston, TX | 2.0 | 2.0 | 1241 | $1,400 | $1.13 | 24d | 1 | 1.08mi |
| 9402 Synott Rd Unit 9429 Houston, TX | 2.0 | 2.0 | 825 | $1,092 | $1.32 | 3d | 1 | 1.09mi |
| 9402 Synott Rd Unit 421 Houston, TX | 2.0 | 2.0 | 825 | $1,100 | $1.33 | 7d | 1 | 1.09mi |
| 6628 Synott Rd Houston, TX | 2.0 | 2.0 | 889 | $1,260 | $1.42 | 22d | 1 | 1.09mi |
| 14409 Pavilion Pt Houston, TX | 2.0 | 2.0 | 1040 | $1,099 | $1.06 | 24d | 1 | 1.11mi |
| 14409 Pavilion Pt Houston, TX | 1.0 | 1.0 | 827 | $879 | $1.06 | 43d | 1 | 1.11mi |
| 14409 Pavilion Pt Houston, TX | 1.0 | 1.0 | 827 | $879 | $1.06 | 12d | 1 | 1.11mi |
| 14507 Empanada Dr Unit 2206 Houston, TX | 2.0 | 2.0 | 977 | $1,010 | $1.03 | 19d | 1 | 1.16mi |
| 14507 Empanada Dr Unit 2206 Houston, TX | 2.0 | 2.0 | 977 | $1,010 | $1.03 | 22d | 1 | 1.16mi |
| 14507 Empanada Dr Unit 2206 Houston, TX | 3.0 | 2.0 | 1295 | $1,235 | $0.95 | 43d | 1 | 1.16mi |
| 6843 Greenway Chase St Houston, TX | 3.0 | 3.0 | 1422 | $2,200 | $1.55 | 43d | 1 | 1.17mi |
| 6634 Synott Rd Houston, TX | 2.0 | 2.0 | 889 | $1,073 | $1.21 | 43d | 1 | 1.18mi |
| 6975 Westbranch Dr Houston, TX | 3.0 | 2.0 | 1287 | $1,425 | $1.11 | 43d | 1 | 1.24mi |
| 12710 Leader St Houston, TX | 2.0 | 2.0 | 1107 | $1,200 | $1.08 | 43d | 1 | 1.33mi |
| 12701 Leader St Houston, TX | 2.0 | 1.0 | 1000 | $1,475 | $1.48 | 12d | 1 | 1.37mi |
| 14405 Rio Bonito Rd Houston, TX | 1.0–2.0 | 1.0–2.0 | 823 | $1,402 | $1.70 | 2d | 13 | 1.37mi |
| 11-18 Rio Bonito Rd Houston, TX | 2.0 | 1.0 | 930 | $1,162 | $1.25 | 24d | 1 | 1.39mi |
| 11-18 Rio Bonito Rd Houston, TX | 3.0 | 2.0 | 1053 | $1,316 | $1.25 | 43d | 1 | 1.39mi |
| 11-18 Rio Bonito Rd Houston, TX | 3.0 | 2.0 | 1053 | $1,316 | $1.25 | 22d | 1 | 1.39mi |
| 12510 Newbrook Dr #223 Houston, TX | 2.0 | 1.5 | 1131 | $1,585 | $1.40 | 43d | 1 | 1.45mi |
| 14100 Rio Bonito Rd Houston, TX | 2.0–4.0 | 1.0–2.5 | 1084 | $1,305 | $1.20 | 2d | 11 | 1.48mi |
HOA detail
- Monthly dues
- $320 · $3,840/yr
Listing history 21 events
-
2026-06-18days on market $89,900 Active 119 DOM
-
2026-06-17days on market $89,900 Active 118 DOM
-
2026-06-16pricedays on market $89,900 Active 117 DOM
-
2026-06-15days on market $94,500 Active 116 DOM
-
2026-06-13days on market $94,500 Active 114 DOM
-
2026-06-09days on market $94,500 Active 110 DOM
-
2026-06-08days on market $94,500 Active 109 DOM
-
2026-06-07days on market $94,500 Active 108 DOM
-
2026-06-04days on market $94,500 Active 105 DOM
-
2026-06-03days on market $94,500 Active 104 DOM
-
2026-06-02days on market $94,500 Active 103 DOM
-
2026-06-01days on market $94,500 Active 102 DOM
-
2026-05-31days on market $94,500 Active 101 DOM
-
2026-03-11price $94,500 646-char remark
Show marketing remark (646 chars)
Welcome home to 8320 Wild Rose St #4B. Its a 2 story townhouse. Ground floor is tiled throughout. Spacious living area with a wood burning fireplace. Kitchen features laminate countertops, white appliances and cabinet space. Off the kitchen is a dining/breakfast area. A top the stairwell you will find a bedroom with ceiling fan and access to the bath. This bedroom has a utility closet with a stackable washer/dryer which will convey with the unit. Primary bedroom which host a large walk in closet with shelving. Great location and quick access to both Hwy 6 & the Westpark Tollway. Property is being sold as-is. Schedule your showing now!
-
2026-02-19$99,500 Active 646-char remark
Show marketing remark (646 chars)
Welcome home to 8320 Wild Rose St #4B. Its a 2 story townhouse. Ground floor is tiled throughout. Spacious living area with a wood burning fireplace. Kitchen features laminate countertops, white appliances and cabinet space. Off the kitchen is a dining/breakfast area. A top the stairwell you will find a bedroom with ceiling fan and access to the bath. This bedroom has a utility closet with a stackable washer/dryer which will convey with the unit. Primary bedroom which host a large walk in closet with shelving. Great location and quick access to both Hwy 6 & the Westpark Tollway. Property is being sold as-is. Schedule your showing now!
-
2006-04-06soldstatus
-
2005-09-12historical
-
2005-09-04$61,000
-
2005-08-08historical
-
2005-02-08$61,900
-
1993-08-19soldstatus
ⓘ Source: listings_history table (triggers on properties + properties_extension) + one-shot
backfill from property_details.listing_events for pre-trigger history.
Tax reassessment forecast TX · Resets to sale price
- Current annual tax
- $2,892 · $241/mo
- Projected year-2 tax
- $2,892 · $241/mo
- Expected delta
- $0/yr ($0/mo · 0.0%)
ⓘ Screening estimate from a state-policy table — verify with the county assessor before closing.
Climate risk First Street
- Flood 3/10 Moderate FEMA zone X (unshaded) · 20% chance over 30 yrs
- Wildfire 1/10 Low
- Heat 9/10 Extreme 7 d/yr ≥110°F today · 23 d/yr by 30 yrs out
- Wind 9/10 Extreme 99% chance of damaging wind over 30 yrs
- Air quality 2/10 Low 2 unhealthy d/yr today · 2 by 30 yrs out
Nearby sold comps map
Loading sold comps map…
Walkable amenities ~0.75 mi
Loading nearby amenities…
Taxation est. · year 1
- Rental income
- $15,950
- − Mortgage interest
- −$5,036
- − Property taxes
- −$2,892
- − Insurance
- −$450
- − Repairs & maintenance
- −$1,276
- − Management
- −$1,276
- − HOA
- −$3,840
- − Depreciation
- −$2,615
- Taxable loss
- −$1,435
- Est. tax savings @ 24.0%
- +$344
- After-tax cash flow
- $106/yr
For passive investors: Depreciation is non-cash, so a rental often shows a tax loss while cash-flowing — sheltering income. Rental losses are passive: they offset passive income freely, and up to $25,000/yr can offset ordinary (W-2) income if you actively participate and your MAGI is under $100k (phasing out to $0 by $150k); unused losses carry forward. On sale, claimed depreciation is recaptured at up to 25%, and gains may owe capital-gains tax (a 1031 exchange can defer both). Figures are a year-1 estimate at your 24.0% rate — not tax advice; consult a CPA.
Schools (NCES district)
- District
- Alief ISD
- NCES district ID
- 4807830
- Math proficiency
- 23% ▼ -19.00%
- Reading proficiency
- 28% ▼ -8.00%
- Median HH income
- $37,775
- Composite
- 21.29/100
- National rank
- #8391
- State rank
- #717 of 826 in TX
Livability — Houston
- Score
- 74/100
- State rank
- #184
- US rank
- #4771
Category grades
Schools grade is shown separately in the Schools card above.
Census & demographics
- County
- Harris County · 4,702,590 people
- City population
- 3,226,434
- Metro
- Houston-The Woodlands-Sugar Land, TX
- Population (ZIP)
- 73,230
- Household income
- $64,418
- Rent vs Own
- Severe rent burden
- 2410.0
Population outlook (Harris County) Hauer SSP2
- Today (2025)
- 5,571,493 people
- By 2030
- 6,089,821 · +9.3%
- By 2040
- 7,142,806 · +28.2%
- By 2050
- 8,185,864 · +46.9%
- By 2075
- 10,574,329 · +89.8%
- By 2100
- 12,109,958 · +117.4%
Race, ethnicity, and origin ACS 2023
- Neighborhood character
- Highly diverse neighborhood (Simpson 0.72)
- Race & ethnicity
- Hispanic / Latino 35% Black 30% Asian 23% Two or more races 14% White 8%
- Hispanic origin (detail)
- Mexican 16% Puerto Rican 1% Cuban 1%
- Foreign-born
- 47% · Canada, Vietnam, China
- Languages at home
- 38% English-only · Spanish 29% Vietnamese 11% Other Indo-European 6%
Political lean MEDSL · Harris
- 2024 margin
- Lean D (+5.5) · D 52.0% · R 46.4% · Other 1.6%
- 2008→2024 swing
- +3.9pp toward D · 2008: 1.6pp · 2024: 5.5pp
- All cycles
- 2024: D+5.5 2020: D+13.3 2016: D+12.4 2012: D+0.1 2008: D+1.6
Not yet ingested
- Civics
- —
Market trends
- HPI YoY
- ▼ -65.00%
- Current HPI
- 271.2157
- Rent YoY
- ▲ 1.89%
- Metro
- Houston-The Woodlands-Sugar Land, TX
- State GDP YoY
- ▲ 3.95%
- F500 in state
- 110
Industry mix (Fortune 500 HQ in TX)
| Industry | F500 HQs | Revenue |
|---|---|---|
| Energy | 16 | $1,198B |
|
||
| Technology | 5 | $198B |
|
||
| Engineering / Construction | 4 | $72B |
|
||
| Energy Services | 3 | $60B |
|
||
| Utilities | 3 | $41B |
|
||
| Healthcare | 2 | $330B |
|
||
Price history
+52.7% since first listed8 events — show timeline
- 2026-03-11 Price Changed $94,500 HARMLS
- 2026-02-19 Listed $99,500 HARMLS
- 2006-04-06 Sold (Public Records) — Public Records
- 2005-09-12 Listing Removed — HARMLS
- 2005-09-04 Listed $61,000 HARMLS
- 2005-08-08 Listing Removed — HARMLS
- 2005-02-08 Listed $61,900 HARMLS
- 1993-08-19 Sold (Public Records) — Public Records
Property tax history
+1.5%/yrLatest (2025): $2,892 · +4.0% YoY. Source: county tax records.
Cash-flow waterfall
monthlySold comps — $/sqft
last 12 mo · ≤1 miLoading sold comps…