16175 John Morris Road Site 25 #25 · Iona, FL
Flood risk No data
- FEMA flood zone
- —
- Chance of flooding over 30 yrs
- —
- Est. flood insurance / yr
- —
Fire risk No data
- Est. fire insurance / yr
- —
Heat risk No data
- Hot days now (above threshold)
- —
- Hot days in 30 yrs
- —
Wind risk No data
- Chance of severe wind over 30 yrs
- —
Air-quality risk No data
- Unhealthy air days now
- —
- Unhealthy air days in 30 yrs
- —
Risk factors via First Street. Map © Google.
Why this score? — see what drove the D+ grade
The composite is a weighted blend of 9 inputs, each scored 0–100. Each bar is that input's sub-score; the figure is the points it added to the 100-point composite (weight × sub-score).
- Cash flow +17.3/30.0
- ARV discount +7.5/15.0
- DSCR +5.4/10.0
- 1% rule +4.7/10.0
- Schools +4.1/10.0
- Condition / age +4.0/5.0
- Livability +3.6/5.0
- Rent growth +2.2/5.0
- Appreciation +0.0/10.0
$136,995
🖨 Deal sheet 📄 Offer letter ✓ Due diligence
Listing remarks
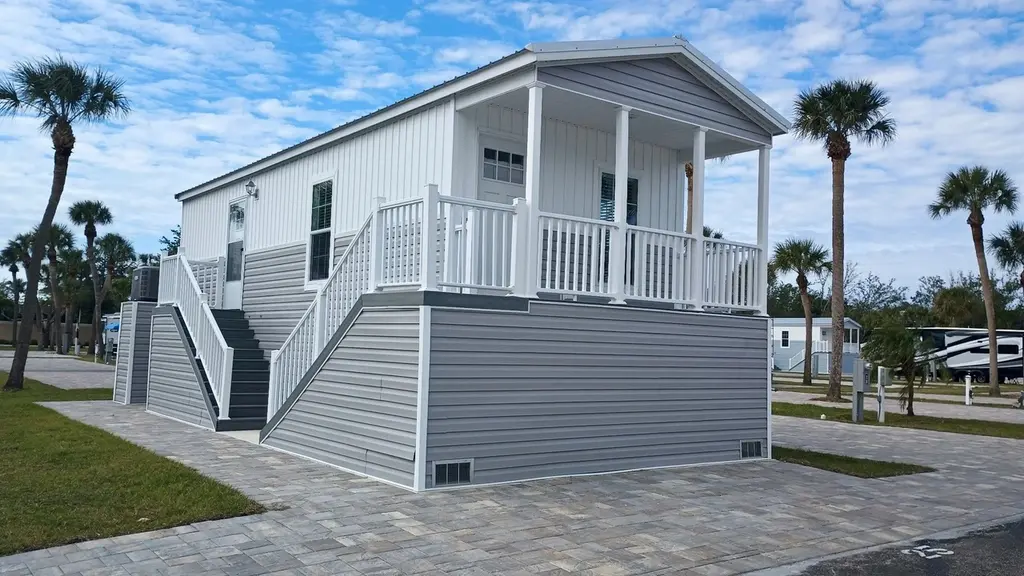
Welcome to your perfect beachside escape! This cozy 1-bedroom, 1-bath home is located just a few miles away from beautiful Sanibel Island, offering the ideal combination of comfort, convenience, and coastal living. Whether you're enjoying a relaxing day on the sand or exploring the vibrant nearby shopping and dining options, this home puts everything you need right at your doorstep. Step outside to enjoy the community amenities and take advantage of the all-age-friendly environment. It's an ideal place for a peaceful lifestyle near the beach.
Key facts
- Built 2026
- Listed 75 days
Property features AI
Finance
- Other: Living area approximately 490 (unit of measure implied); Address: 16175 John Morris Road Site 25 #25, Fort Myers, FL 33908
- Financial info: List price: $136,995
- HOA & community: HOA/community fee details not provided
Exterior
- Parking: Parking details not provided
- Security: Security details not provided
- Utilities: Utility details not provided
- Home design: Spec home; Single-story (site/unit address indicates manufactured/mobile site)
- Construction: Construction year not provided; Construction materials and roof not provided; Foundation details not provided
- Exterior features: Property details limited; parking and exterior specifics not provided
Interior
- Kitchen: Included appliances not specified
- Bedrooms: One bedroom
- Flooring: Flooring details not provided
- Bathrooms: One full bathroom
- Heating & cooling: HVAC details not provided
- Interior features: Open floor plan (studio-style living)
- Laundry & utility: Laundry details not provided
Neighborhood map
What this means for you Summary
Snapshot
- This is a 1-bed/1.0-bath manufactured listed at $137k. Condition is rated good.
Deal economics
- At list price, monthly cash flow is $101 ($1k/yr) — positive.
- The deal already cash-flows at list — no discount required.
- To meet the 1% rule (rent ≥ 1% of price), the offer needs to be $133k (3.2% below list).
- Recommended offer: $129k (6.0% below list) — sets the bar for market timing.
- Cap rate 7.2% vs local median 2.1% in Iona — top-decile yield for the area; either an underpriced asset or a hidden risk that comps aren't pricing in. Stress-test before assuming the spread holds.
Location & tenants
- Location reads 72/100 on livability (#359 in FL) — a middle-class / working-renter tenant base. Strengths: crime A+, housing A, health & safety A; Watch: schools D-, amenities F, commute F.
- Lee (suburban): math 47% / reading 50% proficiency, ranked #42 of 73 in FL (top 58%) — families likely to look elsewhere, expect single-tenant / working-renter base with shorter leases.
- Market conditions: Rents soft (-1.2%/yr); 1244 active listings in the ZIP; solid renter incomes; 15,411 units permitted in Lee County in 2024 (4,686 in 5+ unit buildings).
Forward outlook
- Local home prices are declining (-3.0%/yr); year-one equity from $947 of loan paydown is wiped out by about $4k of value loss. Plan a longer hold.
- Lee County population projected at +44% by 2050 — long-run rental-demand tailwind backs the buy-and-hold thesis.
Negotiation context
- It's been on market 75 days — a 6% lower offer ($129k) is reasonable based on typical stale-listing flexibility.
Questions for the listing agent
- It's been on market 75 days. Have you received any prior offers? Is the seller open to a 6% concession, seller financing, or rate buy-down credit?
- Why hasn't it sold? Are there any deal-killer items the seller is aware of (foundation, flood, title, zoning, code violations)?
- Is there a deadline driving the sale (1031 exchange, divorce, estate, relocation)? That informs how much negotiation room exists.
- Schools are D-rated, which usually means shorter tenancies and higher turnover. Who's the typical renter profile here, and what's been the actual vacancy rate?
- The area grade is low — what's the realistic commute time and amenity access for the typical tenant pool here? Any planned neighborhood developments (good or bad) we should know about?
- What's the average days-on-market for RENTAL listings here right now (not sales)? A rising rental-DOM trend means longer vacancies and softer asking-rent achievability than the comps imply.
- What's the recent tenant-quality profile in this submarket — average credit score on applications, eviction rate, late-payment / NSF rate, and stable-employment percentage? A property-management company in the area should have these aggregated.
- How much new for-sale + rental construction is in the pipeline within 1–3 miles? Heavy new supply typically softens prices + rents 12–24 months out; constrained supply supports both.
Investment metrics
- 1% rule
- 0.97% ✗
- Cap rate
- 7.18%
- Cash-on-cash
- 3.17%
- DSCR
- 1.14
- GRM
- 8.6
CMA / ARV
No comps found within radius.
Projected returns pro-forma
-3.0% appreciation · 0.0% rent growth · sell at horizon
- IRR
- -14.7%
- Equity multiple
- 0.49×
- Total profit
- $-19,617
- Equity at exit
- $20,426
- IRR
- -12.0%
- Equity multiple
- 0.38×
- Total profit
- $-23,720
- Equity at exit
- $11,845
Cash invested: $38,359 (down + closing). Projections, not guarantees.
Landlord ↔ Tenant lean methodology
- Overall (STATE)
- 87 Strongly Landlord-Friendly
- State Florida
- 87 Strongly Landlord-Friendly · R+3
- County
- — inherits STATE
- City
- — inherits STATE
ZIP-level market 33908
- Home prices YoY
- -32.8%
- Rents YoY
- -1.2%
- Active inventory
- 1244
- Price-to-rent
- 8.6×
Monthly cashflow live
- Estimated rent
- $1,327 medium interval (Pro) →
- Mortgage (P&I)
- −$718
- Tax est. 1.5%
- −$171 /mo · $2,055/yr
- Insurance
- −$57
- HOA
- −$0
- Vacancy / Maint / Mgmt
- −$279
- Net cashflow
- $101
Break-even live
UW: 25.0% down · 7.5% · 30yr · 1.5% tax · 5.0% vac · 8.0% maint · 8.0% mgmt
Financing live
Cash to close
- Down payment
- $34,249
- Closing costs
- $4,110
- Reserves months
- —
- Total cash needed
- —
Loan-product check · same deal, 3 products live
Conventional
25% down · 7.5% · 30yr
- Down + closing
- —
- Monthly P&I
- —
- Monthly cashflow
- —
- DSCR
- —
- Eligible?
- —
Personal DTI + credit; lowest rate.
DSCR
20% down · 8.5% · 30yr
- Down + closing
- —
- Monthly P&I
- —
- Monthly cashflow
- —
- DSCR
- —
- Eligible?
- —
No personal income docs; deal must DSCR.
Hard money
10% down · 12.0% · 12mo
- Down + closing
- —
- Monthly P&I
- —
- Monthly cashflow
- —
- DSCR
- —
- Eligible?
- —
Short-term bridge; refi at stabilization.
Listing history 8 events
-
2026-06-17days on market $136,995 Active 75 DOM
-
2026-06-16days on market $136,995 Active 74 DOM
-
2026-06-16days on market $136,995 Active 73 DOM
-
2026-06-13days on market $136,995 Active 71 DOM
-
2026-06-09days on market $136,995 Active 67 DOM
-
2026-06-07days on market $136,995 Active 65 DOM
-
2026-06-01days on market $136,995 Active 59 DOM
-
2026-06-01days on market $136,995 Active 58 DOM
ⓘ Source: listings_history table (triggers on properties + properties_extension) + one-shot
backfill from property_details.listing_events for pre-trigger history.
Nearby sold comps map
Loading sold comps map…
Walkable amenities ~0.75 mi
Loading nearby amenities…
Taxation est. · year 1
- Rental income
- $15,919
- − Mortgage interest
- −$7,674
- − Property taxes
- −$2,055
- − Insurance
- −$685
- − Repairs & maintenance
- −$1,274
- − Management
- −$1,274
- − Depreciation
- −$3,985
- Taxable loss
- −$1,027
- Est. tax savings @ 24.0%
- +$246
- After-tax cash flow
- $1,462/yr
For passive investors: Depreciation is non-cash, so a rental often shows a tax loss while cash-flowing — sheltering income. Rental losses are passive: they offset passive income freely, and up to $25,000/yr can offset ordinary (W-2) income if you actively participate and your MAGI is under $100k (phasing out to $0 by $150k); unused losses carry forward. On sale, claimed depreciation is recaptured at up to 25%, and gains may owe capital-gains tax (a 1031 exchange can defer both). Figures are a year-1 estimate at your 24.0% rate — not tax advice; consult a CPA.
Condition & rehab AI · 8 photos
This move-in-ready manufactured home offers a cozy and well-maintained living space with a good condition score and minimal repairs needed. Potential buyers and renters will appreciate the updated kitchen and curb appeal.
Value-add opportunities
- Both Painting the exterior and interior walls — Fresh paint can enhance curb appeal and interior aesthetics.
- Both Landscaping improvements — Enhanced landscaping can improve curb appeal and attract potential buyers/renters.
- Both Adding a small outdoor seating area — A cozy outdoor space can increase the home's appeal and functionality.
- Both Upgrading the kitchen appliances — Modern appliances can make the kitchen more functional and attractive to potential buyers/renters.
Renovation cost estimate screening
Value-add ROI direction
- Both Painting the exterior and interior walls — Fresh paint can enhance curb appeal and interior aesthetics. ↑
- Both Landscaping improvements — Enhanced landscaping can improve curb appeal and attract potential buyers/renters. ↑
- Both Adding a small outdoor seating area — A cozy outdoor space can increase the home's appeal and functionality. ↑
- Both Upgrading the kitchen appliances — Modern appliances can make the kitchen more functional and attractive to potential buyers/renters. ↑
ⓘ Cost ranges are severity-bucket heuristics (US national rule-of-thumb). Get contractor quotes + a written scope before underwriting a rehab budget.
Schools (NCES district)
- District
- Lee
- NCES district ID
- 1201080
- Math proficiency
- 47% ▼ -11.00%
- Reading proficiency
- 50% ▼ -4.00%
- Median HH income
- $49,518
- Composite
- 41.49/100
- National rank
- #3458
- State rank
- #42 of 73 in FL
Livability — Iona
- Score
- 72/100
- State rank
- #359
- US rank
- #6253
Category grades
Schools grade is shown separately in the Schools card above.
Census & demographics
- Census place
- Iona, FL
- County
- Lee County · 788,662 people
- Metro
- Cape Coral-Fort Myers, FL
- Population (ZIP)
- 37,423
- Household income
- $75,396
- Rent vs Own
- Severe rent burden
- 1944.0
Population outlook (Lee County) Hauer SSP2
- Today (2025)
- 871,946 people
- By 2030
- 955,468 · +9.6%
- By 2040
- 1,113,587 · +27.7%
- By 2050
- 1,256,891 · +44.1%
- By 2075
- 1,560,270 · +78.9%
- By 2100
- 1,726,848 · +98.0%
Race, ethnicity, and origin ACS 2023
- Neighborhood character
- Predominantly White (88%)
- Race & ethnicity
- White 88% Hispanic / Latino 6% Two or more races 5% Black 3% Asian 1%
- Hispanic origin (detail)
- Mexican 1% Puerto Rican 2%
- Common ancestry
- Romanian 5% Lithuanian 4% Slovak 3%
- Foreign-born
- 10% · Canada, Jamaica
- Languages at home
- 90% English-only · Spanish 4% Russian/Polish/Slavic 1% Other Indo-European 1%
Political lean MEDSL · Lee
- 2024 margin
- Strong R (+28.4) · D 35.5% · R 63.9%
- 2008→2024 swing
- -18.0pp toward R · 2008: -10.4pp · 2024: -28.4pp
- All cycles
- 2024: R+28.4 2020: R+19.2 2016: R+20.4 2012: R+16.6 2008: R+10.4
Not yet ingested
- Civics
- —
Market trends
- HPI YoY
- ▼ -102.22%
- Current HPI
- 209.7595
- Rent YoY
- ▼ -1.18%
- Metro
- Cape Coral-Fort Myers, FL
- State GDP YoY
- ▲ 3.28%
- F500 in state
- 36
Industry mix (Fortune 500 HQ in FL)
| Industry | F500 HQs | Revenue |
|---|---|---|
| Industrial Technology | 2 | $29B |
|
||
| Insurance | 2 | $17B |
|
||
| Retail | 1 | $60B |
|
||
| Technology Distribution | 1 | $58B |
|
||
| Homebuilding | 1 | $35B |
|
||
| Technology Manufacturing | 1 | $35B |
|
||
Cash-flow waterfall
monthlySold comps — $/sqft
last 12 mo · ≤1 miLoading sold comps…