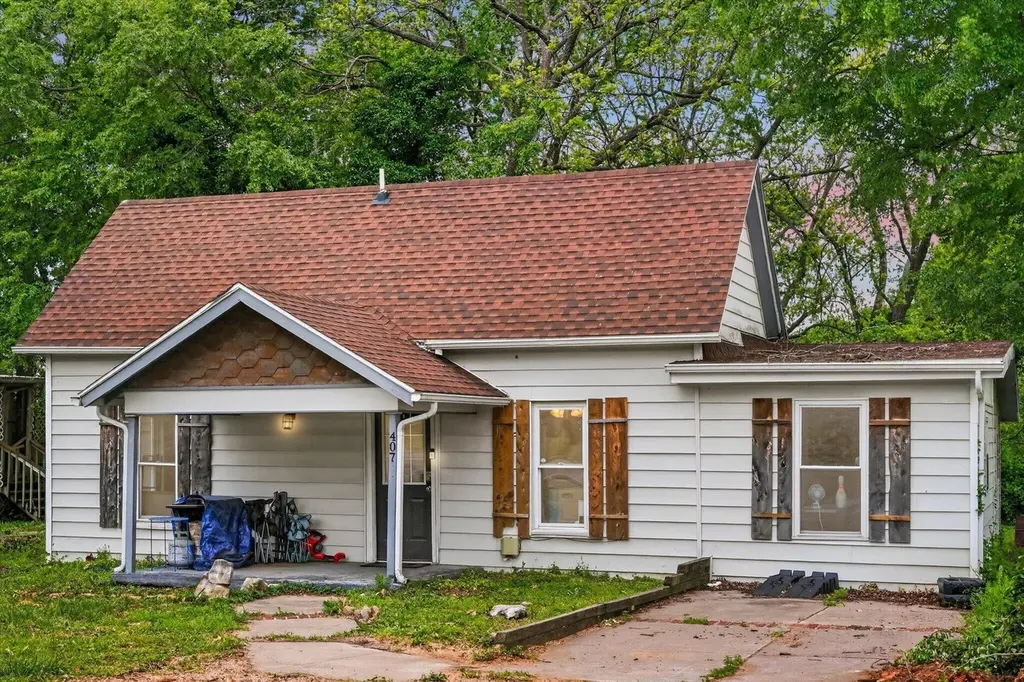
407 S Clarke Ave · Clever, MO
Flood risk 1/10 · Minimal
- FEMA flood zone
- X (unshaded)
- Chance of flooding over 30 yrs
- 0.0%
- Est. flood insurance / yr
- $473 – $860
Fire risk 3/10 · Minor
- Est. fire insurance / yr
- $1,054 – $1,958
Heat risk 5/10 · Moderate
- Hot days now (above 104°F)
- 7 days/yr
- Hot days in 30 yrs
- 19 days/yr
Wind risk 2/10 · Minimal
- Chance of severe wind over 30 yrs
- 1.0%
Air-quality risk 1/10 · Minimal
- Unhealthy air days now
- 0 days/yr
- Unhealthy air days in 30 yrs
- 0 days/yr
Risk factors via First Street. Map © Google.
Why this score? — see what drove the C- grade
The composite is a weighted blend of 9 inputs, each scored 0–100. Each bar is that input's sub-score; the figure is the points it added to the 100-point composite (weight × sub-score).
- Cash flow +21.3/30.0
- ARV discount +9.3/15.0
- DSCR +6.8/10.0
- 1% rule +4.4/10.0
- Livability +3.5/5.0
- Schools +3.4/10.0
- Rent growth +2.5/5.0
- Condition / age +2.5/5.0
- Appreciation +0.0/10.0
$153,000
🖨 Deal sheet 📄 Offer letter ✓ Due diligence
Listing remarks MLS
Welcome to 407 Clarke Ave! This charming 3 bedroom 1 bathroom home in the heart of Clever with a comfortable, easy-living layout. Bright living spaces, a functional kitchen, and nicely sized bedrooms make it a great fit for everyday living. The spacious yard offers plenty of room to enjoy the outdoors or add your personal touch. Conveniently located near schools and local amenities, this home is a solid option for first-time buyers, downsizers, or investors looking for value.
Key facts
- Functional kitchen
- Spacious yard
- Near schools
Tags
Neighborhood map
What this means for you Summary
Snapshot
- This is a 3-bed/1.0-bath other listed at $153k.
Deal economics
- At list price, monthly cash flow is $225 ($3k/yr) — positive.
- The deal already cash-flows at list — no discount required.
- To meet the 1% rule (rent ≥ 1% of price), the offer needs to be $144k (6.0% below list).
- Recommended offer: $144k (6.0% below list) — sets the bar for 1% rule.
- Cap rate 8.1% vs local median 2.2% in Clever — top-decile yield for the area; either an underpriced asset or a hidden risk that comps aren't pricing in. Stress-test before assuming the spread holds.
Location & tenants
- Location reads 69/100 on livability (#166 in MO) — a middle-class / working-renter tenant base. Strengths: cost of living A+, housing A+, crime A-; Watch: schools D+, employment D, amenities F.
- Clever R-V (rural): math 39% / reading 40% proficiency, ranked #139 of 324 in MO (top 43%) — families likely to look elsewhere, expect single-tenant / working-renter base with shorter leases.
- Market conditions: 70 active listings in the ZIP; 537 units permitted in Christian County in 2024 (0 in 5+ unit buildings).
Forward outlook
- Local home prices are declining (-3.0%/yr); year-one equity from $1k of loan paydown is wiped out by about $5k of value loss. Plan a longer hold.
- Christian County population projected at +24% by 2050 — long-run rental-demand tailwind backs the buy-and-hold thesis.
Negotiation context
- It's been on market 27 days — a 2% lower offer ($151k) is reasonable based on typical stale-listing flexibility.
- 2 sale attempts since 7y ago with the ask held roughly flat each time — persistent listings suggest the price (not the market) is what's stuck; bring a comps-based counter.
Risks & watch-outs
- Watch-outs: built in 1932 — expect roof / HVAC / electrical / plumbing capex.
- Climate carrying-cost: extreme-heat days projected 7→19/yr by 2055 (HVAC capex compounding) — expect insurance premiums to compound above CPI over the hold.
Questions for the listing agent
- Built in 1932 — when were the roof, HVAC, electrical panel, plumbing, and water heater last replaced?
- Is there a deadline driving the sale (1031 exchange, divorce, estate, relocation)? That informs how much negotiation room exists.
- Schools are D-rated, which usually means shorter tenancies and higher turnover. Who's the typical renter profile here, and what's been the actual vacancy rate?
- What's the average days-on-market for RENTAL listings here right now (not sales)? A rising rental-DOM trend means longer vacancies and softer asking-rent achievability than the comps imply.
- What's the recent tenant-quality profile in this submarket — average credit score on applications, eviction rate, late-payment / NSF rate, and stable-employment percentage? A property-management company in the area should have these aggregated.
- How much new for-sale + rental construction is in the pipeline within 1–3 miles? Heavy new supply typically softens prices + rents 12–24 months out; constrained supply supports both.
Investment metrics
- 1% rule
- 0.94% ✗
- Cap rate
- 8.06%
- Cash-on-cash
- 6.30%
- DSCR
- 1.28
- GRM
- 8.9
CMA / ARV
- ARV (median comp)
- $159,273
- List price
- $153,000
- Delta
- 0.46%
- Verdict
- FAIR
- Comps
- 20 within 1.0 mi
Projected returns pro-forma
-3.0% appreciation · 3.0% rent growth · sell at horizon
- IRR
- -6.6%
- Equity multiple
- 0.75×
- Total profit
- $-10,525
- Equity at exit
- $22,813
- IRR
- 2.9%
- Equity multiple
- 1.21×
- Total profit
- $9,017
- Equity at exit
- $13,229
Cash invested: $42,840 (down + closing). Projections, not guarantees.
Landlord ↔ Tenant lean methodology
- Overall (STATE)
- 81 Strongly Landlord-Friendly
- State Missouri
- 81 Strongly Landlord-Friendly · R+10
- County
- — inherits STATE
- City
- — inherits STATE
ZIP-level market 65631
- Home prices YoY
- -6.0%
- Active inventory
- 70
- Price-to-rent
- 8.9×
Monthly cashflow live
- Estimated rent
- $1,438 medium interval (Pro) →
- Mortgage (P&I)
- −$802
- Tax from tax record
- −$45 /mo · $538/yr
- Insurance
- −$64
- HOA
- −$0
- Vacancy / Maint / Mgmt
- −$302
- Net cashflow
- $225
Break-even live
UW: 25.0% down · 7.5% · 30yr · 1.5% tax · 5.0% vac · 8.0% maint · 8.0% mgmt
Financing live
Cash to close
- Down payment
- $38,250
- Closing costs
- $4,590
- Reserves months
- —
- Total cash needed
- —
Loan-product check · same deal, 3 products live
Conventional
25% down · 7.5% · 30yr
- Down + closing
- —
- Monthly P&I
- —
- Monthly cashflow
- —
- DSCR
- —
- Eligible?
- —
Personal DTI + credit; lowest rate.
DSCR
20% down · 8.5% · 30yr
- Down + closing
- —
- Monthly P&I
- —
- Monthly cashflow
- —
- DSCR
- —
- Eligible?
- —
No personal income docs; deal must DSCR.
Hard money
10% down · 12.0% · 12mo
- Down + closing
- —
- Monthly P&I
- —
- Monthly cashflow
- —
- DSCR
- —
- Eligible?
- —
Short-term bridge; refi at stabilization.
Listing history 23 events
-
2026-06-18days on market $153,000 Active 27 DOM
-
2026-06-17days on market $153,000 Active 26 DOM
-
2026-06-16days on market $153,000 Active 25 DOM
-
2026-06-15days on market $153,000 Active 24 DOM
-
2026-06-14days on market $153,000 Active 22 DOM
-
2026-06-10days on market $153,000 Active 19 DOM
-
2026-06-09days on market $153,000 Active 18 DOM
-
2026-06-08days on market $153,000 Active 17 DOM
-
2026-06-07pricedays on market $153,000 Active 16 DOM
-
2026-06-05days on market $157,000 Active 13 DOM
-
2026-06-03days on market $157,000 Active 12 DOM
-
2026-06-02days on market $157,000 Active 11 DOM
-
2026-06-01days on market $157,000 Active 10 DOM
-
2026-05-31days on market $157,000 Active 9 DOM
-
2026-05-30days on market $157,000 Active 8 DOM
-
2026-04-24$160,000 Active 480-char remark
Show marketing remark (480 chars)
Welcome to 407 Clarke Ave! This charming 3 bedroom 1 bathroom home in the heart of Clever with a comfortable, easy-living layout. Bright living spaces, a functional kitchen, and nicely sized bedrooms make it a great fit for everyday living. The spacious yard offers plenty of room to enjoy the outdoors or add your personal touch. Conveniently located near schools and local amenities, this home is a solid option for first-time buyers, downsizers, or investors looking for value.
-
2023-11-02soldstatus
-
2020-08-26soldstatus
-
2020-08-21soldstatus 579-char remark
Show marketing remark (579 chars)
This cute bungalow home has been completely remodeled top to bottom with all new construction. There are 3 bedrooms, 1 full bath with a tub shower/combo, and a sink with decorative finishes. The flooring is a wood''look'' laminate floor throughout, and there is barn wood plank accent walls in the living room and master bedroom. There is a dining area leading into the kitchen, with shelving for kitchen storage. The house has vinyl siding, some new fencing, and a deep backyard. There is also a covered front patio. Great house to get 100% financing! Come view this home today!
-
2019-12-05$85,000 579-char remark
Show marketing remark (579 chars)
This cute bungalow home has been completely remodeled top to bottom with all new construction. There are 3 bedrooms, 1 full bath with a tub shower/combo, and a sink with decorative finishes. The flooring is a wood''look'' laminate floor throughout, and there is barn wood plank accent walls in the living room and master bedroom. There is a dining area leading into the kitchen, with shelving for kitchen storage. The house has vinyl siding, some new fencing, and a deep backyard. There is also a covered front patio. Great house to get 100% financing! Come view this home today!
-
2019-06-26soldstatus
-
2016-06-24soldstatus
-
2004-09-03soldstatus
ⓘ Source: listings_history table (triggers on properties + properties_extension) + one-shot
backfill from property_details.listing_events for pre-trigger history.
Tax reassessment forecast MO · Resets to sale price
- Current annual tax
- $538 · $45/mo
- Projected year-2 tax
- $1,484 · $124/mo
- Expected delta
- +$946/yr (+$79/mo · 176.0%)
ⓘ Screening estimate from a state-policy table — verify with the county assessor before closing.
Climate risk First Street
- Flood 1/10 Low FEMA zone X (unshaded) · 0% chance over 30 yrs
- Wildfire 3/10 Moderate
- Heat 5/10 Major 7 d/yr ≥104°F today · 19 d/yr by 30 yrs out
- Wind 2/10 Low 100% chance of damaging wind over 30 yrs
- Air quality 1/10 Low 0 unhealthy d/yr today · 0 by 30 yrs out
Nearby sold comps map
Loading sold comps map…
Walkable amenities ~0.75 mi
Loading nearby amenities…
Taxation est. · year 1
- Rental income
- $17,256
- − Mortgage interest
- −$8,570
- − Property taxes
- −$538
- − Insurance
- −$765
- − Repairs & maintenance
- −$1,380
- − Management
- −$1,380
- − Depreciation
- −$4,451
- Taxable income
- $171
- Est. tax owed @ 24.0%
- −$41
- After-tax cash flow
- $2,660/yr
For passive investors: Depreciation is non-cash, so a rental often shows a tax loss while cash-flowing — sheltering income. Rental losses are passive: they offset passive income freely, and up to $25,000/yr can offset ordinary (W-2) income if you actively participate and your MAGI is under $100k (phasing out to $0 by $150k); unused losses carry forward. On sale, claimed depreciation is recaptured at up to 25%, and gains may owe capital-gains tax (a 1031 exchange can defer both). Figures are a year-1 estimate at your 24.0% rate — not tax advice; consult a CPA.
Schools (NCES district)
- District
- Clever R-V
- NCES district ID
- 2909780
- Math proficiency
- 39% ▼ -2.00%
- Reading proficiency
- 40% ▲ 3.00%
- Median HH income
- $53,651
- Composite
- 34.43/100
- National rank
- #5199
- State rank
- #139 of 324 in MO
Livability — Clever
- Score
- 69/100
- State rank
- #166
- US rank
- #8960
Category grades
Schools grade is shown separately in the Schools card above.
Census & demographics
- Census place
- Clever, MO
- Population (ZIP)
- 6,175
Population outlook (Christian County) Hauer SSP2
- Today (2025)
- 95,071 people
- By 2030
- 100,379 · +5.6%
- By 2040
- 109,902 · +15.6%
- By 2050
- 117,487 · +23.6%
- By 2075
- 130,738 · +37.5%
- By 2100
- 131,730 · +38.6%
Race, ethnicity, and origin ACS 2023
- Neighborhood character
- Predominantly White (94%)
- Race & ethnicity
- White 94% Two or more races 4% Hispanic / Latino 2%
- Common ancestry
- Italian 3% Iranian 2% Hungarian 2%
- Foreign-born
- 1%
Political lean MEDSL · Christian
- 2024 margin
- Solid R (+52.2) · D 23.3% · R 75.6% · Other 1.1%
- 2008→2024 swing
- -16.4pp toward R · 2008: -35.8pp · 2024: -52.2pp
- All cycles
- 2024: R+52.2 2020: R+50.8 2016: R+54.2 2012: R+46.5 2008: R+35.8
Not yet ingested
- Civics
- —
Market trends
- HPI YoY
- ▼ -15.71%
- Current HPI
- 245.4824
- Rent YoY
- —
- Metro
- —
- State GDP YoY
- ▲ 1.84%
- F500 in state
- 20
Industry mix (Fortune 500 HQ in MO)
| Industry | F500 HQs | Revenue |
|---|---|---|
| Healthcare | 1 | $163B |
|
||
| Insurance | 1 | $21B |
|
||
| Industrial Technology | 1 | $17B |
|
||
| Retail | 1 | $16B |
|
||
| Industrial Distribution | 1 | $10B |
|
||
| Utilities | 1 | $9B |
|
||
Price history
+88.2% since first listed8 events — show timeline
- 2026-04-24 Listed $160,000 SOMO
- 2023-11-02 Sold (Public Records) — Public Records
- 2020-08-26 Sold (Public Records) — Public Records
- 2020-08-21 Sold (MLS) — SOMO
- 2019-12-05 Listed $85,000 SOMO
- 2019-06-26 Sold (Public Records) — Public Records
- 2016-06-24 Sold (Public Records) — Public Records
- 2004-09-03 Sold (Public Records) — Public Records
Property tax history
+4.7%/yrLatest (2025): $538 · +4.4% YoY. Source: county tax records.
Cash-flow waterfall
monthlySold comps — $/sqft
last 12 mo · ≤1 miLoading sold comps…