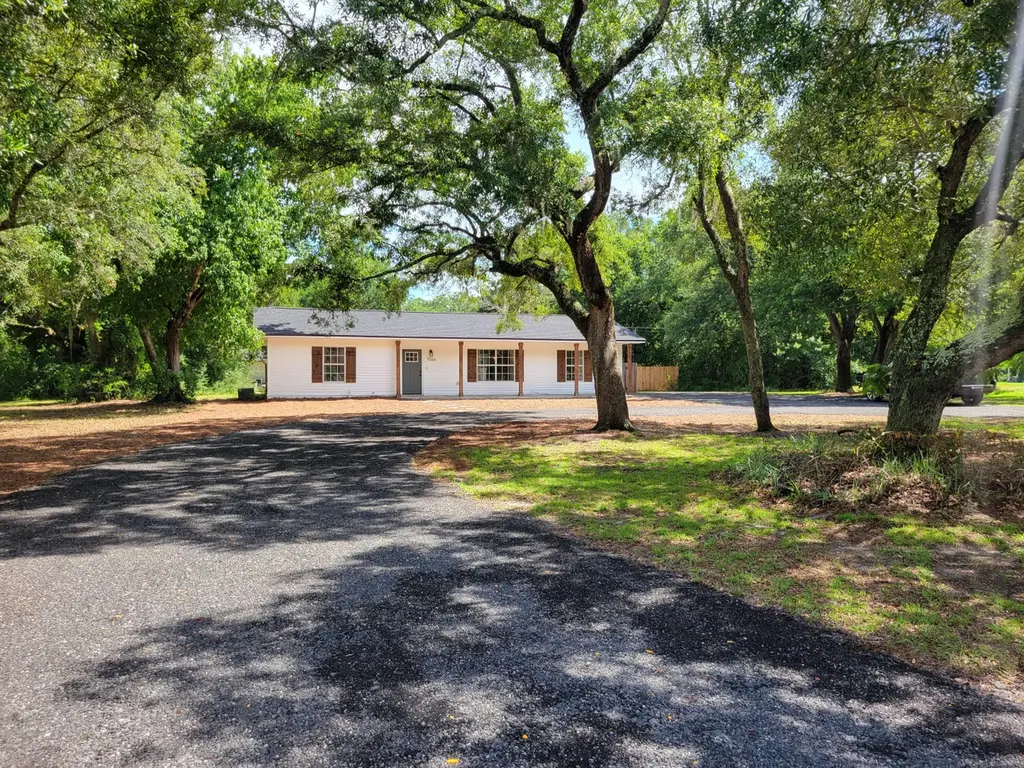
7066 Nelson St · Holley, FL
Flood risk 1/10 · Minimal
- FEMA flood zone
- X (unshaded)
- Chance of flooding over 30 yrs
- 0.0%
- Est. flood insurance / yr
- $507 – $1,088
Fire risk 5/10 · Moderate
- Est. fire insurance / yr
- $947 – $1,759
Heat risk 10/10 · Severe
- Hot days now (above 105°F)
- 7 days/yr
- Hot days in 30 yrs
- 22 days/yr
Wind risk 9/10 · Severe
- Chance of severe wind over 30 yrs
- 99.0%
Air-quality risk 2/10 · Minimal
- Unhealthy air days now
- 2 days/yr
- Unhealthy air days in 30 yrs
- 2 days/yr
Risk factors via First Street. Map © Google.
Why this score? — see what drove the D grade
The composite is a weighted blend of 9 inputs, each scored 0–100. Each bar is that input's sub-score; the figure is the points it added to the 100-point composite (weight × sub-score).
- Cash flow +14.3/30.0
- ARV discount +6.4/15.0
- Schools +5.3/10.0
- DSCR +4.3/10.0
- Rent growth +3.2/5.0
- Livability +3.2/5.0
- 1% rule +3.1/10.0
- Condition / age +2.5/5.0
- Appreciation +0.0/10.0
$269,900
🖨 Deal sheet (PDF) 📄 Offer letter ✓ Due diligence
Listing remarks
NO HOA! Bring your boat! Holley Boat Ramp less than 1/2 mile. First time home buyers or investors must come see this charming 3 bedroom, 2 bathroom home in Navarre, FL. The house features fresh neutral paint and beautiful LVP flooring throughout. The recently painted cabinetry and updated hardware adds a touch of modern elegance to the kitchen. Enjoy the privacy of the fenced-in backyard and the convenience of extra crushed asphalt parking on the property. The house sits on a beautiful lot with gorgeous oak trees and lush greenery, perfect for anyone preferring to be surrounded by nature. Updated fixtures and a nice front porch add to the overall appeal of this home. With a circle drivewa
Key facts
- Fenced-in backyard
- Circle driveway
- 0.63 acre lot
Tags
Property features AI
Finance
- Financial info: Buyer financing available: Conventional, FHA, VA
Exterior
- Parking: Other parking
- Utilities: Public water
- Home design: Detached single-family residence; Construction complete
- Construction: Built in 1969; Frame construction with vinyl trim
- Exterior features: Interior lot; Within 1/2 mile to water; County road frontage; Lot dimensions approximately 140 x 195
Interior
- Kitchen: Dishwasher; Microwave; Refrigerator; Electric stove/oven
- Bedrooms: 3 bedrooms
- Bathrooms: 2 full bathrooms
- Interior features: Single-story layout; Has heating; Has cooling
Neighborhood map
What this means for you Summary
Snapshot
- This is a 3-bed/2.0-bath single-family listed at $270k.
Deal economics
- At list price, monthly cash flow is $49 ($584/yr) — positive.
- The deal already cash-flows at list — no discount required.
- To meet the 1% rule (rent ≥ 1% of price), the offer needs to be $219k (18.7% below list).
- Recommended offer: $219k (18.7% below list) — sets the bar for 1% rule.
- Cap rate 6.5% vs local median 3.2% in Holley — top-decile yield for the area; either an underpriced asset or a hidden risk that comps aren't pricing in. Stress-test before assuming the spread holds.
Location & tenants
- Location reads 64/100 on livability (#698 in FL) — a middle-class / working-renter tenant base. Strengths: crime A+, housing A+, cost of living B+; Watch: amenities F, commute F, health & safety F.
- Santa Rosa (suburban): math 63% / reading 60% proficiency, ranked #8 of 73 in FL (top 11%) — acceptable for families but not a draw, mixed tenant base, ~2y average lease.
- Zoned schools: Holley-Navarre Primary (771 students, 41% FRL); Holley-Navarre Middle School (math 71% / reading 63%, grade A-, #80 of 571 statewide, top 14%, 830 students, 42% FRL); Navarre High School (math 49% / reading 58%, grade C-, #146 of 667 statewide, top 22%, 2,406 students, 30% FRL) — zoned schools at 38% FRL track the district average.
- Market conditions: Rents rising (+2.7%/yr); 769 active listings in the ZIP; 1 comparable units currently listed for rent nearby; solid renter incomes; 1,983 units permitted in Santa Rosa County in 2024 (128 in 5+ unit buildings).
Forward outlook
- Local home prices are declining (-3.0%/yr); year-one equity from $2k of loan paydown is wiped out by about $8k of value loss. Plan a longer hold.
- Santa Rosa County population projected at +31% by 2050 — long-run rental-demand tailwind backs the buy-and-hold thesis.
Negotiation context
- Only 1 days on market — expect competitive offers; lowballing is unlikely to land.
- 5 sale attempts since 15y ago with the ask held roughly flat each time — persistent listings suggest the price (not the market) is what's stuck; bring a comps-based counter.
Risks & watch-outs
- Climate carrying-cost: severe wind risk, 99% chance of damaging wind over 30y; moderate wildfire risk; extreme-heat days projected 7→22/yr by 2055 (HVAC capex compounding) — expect insurance premiums to compound above CPI over the hold.
Questions for the listing agent
- Built in 1969 — when were the roof, HVAC, electrical panel, plumbing, and water heater last replaced?
- Is there a deadline driving the sale (1031 exchange, divorce, estate, relocation)? That informs how much negotiation room exists.
- Schools are F-rated, which usually means shorter tenancies and higher turnover. Who's the typical renter profile here, and what's been the actual vacancy rate?
- The area grade is low — what's the realistic commute time and amenity access for the typical tenant pool here? Any planned neighborhood developments (good or bad) we should know about?
- What's the average days-on-market for RENTAL listings here right now (not sales)? A rising rental-DOM trend means longer vacancies and softer asking-rent achievability than the comps imply.
- What's the recent tenant-quality profile in this submarket — average credit score on applications, eviction rate, late-payment / NSF rate, and stable-employment percentage? A property-management company in the area should have these aggregated.
- How much new for-sale + rental construction is in the pipeline within 1–3 miles? Heavy new supply typically softens prices + rents 12–24 months out; constrained supply supports both.
Investment metrics
- 1% rule
- 0.81% ✗
- Cap rate
- 6.51%
- Cash-on-cash
- 0.77%
- DSCR
- 1.03
- GRM
- 10.3
CMA / ARV
- ARV (on-the-fly)
- $263,304
- Comps found
- 5
Show comp detail 5 sales within ~0.75 mi
| Address | Dist | Beds/Ba | Sqft | Sold | Price | $/sf | Match |
|---|---|---|---|---|---|---|---|
| 6960 Nelson St | 0.16mi | 3/2.0 | 1,224 (-1%) | 11mo | $299,900 | $245 | 81 |
| 7111 Nelson St | 0.28mi | 3/2.0 | 1,261 (+2%) | 5mo | $267,000 | $212 | 80 |
| 3118 Live Oak St | 0.31mi | 3/2.0 | 1,352 (+9%) | 16mo | $275,000 | $203 | 57 |
| 6930 Nelson St | 0.22mi | 2/2.0 (-1) | 1,370 (+10%) | 22mo | $265,000 | $193 | 49 |
| 7444 Gordon Evans Rd | 0.69mi | 3/2.0 | 1,333 (+7%) | 24mo | $355,000 | $266 | 36 |
Match score weights: distance 35% · size 25% · config 20% · recency 20%. Top-matched comps best support the ARV.
Projected returns pro-forma
-3.0% appreciation · 2.74% rent growth · sell at horizon
- IRR
- -15.4%
- Equity multiple
- 0.45×
- Total profit
- $-41,288
- Equity at exit
- $40,243
- IRR
- -7.3%
- Equity multiple
- 0.54×
- Total profit
- $-34,618
- Equity at exit
- $23,336
Cash invested: $75,572 (down + closing). Projections, not guarantees.
Landlord ↔ Tenant lean methodology
- Overall (STATE)
- 87 Strongly Landlord-Friendly
- State Florida
- 87 Strongly Landlord-Friendly · R+3
- County
- — inherits STATE
- City
- — inherits STATE
ZIP-level market 32566
- Home prices YoY
- -26.2%
- Rents YoY
- 2.7%
- Active inventory
- 769
- Price-to-rent
- 10.3×
Monthly cashflow live
- Estimated rent
- $2,194 medium interval (Pro) →
- Mortgage (P&I)
- −$1,415
- Tax from tax record
- −$156 /mo · $1,878/yr
- Insurance
- −$112
- HOA
- −$0
- Vacancy / Maint / Mgmt
- −$461
- Net cashflow
- $49
Break-even live
Sensitivity live
| Price | -10% $201 | -5% $125 | +0% $49 | +5% $-28 | +10% $-104 |
|---|---|---|---|---|---|
| Rent | -10% $-125 | -5% $-38 | +0% $49 | +5% $135 | +10% $222 |
| Rate | -1.0pp $185 | -0.5pp $117 | base $49 | +0.5pp $-21 | +1.0pp $-92 |
UW: 25.0% down · 7.5% · 30yr · 1.5% tax · 5.0% vac · 8.0% maint · 8.0% mgmt
Financing live
Cash to close
- Down payment
- $67,475
- Closing costs
- $8,097
- Reserves months
- —
- Total cash needed
- —
Loan-product check · same deal, 3 products live
Conventional
25% down · 7.5% · 30yr
- Down + closing
- —
- Monthly P&I
- —
- Monthly cashflow
- —
- DSCR
- —
- Eligible?
- —
Personal DTI + credit; lowest rate.
DSCR
20% down · 8.5% · 30yr
- Down + closing
- —
- Monthly P&I
- —
- Monthly cashflow
- —
- DSCR
- —
- Eligible?
- —
No personal income docs; deal must DSCR.
Hard money
10% down · 12.0% · 12mo
- Down + closing
- —
- Monthly P&I
- —
- Monthly cashflow
- —
- DSCR
- —
- Eligible?
- —
Short-term bridge; refi at stabilization.
Rent comps 1 comps
| Address | Beds | Baths | Sqft | Rent | $/sqft | DOM | Units | Dist |
|---|---|---|---|---|---|---|---|---|
| 3661 London Rd Navarre, FL | 3.0 | 2.0 | 1304 | $1,950 | $1.50 | 25d | 1 | 0.86mi |
Listing history 10 events
-
2026-05-12status Pending
-
2026-05-09$269,900 Active
-
2024-08-13historical $1,770
-
2024-07-20$1,770
-
2016-05-19historical
-
2016-04-14$119,900
-
2013-08-03historical
-
2013-05-23$115,000
-
2012-03-28historical
-
2011-09-28$115,000
ⓘ Source: listings_history table (triggers on properties + properties_extension) + one-shot
backfill from property_details.listing_events for pre-trigger history.
Tax reassessment forecast FL · Resets to sale price
- Current annual tax
- $1,878 · $156/mo
- Projected year-2 tax
- $2,240 · $187/mo
- Expected delta
- +$362/yr (+$30/mo · 19.3%)
ⓘ Screening estimate from a state-policy table — verify with the county assessor before closing.
Climate risk First Street
- Flood 1/10 Low FEMA zone X (unshaded) · 0% chance over 30 yrs
- Wildfire 5/10 Major
- Heat 10/10 Extreme 7 d/yr ≥105°F today · 22 d/yr by 30 yrs out
- Wind 9/10 Extreme 99% chance of damaging wind over 30 yrs
- Air quality 2/10 Low 2 unhealthy d/yr today · 2 by 30 yrs out
Nearby sold comps map
Loading sold comps map…
Walkable amenities ~0.75 mi
Loading nearby amenities…
Taxation est. · year 1
- Rental income
- $26,324
- − Mortgage interest
- −$15,119
- − Property taxes
- −$1,878
- − Insurance
- −$1,350
- − Repairs & maintenance
- −$2,106
- − Management
- −$2,106
- − Depreciation
- −$7,852
- Taxable loss
- −$4,086
- Est. tax savings @ 24.0%
- +$981
- After-tax cash flow
- $1,564/yr
For passive investors: Depreciation is non-cash, so a rental often shows a tax loss while cash-flowing — sheltering income. Rental losses are passive: they offset passive income freely, and up to $25,000/yr can offset ordinary (W-2) income if you actively participate and your MAGI is under $100k (phasing out to $0 by $150k); unused losses carry forward. On sale, claimed depreciation is recaptured at up to 25%, and gains may owe capital-gains tax (a 1031 exchange can defer both). Figures are a year-1 estimate at your 24.0% rate — not tax advice; consult a CPA.
Schools (NCES district)
- District
- Santa Rosa
- NCES district ID
- 1201650
- Math proficiency
- 63% ▼ -6.00%
- Reading proficiency
- 60% ▼ -5.00%
- Median HH income
- $58,161
- Composite
- 53.12/100
- National rank
- #1511
- State rank
- #8 of 73 in FL
Livability — Holley
- Score
- 64/100
- State rank
- #698
- US rank
- #14641
Category grades
Schools grade is shown separately in the Schools card above.
Census & demographics
- Census place
- Holley, FL
- County
- Santa Rosa County · 194,764 people
- Metro
- Pensacola-Ferry Pass-Brent, FL
- Population (ZIP)
- 43,883
- Household income
- $105,551
- Rent vs Own
- Severe rent burden
- 608.0
Population outlook (Santa Rosa County) Hauer SSP2
- Today (2025)
- 195,978 people
- By 2030
- 209,782 · +7.0%
- By 2040
- 235,293 · +20.1%
- By 2050
- 256,408 · +30.8%
- By 2075
- 298,074 · +52.1%
- By 2100
- 303,216 · +54.7%
Race, ethnicity, and origin ACS 2023
- Neighborhood character
- Predominantly White (75%)
- Race & ethnicity
- White 75% Two or more races 9% Hispanic / Latino 9% Black 6% Asian 3%
- Hispanic origin (detail)
- Mexican 3% Puerto Rican 2%
- Common ancestry
- Scotch-Irish 3% Lithuanian 3% Romanian 2%
- Foreign-born
- 6% · Canada, Jamaica, Vietnam
- Languages at home
- 92% English-only · Spanish 4% German/W. Germanic 1% Tagalog/Filipino 1%
Political lean MEDSL · Santa Rosa
- 2024 margin
- Solid R (+51.0) · D 24.1% · R 75.0%
- 2008→2024 swing
- -3.0pp toward R · 2008: -47.9pp · 2024: -51.0pp
- All cycles
- 2024: R+51.0 2020: R+46.5 2016: R+53.5 2012: R+52.6 2008: R+47.9
Not yet ingested
- Civics
- —
Market trends
- HPI YoY
- ▼ -105.87%
- Current HPI
- 298.6821
- Rent YoY
- ▲ 2.74%
- Metro
- Pensacola-Ferry Pass-Brent, FL
- State GDP YoY
- ▲ 3.28%
- F500 in state
- 36
Industry mix (Fortune 500 HQ in FL)
| Industry | F500 HQs | Revenue |
|---|---|---|
| Industrial Technology | 2 | $29B |
|
||
| Insurance | 2 | $17B |
|
||
| Retail | 1 | $60B |
|
||
| Technology Distribution | 1 | $58B |
|
||
| Homebuilding | 1 | $35B |
|
||
| Technology Manufacturing | 1 | $35B |
|
||
Price history
+134.7% since first listed10 events — show timeline
- 2026-05-12 Pending — NAMLS
- 2026-05-09 Listed $269,900 NAMLS
- 2024-08-13 Rental Removed $1,770 NAMLS
- 2024-07-20 Listed for Rent $1,770 NAMLS
- 2016-05-19 Listing Removed — NAMLS
- 2016-04-14 Listed $119,900 NAMLS
- 2013-08-03 Listing Removed — NAMLS
- 2013-05-23 Listed $115,000 NAMLS
- 2012-03-28 Listing Removed — NAMLS
- 2011-09-28 Listed $115,000 NAMLS
Property tax history
+8.2%/yrLatest (2025): $1,878 · +9.0% YoY. Source: county tax records.
Cash-flow waterfall
monthlySold comps — $/sqft
last 12 mo · ≤1 miLoading sold comps…