 🏗️ New Construction
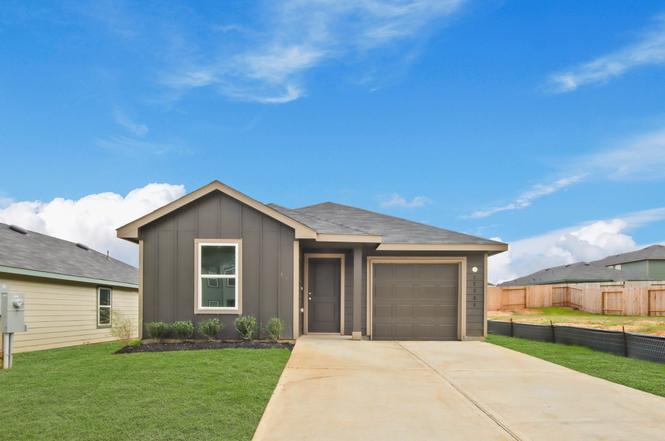
12354 Mccrorey Trl · Cut and Shoot, TX
Flood risk No data
- FEMA flood zone
- —
- Chance of flooding over 30 yrs
- —
- Est. flood insurance / yr
- —
Fire risk No data
- Est. fire insurance / yr
- —
Heat risk No data
- Hot days now (above threshold)
- —
- Hot days in 30 yrs
- —
Wind risk No data
- Chance of severe wind over 30 yrs
- —
Air-quality risk No data
- Unhealthy air days now
- —
- Unhealthy air days in 30 yrs
- —
Risk factors via First Street. Map © Google.
Why this score? — see what drove the C- grade
The composite is a weighted blend of 9 inputs, each scored 0–100. Each bar is that input's sub-score; the figure is the points it added to the 100-point composite (weight × sub-score).
- Cash flow +21.3/30.0
- ARV discount +7.5/15.0
- DSCR +6.8/10.0
- 1% rule +4.8/10.0
- Schools +3.2/10.0
- Livability +2.8/5.0
- Condition / age +2.5/5.0
- Rent growth +2.4/5.0
- Appreciation +0.0/10.0
$179,990
🖨 Deal sheet (PDF) 📄 Offer letter ✓ Due diligence
Listing remarks
WONDERFUL NEW D. R. HORTON BUILT 1 STORY IN MCCROREY TRAILS! MOVE-IN READY! Great Open Concept Interior Layout! Delightful Island Kitchen, Opens onto Spacious Living & Dining Area! Excellent for Functionality AND for Entertaining! Primary Suite Offers Lovely Bath with a Walk-In Closet! Generously Sized Secondary Bedrooms! Convenient Utility Room! Great Community with Park, Pickleball Court, Basketball Court, and Fishing Pond! Hurry and Call Today!
Key facts
- Island kitchen
- Walk-in closet
- Primary suite
Tags
Property features AI
Finance
- Other: Municipal Utility District disclosure included
- HOA & community: Homeowners association managed by Goodwin & Co. Inc; Association fee $600 annually
Exterior
- Parking: Attached garage (1 car)
- Security: Smoke detector(s)
- Utilities: Public water; Public sewer
- Home design: Residential property; New construction; Single-story (living spaces described on first level); Slab foundation; Composition roof; Built in 2025
- Construction: Cement siding construction; Built by D.R. Horton
- Exterior features: Porch; Private yard; Subdivision setting
Interior
- Kitchen: Dishwasher; Electric cooktop; Electric oven; Microwave; Garbage disposal; Tankless water heater
- Bedrooms: Primary bedroom (First level) — approximately 13 x 12; Bedroom (First level) — approximately 11 x 10; Bedroom (First level) — approximately 11 x 10; Family room (First level) — approximately 15 x 14
- Flooring: Carpet; Plank; Vinyl
- Bathrooms: 2 full bathrooms
- Heating & cooling: Central heating (electric); Central air (electric)
- Interior features: Breakfast bar; Granite counters; Kitchen island; Kitchen/family room combo; Pantry; Kitchen/dining combo; Living/dining room; Programmable thermostat; Low emissivity windows; Ventilation for improved indoor air quality
- Laundry & utility: Washer hookup; Electric dryer hookup
Neighborhood map
What this means for you Summary
Snapshot
- This is a 3-bed/2.0-bath land listed at $180k.
Deal economics
- At list price, monthly cash flow is $264 ($3k/yr) — positive.
- The deal already cash-flows at list — no discount required.
- To meet the 1% rule (rent ≥ 1% of price), the offer needs to be $177k (1.8% below list).
- Recommended offer: $158k (12.0% below list) — sets the bar for market timing.
- Cap rate 8.1% vs local median 4.9% in Cut and Shoot — top-decile yield for the area; either an underpriced asset or a hidden risk that comps aren't pricing in. Stress-test before assuming the spread holds.
Location & tenants
- Location reads 56/100 on livability (#1,326 in TX) — a working-class tenant base; expect higher turnover. Strengths: cost of living A+, housing A+; Watch: crime D-, amenities F, commute F.
- Willis ISD (rural): math 33% / reading 40% proficiency, ranked #458 of 826 in TX (top 55%) — families likely to look elsewhere, expect single-tenant / working-renter base with shorter leases.
- Zoned schools: Edward B Cannan El (math 34% / reading 32%, grade F, #2,208 of 4,322 statewide, top 52%, 672 students, 74% FRL); Lynn Lucas Middle (math 23% / reading 32%, grade F, #1,156 of 1,662 statewide, top 71%, 971 students, 74% FRL); Willis H S (math 19% / reading 46%, grade F, #1,029 of 1,632 statewide, top 64%, 2,521 students, 57% FRL).
- Market conditions: Rents soft (-0.3%/yr); 721 active listings in the ZIP; 1 comparable units currently listed for rent nearby; solid renter incomes; 13,259 units permitted in Montgomery County in 2024 (1,402 in 5+ unit buildings).
Forward outlook
- Local home prices are declining (-3.0%/yr); year-one equity from $1k of loan paydown is wiped out by about $5k of value loss. Plan a longer hold.
- Montgomery County population projected at +65% by 2050 — long-run rental-demand tailwind backs the buy-and-hold thesis.
Negotiation context
- It's been on market 212 days — a 12% lower offer ($158k) is reasonable based on typical stale-listing flexibility.
Questions for the listing agent
- It's been on market 212 days. Have you received any prior offers? Is the seller open to a 12% concession, seller financing, or rate buy-down credit?
- What does the HOA fee cover, when was the last increase, and are there any pending special assessments or reserve-fund shortfalls?
- Why hasn't it sold? Are there any deal-killer items the seller is aware of (foundation, flood, title, zoning, code violations)?
- Is there a deadline driving the sale (1031 exchange, divorce, estate, relocation)? That informs how much negotiation room exists.
- Schools are F-rated, which usually means shorter tenancies and higher turnover. Who's the typical renter profile here, and what's been the actual vacancy rate?
- Crime grade is D in this area — have there been break-ins, vandalism, or insurance claims at this property in the last 3 years? What carrier currently insures it and at what premium?
- What's the average days-on-market for RENTAL listings here right now (not sales)? A rising rental-DOM trend means longer vacancies and softer asking-rent achievability than the comps imply.
- What's the recent tenant-quality profile in this submarket — average credit score on applications, eviction rate, late-payment / NSF rate, and stable-employment percentage? A property-management company in the area should have these aggregated.
- How much new for-sale + rental construction is in the pipeline within 1–3 miles? Heavy new supply typically softens prices + rents 12–24 months out; constrained supply supports both.
Investment metrics
- 1% rule
- 0.98% ✗
- Cap rate
- 8.06%
- Cash-on-cash
- 6.29%
- DSCR
- 1.28
- GRM
- 8.5
CMA / ARV
No comps found within radius.
Projected returns pro-forma
-3.0% appreciation · 0.0% rent growth · sell at horizon
- IRR
- -9.8%
- Equity multiple
- 0.65×
- Total profit
- $-17,550
- Equity at exit
- $26,837
- IRR
- -4.8%
- Equity multiple
- 0.73×
- Total profit
- $-13,784
- Equity at exit
- $15,562
Cash invested: $50,397 (down + closing). Projections, not guarantees.
Landlord ↔ Tenant lean methodology
- Overall (STATE)
- 87 Strongly Landlord-Friendly
- State Texas
- 87 Strongly Landlord-Friendly · R+5
- County
- — inherits STATE
- City
- — inherits STATE
ZIP-level market 77303
- Home prices YoY
- -22.4%
- Rents YoY
- -0.3%
- Active inventory
- 721
- Price-to-rent
- 8.5×
Monthly cashflow live
- Estimated rent
- $1,767 medium interval (Pro) →
- Mortgage (P&I)
- −$944
- Tax from tax record
- −$62 /mo · $749/yr
- Insurance
- −$75
- HOA
- −$50
- Vacancy / Maint / Mgmt
- −$371
- Net cashflow
- $264
Break-even live
Sensitivity live
| Price | -10% $366 | -5% $315 | +0% $264 | +5% $213 | +10% $162 |
|---|---|---|---|---|---|
| Rent | -10% $125 | -5% $195 | +0% $264 | +5% $334 | +10% $404 |
| Rate | -1.0pp $355 | -0.5pp $310 | base $264 | +0.5pp $218 | +1.0pp $170 |
UW: 25.0% down · 7.5% · 30yr · 1.5% tax · 5.0% vac · 8.0% maint · 8.0% mgmt
Financing live
Cash to close
- Down payment
- $44,998
- Closing costs
- $5,400
- Reserves months
- —
- Total cash needed
- —
Loan-product check · same deal, 3 products live
Conventional
25% down · 7.5% · 30yr
- Down + closing
- —
- Monthly P&I
- —
- Monthly cashflow
- —
- DSCR
- —
- Eligible?
- —
Personal DTI + credit; lowest rate.
DSCR
20% down · 8.5% · 30yr
- Down + closing
- —
- Monthly P&I
- —
- Monthly cashflow
- —
- DSCR
- —
- Eligible?
- —
No personal income docs; deal must DSCR.
Hard money
10% down · 12.0% · 12mo
- Down + closing
- —
- Monthly P&I
- —
- Monthly cashflow
- —
- DSCR
- —
- Eligible?
- —
Short-term bridge; refi at stabilization.
Rent comps 1 comps
| Address | Beds | Baths | Sqft | Rent | $/sqft | DOM | Units | Dist |
|---|---|---|---|---|---|---|---|---|
| 12366 Sword Point Ct Willis, TX | 3.0 | 3.0 | 1206 | $1,750 | $1.45 | 45d | 1 | 0.32mi |
HOA detail
- Monthly dues
- $50 · $600/yr
Listing history 19 events
-
2026-06-21days on market $179,990 Active 212 DOM
-
2026-06-18days on market $179,990 Active 209 DOM
-
2026-06-17days on market $179,990 Active 208 DOM
-
2026-06-16days on market $179,990 Active 207 DOM
-
2026-06-15days on market $179,990 Active 206 DOM
-
2026-06-13days on market $179,990 Active 204 DOM
-
2026-06-10pricestatus $179,990 Active 200 DOM
-
2026-06-09days on market $197,990 Active Under Contract 200 DOM
-
2026-06-08days on market $197,990 Active Under Contract 199 DOM
-
2026-06-07days on market $197,990 Active Under Contract 198 DOM
-
2026-06-04days on market $197,990 Active Under Contract 195 DOM
-
2026-06-03days on market $197,990 Active Under Contract 194 DOM
-
2026-06-02days on market $197,990 Active Under Contract 193 DOM
-
2026-06-01days on market $197,990 Active Under Contract 192 DOM
-
2026-05-31days on market $197,990 Active Under Contract 191 DOM
-
2026-03-15historical Active Under Contract
-
2026-03-10price $197,990
-
2025-12-06price $198,990
-
2025-11-21$202,990 Active
ⓘ Source: listings_history table (triggers on properties + properties_extension) + one-shot
backfill from property_details.listing_events for pre-trigger history.
Tax reassessment forecast TX · Resets to sale price
- Current annual tax
- $749 · $62/mo
- Projected year-2 tax
- $3,294 · $274/mo
- Expected delta
- +$2,544/yr (+$212/mo · 339.6%)
ⓘ Screening estimate from a state-policy table — verify with the county assessor before closing.
Nearby sold comps map
Loading sold comps map…
Walkable amenities ~0.75 mi
Loading nearby amenities…
Taxation est. · year 1
- Rental income
- $21,200
- − Mortgage interest
- −$10,082
- − Property taxes
- −$749
- − Insurance
- −$900
- − Repairs & maintenance
- −$1,696
- − Management
- −$1,696
- − HOA
- −$600
- − Depreciation
- −$5,236
- Taxable income
- $241
- Est. tax owed @ 24.0%
- −$58
- After-tax cash flow
- $3,114/yr
For passive investors: Depreciation is non-cash, so a rental often shows a tax loss while cash-flowing — sheltering income. Rental losses are passive: they offset passive income freely, and up to $25,000/yr can offset ordinary (W-2) income if you actively participate and your MAGI is under $100k (phasing out to $0 by $150k); unused losses carry forward. On sale, claimed depreciation is recaptured at up to 25%, and gains may owe capital-gains tax (a 1031 exchange can defer both). Figures are a year-1 estimate at your 24.0% rate — not tax advice; consult a CPA.
Schools (NCES district)
- District
- Willis ISD
- NCES district ID
- 4845900
- Math proficiency
- 33% ▼ -15.00%
- Reading proficiency
- 40% ▼ -2.00%
- Median HH income
- $57,828
- Composite
- 32.32/100
- National rank
- #5746
- State rank
- #458 of 826 in TX
Livability — Cut and Shoot
- Score
- 56/100
- State rank
- #1326
- US rank
- #22835
Category grades
Schools grade is shown separately in the Schools card above.
Census & demographics
- County
- Montgomery County · 663,713 people
- Metro
- Houston-The Woodlands-Sugar Land, TX
- Population (ZIP)
- 28,854
- Household income
- $75,348
- Rent vs Own
- Severe rent burden
- 464.0
Population outlook (Montgomery County) Hauer SSP2
- Today (2025)
- 713,896 people
- By 2030
- 805,263 · +12.8%
- By 2040
- 992,708 · +39.1%
- By 2050
- 1,179,590 · +65.2%
- By 2075
- 1,628,084 · +128.1%
- By 2100
- 1,937,880 · +171.5%
Race, ethnicity, and origin ACS 2023
- Neighborhood character
- Diverse neighborhood (Simpson 0.56)
- Race & ethnicity
- White 54% Hispanic / Latino 38% Two or more races 17% Black 4%
- Hispanic origin (detail)
- Mexican 25%
- Common ancestry
- Lithuanian 1% Romanian 1% Slovak 1%
- Foreign-born
- 13% · Canada, Jamaica
- Languages at home
- 69% English-only · Spanish 31%
Political lean MEDSL · Montgomery
- 2024 margin
- Solid R (+45.5) · D 26.8% · R 72.3%
- 2008→2024 swing
- +7.2pp toward D · 2008: -52.7pp · 2024: -45.5pp
- All cycles
- 2024: R+45.5 2020: R+43.8 2016: R+51.4 2012: R+60.7 2008: R+52.7
Not yet ingested
- Civics
- —
Market trends
- HPI YoY
- ▼ -77.71%
- Current HPI
- 269.5367
- Rent YoY
- ▼ -0.31%
- Metro
- Houston-The Woodlands-Sugar Land, TX
- State GDP YoY
- ▲ 3.95%
- F500 in state
- 110
Industry mix (Fortune 500 HQ in TX)
| Industry | F500 HQs | Revenue |
|---|---|---|
| Energy | 16 | $1,198B |
|
||
| Technology | 5 | $198B |
|
||
| Engineering / Construction | 4 | $72B |
|
||
| Energy Services | 3 | $60B |
|
||
| Utilities | 3 | $41B |
|
||
| Healthcare | 2 | $330B |
|
||
Price history
-2.5% since first listed4 events — show timeline
- 2026-03-15 Contingent — HARMLS
- 2026-03-10 Price Changed $197,990 HARMLS
- 2025-12-06 Price Changed $198,990 HARMLS
- 2025-11-21 Listed $202,990 HARMLS
Cash-flow waterfall
monthlySold comps — $/sqft
last 12 mo · ≤1 miLoading sold comps…