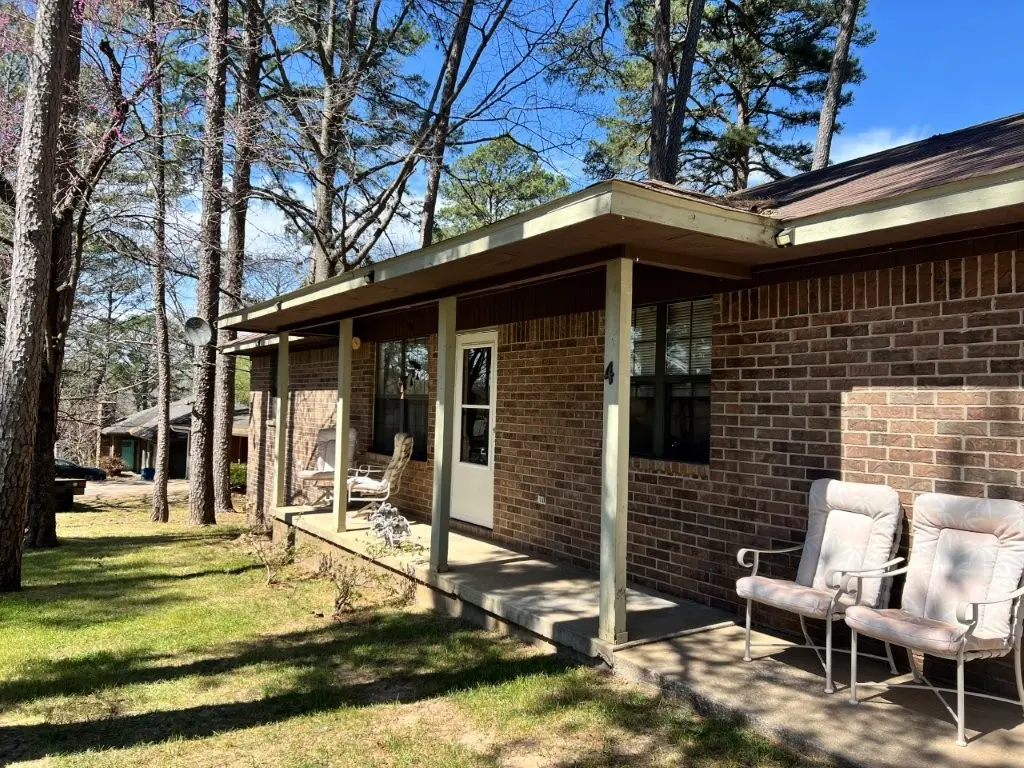
4 Oxford Ln · Bella Vista, AR
Flood risk 1/10 · Minimal
- FEMA flood zone
- X (unshaded)
- Chance of flooding over 30 yrs
- 0.0%
- Est. flood insurance / yr
- $507 – $1,088
Fire risk 3/10 · Minor
- Est. fire insurance / yr
- $1,499 – $2,785
Heat risk 5/10 · Moderate
- Hot days now (above 105°F)
- 7 days/yr
- Hot days in 30 yrs
- 20 days/yr
Wind risk 2/10 · Minimal
- Chance of severe wind over 30 yrs
- 1.0%
Air-quality risk 2/10 · Minimal
- Unhealthy air days now
- 0 days/yr
- Unhealthy air days in 30 yrs
- 1 days/yr
Risk factors via First Street. Map © Google.
Why this score? — see what drove the B grade
The composite is a weighted blend of 9 inputs, each scored 0–100. Each bar is that input's sub-score; the figure is the points it added to the 100-point composite (weight × sub-score).
- Cash flow +24.2/30.0
- ARV discount +15.0/15.0
- DSCR +7.8/10.0
- 1% rule +5.7/10.0
- Appreciation +5.7/10.0
- Schools +5.2/10.0
- Livability +3.4/5.0
- Rent growth +2.5/5.0
- Condition / age +2.5/5.0
$215,000
🖨 Deal sheet (PDF) 📄 Offer letter ✓ Due diligence
Listing remarks
3BR/2BA traditional home on a flat, level cul-de-sac lot in Bella Vista! Perfect for outdoor enthusiasts: located near premier mountain biking trails, just 2.3 miles from the Oz Trails bike lift, and within 1.5 miles of Lake Rayburn and Lake Ann. Enjoy seasonal golf course views right from home, with a shopping center under 1.5 miles away. Features a desirable split floor plan, 2-car garage, and concrete driveway. Access to amazing POA amenities like community pools and pickle ball courts.
Key facts
- Cul-de-sac lot
- Oz trails bike lift
- Lake rayburn
Tags
Property features AI
Finance
- HOA & community: HOA fees billed monthly; Community features include clubhouse, fitness center, golf, playground, pool, recreation area, sauna, tennis courts, lake, trails/paths, biking, shopping, park, and proximity to fire station
Exterior
- Parking: Attached garage with garage door opener; 2 covered parking spaces
- Security: Smoke detectors
- Utilities: Public water; Septic available (septic tank); Propane available; Cable available; Recycling collection
- Home design: Single-story home; Residential zoning; Entry on crawlspace; Built 25+ years ago
- Construction: Brick, block, concrete, and wood siding construction; Asphalt shingle roof; Crawlspace foundation
- Exterior features: Concrete driveway; Covered patio/porch; Deck; Porch; Lake access: Lake Ann; Located in a subdivision; Near park; Hardwood trees; Level lot; Cul-de-sac lot
Interior
- Kitchen: Dishwasher; Electric oven; Electric range; Range hood; Disposal; Refrigerator; Plumbed for ice maker
- Flooring: Carpet; Vinyl
- Bathrooms: 2 full bathrooms
- Heating & cooling: Central heating; Electric heating; Heat pump; Central air conditioning; Heat pump cooling
- Interior features: Attic; Ceiling fans; Split-bedroom layout; Storage
- Laundry & utility: Washer hookup; Dryer hookup
Neighborhood map
What this means for you Summary
Snapshot
- This is a 3-bed/2.0-bath single-family listed at $215k.
Deal economics
- At list price, monthly cash flow is $431 ($5k/yr) — positive.
- The deal already cash-flows at list — no discount required.
- Meets the 1% rule at list price ($2k rent vs $215k).
- Cap rate 8.7% vs local median 3.6% in Bella Vista — top-decile yield for the area; either an underpriced asset or a hidden risk that comps aren't pricing in. Stress-test before assuming the spread holds.
Location & tenants
- Location reads 67/100 on livability (#111 in AR) — a middle-class / working-renter tenant base. Strengths: cost of living A+, housing A+, schools A; Watch: amenities F, commute F, health & safety F.
- Bentonville School District (urban): math 59% / reading 59% proficiency, ranked #3 of 238 in AR (top 1%) — acceptable for families but not a draw, mixed tenant base, ~2y average lease.
- Market conditions: 484 active listings in the ZIP; 8 comparable units currently listed for rent nearby; rentals at typical pace (median 23d on market — plan ~3-4 weeks tenant-placement turnaround); solid renter incomes; 4,359 units permitted in Benton County in 2024 (402 in 5+ unit buildings).
Forward outlook
- In year one you build about $4k of equity ($1k loan paydown + $3k appreciation (1.4% local appreciation)).
- Benton County population projected at +56% by 2050 — long-run rental-demand tailwind backs the buy-and-hold thesis.
- At projected returns (1.4% appreciation + 3.0% rent growth), your $60k cash investment doubles in ~6 years — after that, you're playing with house money.
- By year 8, paydown + projected appreciation supports a ~$34k cash-out refi (75% LTV) — recoverable capital for the next deal without selling this one.
Negotiation context
- Only 4 days on market — expect competitive offers; lowballing is unlikely to land.
Risks & watch-outs
- Climate carrying-cost: extreme-heat days projected 7→20/yr by 2055 (HVAC capex compounding) — expect insurance premiums to compound above CPI over the hold.
Questions for the listing agent
- Is there a deadline driving the sale (1031 exchange, divorce, estate, relocation)? That informs how much negotiation room exists.
- Schools are A-rated — typically a magnet for longer-tenancy family renters. What's the average tenant stay here, and is there a school-zone premium baked into asking?
- What's the average days-on-market for RENTAL listings here right now (not sales)? A rising rental-DOM trend means longer vacancies and softer asking-rent achievability than the comps imply.
- What's the recent tenant-quality profile in this submarket — average credit score on applications, eviction rate, late-payment / NSF rate, and stable-employment percentage? A property-management company in the area should have these aggregated.
- How much new for-sale + rental construction is in the pipeline within 1–3 miles? Heavy new supply typically softens prices + rents 12–24 months out; constrained supply supports both.
Investment metrics
- 1% rule
- 1.07% ✓
- Cap rate
- 8.70%
- Cash-on-cash
- 8.58%
- DSCR
- 1.38
- GRM
- 7.8
CMA / ARV
- ARV (on-the-fly)
- $278,194
- Comps found
- 8
Show comp detail 8 sales within ~0.75 mi
| Address | Dist | Beds/Ba | Sqft | Sold | Price | $/sf | Match |
|---|---|---|---|---|---|---|---|
| 11 Oxford Ln | 0.03mi | 3/2.0 | 1,244 (-3%) | 13mo | $273,100 | $220 | 83 |
| 12 Horatio Ln | 0.55mi | 3/2.0 | 1,316 (+3%) | 1mo | $285,000 | $217 | 70 |
| 1 Brighstone Ln | 0.73mi | 3/2.0 | 1,330 (+4%) | 3mo | $285,000 | $214 | 57 |
| 4 Horatio Ln | 0.56mi | 3/2.0 | 1,323 (+3%) | 16mo | $255,000 | $193 | 55 |
| 2 Witney Ln | 0.36mi | 2/2.0 (-1) | 1,143 (-11%) | 7mo | $314,900 | $276 | 54 |
| 56 Elizabeth Dr | 0.62mi | 2/2.0 (-1) | 1,380 (+8%) | 1mo | $290,000 | $210 | 53 |
| 6 Iffley Ln | 0.44mi | 3/2.0 | 1,451 (+13%) | 9mo | $370,000 | $255 | 50 |
| 6 Tibberton Circle Dr | 0.64mi | 2/1.5 (-1) | 1,404 (+10%) | 12mo | $255,000 | $182 | 37 |
Match score weights: distance 35% · size 25% · config 20% · recency 20%. Top-matched comps best support the ARV.
Projected returns pro-forma
1.38% appreciation · 3.0% rent growth · sell at horizon
- IRR
- 11.3%
- Equity multiple
- 1.59×
- Total profit
- $35,494
- Equity at exit
- $77,735
- IRR
- 14.7%
- Equity multiple
- 2.85×
- Total profit
- $111,582
- Equity at exit
- $106,744
Cash invested: $60,200 (down + closing). Projections, not guarantees.
Landlord ↔ Tenant lean methodology
- Overall (STATE)
- 92 Strongly Landlord-Friendly
- State Arkansas
- 92 Strongly Landlord-Friendly · R+14
- County
- — inherits STATE
- City
- — inherits STATE
ZIP-level market 72714
- Home prices YoY
- 0.5%
- Active inventory
- 484
- Price-to-rent
- 7.8×
Monthly cashflow live
- Estimated rent
- $2,297 high interval (Pro) →
- Mortgage (P&I)
- −$1,127
- Tax from tax record
- −$167 /mo · $2,001/yr
- Insurance
- −$90
- HOA
- −$0
- Vacancy / Maint / Mgmt
- −$482
- Net cashflow
- $431
Break-even live
Sensitivity live
| Price | -10% $552 | -5% $491 | +0% $431 | +5% $370 | +10% $309 |
|---|---|---|---|---|---|
| Rent | -10% $249 | -5% $340 | +0% $431 | +5% $521 | +10% $612 |
| Rate | -1.0pp $539 | -0.5pp $485 | base $431 | +0.5pp $375 | +1.0pp $318 |
UW: 25.0% down · 7.5% · 30yr · 1.5% tax · 5.0% vac · 8.0% maint · 8.0% mgmt
Financing live
Cash to close
- Down payment
- $53,750
- Closing costs
- $6,450
- Reserves months
- —
- Total cash needed
- —
Loan-product check · same deal, 3 products live
Conventional
25% down · 7.5% · 30yr
- Down + closing
- —
- Monthly P&I
- —
- Monthly cashflow
- —
- DSCR
- —
- Eligible?
- —
Personal DTI + credit; lowest rate.
DSCR
20% down · 8.5% · 30yr
- Down + closing
- —
- Monthly P&I
- —
- Monthly cashflow
- —
- DSCR
- —
- Eligible?
- —
No personal income docs; deal must DSCR.
Hard money
10% down · 12.0% · 12mo
- Down + closing
- —
- Monthly P&I
- —
- Monthly cashflow
- —
- DSCR
- —
- Eligible?
- —
Short-term bridge; refi at stabilization.
Rent comps 8 comps
| Address | Beds | Baths | Sqft | Rent | $/sqft | DOM | Units | Dist |
|---|---|---|---|---|---|---|---|---|
| 4 Kemble Cir Bella Vista, AR | 3.0 | 2.0 | 1376 | $1,850 | $1.34 | 25d | 1 | 0.83mi |
| 2 William Ln Bella Vista, AR | 3.0 | 2.0 | 1712 | $1,900 | $1.11 | 23d | 1 | 1.11mi |
| 2 William Ln Bella Vista, AR | 3.0 | 2.0 | 1712 | $1,850 | $1.08 | 16d | 1 | 1.11mi |
| 9 August Ln Unit 1363327P Bella Vista, AR | 2.0 | 1.5 | 1173 | $3,153 | $2.69 | 16d | 1 | 1.11mi |
| 1 Endon Cir Bella Vista, AR | 2.0 | 1.5 | 1040 | $1,295 | $1.25 | 15d | 1 | 1.14mi |
| 6 Connie Ln Bella Vista, AR | 3.0 | 2.0 | 1440 | $2,250 | $1.56 | 25d | 1 | 1.20mi |
| 10 Riordan Rd Unit 1221880P Bella Vista, AR | 2.0 | 2.0 | 882 | $4,248 | $4.82 | 25d | 1 | 1.37mi |
| 4 Sibsey Cir Unit 1230868P Bella Vista, AR | 3.0 | 2.0 | 1765 | $3,469 | $1.97 | 23d | 1 | 1.38mi |
Listing history 4 events
-
2026-06-01statusdays on market $215,000 Pending 4 DOM
-
2026-05-31days on market $215,000 Active 3 DOM
-
2026-05-31days on market $215,000 Active 2 DOM
-
2026-05-26$215,000 Active
ⓘ Source: listings_history table (triggers on properties + properties_extension) + one-shot
backfill from property_details.listing_events for pre-trigger history.
Tax reassessment forecast AR · Resets to sale price
- Current annual tax
- $2,001 · $167/mo
- Projected year-2 tax
- $2,001 · $167/mo
- Expected delta
- $0/yr ($0/mo · 0.0%)
ⓘ Screening estimate from a state-policy table — verify with the county assessor before closing.
Climate risk First Street
- Flood 1/10 Low FEMA zone X (unshaded) · 0% chance over 30 yrs
- Wildfire 3/10 Moderate
- Heat 5/10 Major 7 d/yr ≥105°F today · 20 d/yr by 30 yrs out
- Wind 2/10 Low 100% chance of damaging wind over 30 yrs
- Air quality 2/10 Low 0 unhealthy d/yr today · 1 by 30 yrs out
Nearby sold comps map
Loading sold comps map…
Walkable amenities ~0.75 mi
Loading nearby amenities…
Taxation est. · year 1
- Rental income
- $27,561
- − Mortgage interest
- −$12,043
- − Property taxes
- −$2,001
- − Insurance
- −$1,075
- − Repairs & maintenance
- −$2,205
- − Management
- −$2,205
- − Depreciation
- −$6,255
- Taxable income
- $1,777
- Est. tax owed @ 24.0%
- −$426
- After-tax cash flow
- $4,740/yr
For passive investors: Depreciation is non-cash, so a rental often shows a tax loss while cash-flowing — sheltering income. Rental losses are passive: they offset passive income freely, and up to $25,000/yr can offset ordinary (W-2) income if you actively participate and your MAGI is under $100k (phasing out to $0 by $150k); unused losses carry forward. On sale, claimed depreciation is recaptured at up to 25%, and gains may owe capital-gains tax (a 1031 exchange can defer both). Figures are a year-1 estimate at your 24.0% rate — not tax advice; consult a CPA.
Schools (NCES district)
- District
- Bentonville School District
- NCES district ID
- 0503060
- Math proficiency
- 59% ▼ -8.00%
- Reading proficiency
- 59% ▼ -6.00%
- Median HH income
- $66,721
- Composite
- 51.85/100
- National rank
- #1661
- State rank
- #3 of 238 in AR
Livability — Bella Vista
- Score
- 67/100
- State rank
- #111
- US rank
- #11129
Category grades
Schools grade is shown separately in the Schools card above.
Census & demographics
- Census place
- Bella Vista, AR
- County
- Benton County · 259,241 people
- City population
- 31,638
- Metro
- Fayetteville-Springdale-Rogers, AR
- Population (ZIP)
- 14,350
- Household income
- $103,125
- Rent vs Own
- Severe rent burden
- 61.0
Population outlook (Benton County) Hauer SSP2
- Today (2025)
- 318,683 people
- By 2030
- 353,481 · +10.9%
- By 2040
- 425,280 · +33.4%
- By 2050
- 497,239 · +56.0%
- By 2075
- 662,114 · +107.8%
- By 2100
- 776,431 · +143.6%
Race, ethnicity, and origin ACS 2023
- Neighborhood character
- Predominantly White (83%)
- Race & ethnicity
- White 83% Two or more races 11% Hispanic / Latino 6%
- Hispanic origin (detail)
- Mexican 2% Dominican 2%
- Common ancestry
- Slovak 4% Lithuanian 3% Italian 3%
- Foreign-born
- 3% · Canada
- Languages at home
- 98% English-only · Spanish 2%
Political lean MEDSL · Benton
- 2024 margin
- Strong R (+27.0) · D 35.2% · R 62.1% · Other 2.7%
- 2008→2024 swing
- +9.6pp toward D · 2008: -36.5pp · 2024: -27.0pp
- All cycles
- 2024: R+27.0 2020: R+26.4 2016: R+34.9 2012: R+40.4 2008: R+36.5
Not yet ingested
- Civics
- —
Market trends
- HPI YoY
- ▲ 1.38%
- Current HPI
- 307.5796
- Rent YoY
- —
- Metro
- Fayetteville-Springdale-Rogers, AR
- State GDP YoY
- ▲ 3.80%
- F500 in state
- 10
Industry mix (Fortune 500 HQ in AR)
| Industry | F500 HQs | Revenue |
|---|---|---|
| Retail | 1 | $681B |
|
||
| Food / Agriculture | 1 | $53B |
|
||
| Retail / Energy | 1 | $22B |
|
||
| Transportation / Logistics | 1 | $12B |
|
||
| Energy | 1 | $4B |
|
||
Price history
1 event — show timeline
- 2026-05-26 Listed $215,000 NWARMLS
Property tax history
+4.6%/yrLatest (2025): $2,001 · +9.8% YoY. Source: county tax records.
Cash-flow waterfall
monthlySold comps — $/sqft
last 12 mo · ≤1 miLoading sold comps…