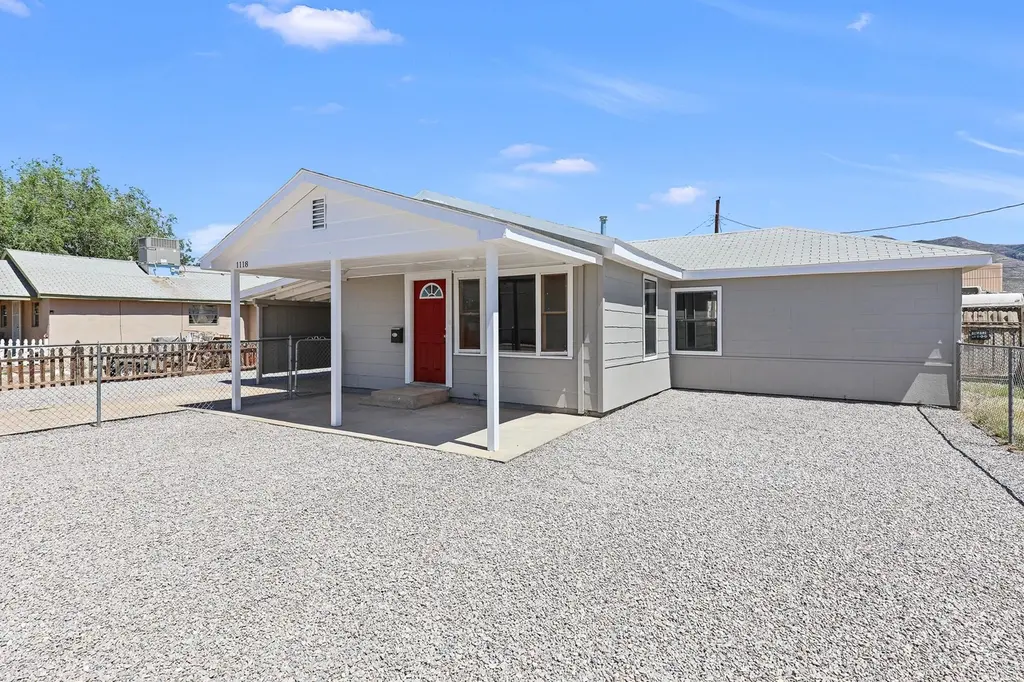
1118 Utah Ave · Alamogordo, NM
Flood risk 1/10 · Minimal
- FEMA flood zone
- AH
- Chance of flooding over 30 yrs
- 0.0%
- Est. flood insurance / yr
- $1,142 – $2,507
Fire risk 4/10 · Minor
- Est. fire insurance / yr
- $706 – $1,312
Heat risk 5/10 · Moderate
- Hot days now (above 98°F)
- 7 days/yr
- Hot days in 30 yrs
- 25 days/yr
Wind risk 1/10 · Minimal
- Chance of severe wind over 30 yrs
- —
Air-quality risk 1/10 · Minimal
- Unhealthy air days now
- 0 days/yr
- Unhealthy air days in 30 yrs
- 0 days/yr
Risk factors via First Street. Map © Google.
Why this score? — see what drove the D+ grade
The composite is a weighted blend of 9 inputs, each scored 0–100. Each bar is that input's sub-score; the figure is the points it added to the 100-point composite (weight × sub-score).
- Cash flow +19.4/30.0
- ARV discount +7.5/15.0
- DSCR +6.1/10.0
- 1% rule +4.1/10.0
- Livability +3.9/5.0
- Schools +3.0/10.0
- Rent growth +2.9/5.0
- Condition / age +2.5/5.0
- Appreciation +0.0/10.0
$155,000
🖨 Deal sheet (PDF) 📄 Offer letter ✓ Due diligence
Listing remarks MLS
Cute Move in Ready! Recently upgraded with Refrigerated Air. Darling little starter home and close to Shopping and Parks.
Key facts
- 6,534 sq ft lot
- Built 1955
- Listed 3 days
Neighborhood map
What this means for you Summary
Snapshot
- This is a 2-bed/1.0-bath single-family listed at $155k.
Deal economics
- At list price, monthly cash flow is $20 ($243/yr) — positive.
- The deal already cash-flows at list — no discount required.
- To meet the 1% rule (rent ≥ 1% of price), the offer needs to be $140k (9.5% below list).
- Recommended offer: $140k (9.5% below list) — sets the bar for 1% rule.
Location & tenants
- Location reads 77/100 on livability (#5 in NM, #3,233 nationally) — a middle-class / working-renter tenant base. Strengths: commute A+, cost of living A+, housing A+; Watch: crime D, employment D, schools F.
- Alamogordo Public Schools (town): math 26% / reading 39% proficiency, ranked #26 of 95 in NM (top 27%) — families likely to look elsewhere, expect single-tenant / working-renter base with shorter leases.
- Market conditions: Rents rising (+1.6%/yr); 449 active listings in the ZIP; 10 comparable units currently listed for rent nearby; rentals at typical pace (median 23d on market — plan ~3-4 weeks tenant-placement turnaround); 6 units permitted in Otero County in 2024 (0 in 5+ unit buildings).
Forward outlook
- Local home prices are declining (-3.0%/yr); year-one equity from $1k of loan paydown is wiped out by about $5k of value loss. Plan a longer hold.
- Otero County population projected to shrink 7% by 2050 — rents likely to lag national; underwrite the cash flow, not the appreciation.
Negotiation context
- Only 3 days on market — expect competitive offers; lowballing is unlikely to land.
- 2 sale attempts since 6y ago with the ask held roughly flat each time — persistent listings suggest the price (not the market) is what's stuck; bring a comps-based counter.
Risks & watch-outs
- Watch-outs: flood insurance adds $152/mo; built in 1955 — expect roof / HVAC / electrical / plumbing capex.
- Climate carrying-cost: in FEMA flood zone AH (mandatory federal flood insurance); extreme-heat days projected 7→25/yr by 2055 (HVAC capex compounding) — expect insurance premiums to compound above CPI over the hold.
Questions for the listing agent
- Built in 1955 — when were the roof, HVAC, electrical panel, plumbing, and water heater last replaced?
- What's the actual annual flood-insurance premium (NFIP or private), and is the property in a SFHA with mandatory coverage?
- Is there a deadline driving the sale (1031 exchange, divorce, estate, relocation)? That informs how much negotiation room exists.
- Schools are F-rated, which usually means shorter tenancies and higher turnover. Who's the typical renter profile here, and what's been the actual vacancy rate?
- Crime grade is D in this area — have there been break-ins, vandalism, or insurance claims at this property in the last 3 years? What carrier currently insures it and at what premium?
- The area grade is low — what's the realistic commute time and amenity access for the typical tenant pool here? Any planned neighborhood developments (good or bad) we should know about?
- What's the average days-on-market for RENTAL listings here right now (not sales)? A rising rental-DOM trend means longer vacancies and softer asking-rent achievability than the comps imply.
- What's the recent tenant-quality profile in this submarket — average credit score on applications, eviction rate, late-payment / NSF rate, and stable-employment percentage? A property-management company in the area should have these aggregated.
- How much new for-sale + rental construction is in the pipeline within 1–3 miles? Heavy new supply typically softens prices + rents 12–24 months out; constrained supply supports both.
Investment metrics
- 1% rule
- 0.91% ✗
- Cap rate
- 7.63%
- Cash-on-cash
- 4.76%
- DSCR
- 1.21
- GRM
- 9.2
CMA / ARV
No comps found within radius.
Projected returns pro-forma
-3.0% appreciation · 1.65% rent growth · sell at horizon
- IRR
- -16.9%
- Equity multiple
- 0.41×
- Total profit
- $-25,674
- Equity at exit
- $23,111
- IRR
- -11.5%
- Equity multiple
- 0.35×
- Total profit
- $-28,076
- Equity at exit
- $13,402
Cash invested: $43,400 (down + closing). Projections, not guarantees.
Landlord ↔ Tenant lean methodology
- Overall (STATE)
- 55 Moderately Landlord-Leaning
- State New Mexico
- 55 Moderately Landlord-Leaning · D+3
- County
- — inherits STATE
- City
- — inherits STATE
ZIP-level market 88310
- Rents YoY
- 1.6%
- Active inventory
- 449
- Price-to-rent
- 9.2×
Monthly cashflow live
- Estimated rent
- $1,403 high interval (Pro) →
- Mortgage (P&I)
- −$813
- Tax from tax record
- −$59 /mo · $705/yr
- Insurance
- −$65
- Flood insurance flood zone
- −$152 /mo · $1,824/yr
- HOA
- −$0
- Vacancy / Maint / Mgmt
- −$295
- Net cashflow
- $20
Break-even live
Sensitivity live
| Price | -10% $108 | -5% $64 | +0% $20 | +5% $-24 | +10% $-67 |
|---|---|---|---|---|---|
| Rent | -10% $-91 | -5% $-35 | +0% $20 | +5% $76 | +10% $131 |
| Rate | -1.0pp $98 | -0.5pp $60 | base $20 | +0.5pp $-20 | +1.0pp $-61 |
UW: 25.0% down · 7.5% · 30yr · 1.5% tax · 5.0% vac · 8.0% maint · 8.0% mgmt
Financing live
Cash to close
- Down payment
- $38,750
- Closing costs
- $4,650
- Reserves months
- —
- Total cash needed
- —
Loan-product check · same deal, 3 products live
Conventional
25% down · 7.5% · 30yr
- Down + closing
- —
- Monthly P&I
- —
- Monthly cashflow
- —
- DSCR
- —
- Eligible?
- —
Personal DTI + credit; lowest rate.
DSCR
20% down · 8.5% · 30yr
- Down + closing
- —
- Monthly P&I
- —
- Monthly cashflow
- —
- DSCR
- —
- Eligible?
- —
No personal income docs; deal must DSCR.
Hard money
10% down · 12.0% · 12mo
- Down + closing
- —
- Monthly P&I
- —
- Monthly cashflow
- —
- DSCR
- —
- Eligible?
- —
Short-term bridge; refi at stabilization.
Rent comps 10 comps
| Address | Beds | Baths | Sqft | Rent | $/sqft | DOM | Units | Dist |
|---|---|---|---|---|---|---|---|---|
| 1301 Jefferson Ave Unit LAST ONE AVAILABLE!! Alamogordo, NM | 2.0 | 2.0 | 892 | $1,425 | $1.60 | 5d | 1 | 0.22mi |
| 1301 Fillmore Ave Alamogordo, NM | 2.0 | 1.0 | 967 | $1,095 | $1.13 | 46d | 2 | 0.36mi |
| 1514 Utah Ave Alamogordo, NM | 2.0 | 1.0 | 1119 | $1,450 | $1.30 | 16d | 1 | 0.41mi |
| 1905 12th St Alamogordo, NM | 2.0 | 1.0 | 704 | $850 | $1.21 | 16d | 1 | 0.41mi |
| 2300 Aspen Dr Alamogordo, NM | 3.0 | 2.0 | 1368 | $1,400 | $1.02 | 5d | 1 | 0.63mi |
| 2637 Las Alturas Ct Alamogordo, NM | 3.0 | 2.0 | 1366 | $1,600 | $1.17 | 45d | 1 | 0.87mi |
| 2200 1st St Alamogordo, NM | 1.0–3.0 | 1.0–3.0 | 1011 | $1,654 | $1.64 | 5d | 18 | 1.16mi |
| 2201 Mesa Ln Alamogordo, NM | 3.0 | 2.0 | 1408 | $3,000 | $2.13 | 25d | 1 | 1.23mi |
| 2360 Mesa Ln Alamogordo, NM | 3.0 | 2.0 | 1173 | $1,600 | $1.36 | 25d | 1 | 1.28mi |
| 2509 Pecan Dr Unit 11D Alamogordo, NM | 2.0 | 1.0 | 735 | $975 | $1.33 | 23d | 1 | 1.37mi |
Listing history 6 events
-
2026-04-16status Pending
-
2026-04-12$155,000 Active
-
2022-07-08soldstatus 121-char remark
Show marketing remark (121 chars)
Cute Move in Ready! Recently upgraded with Refrigerated Air. Darling little starter home and close to Shopping and Parks.
-
2021-01-28soldstatus
-
2020-10-22$77,900 121-char remark
Show marketing remark (121 chars)
Cute Move in Ready! Recently upgraded with Refrigerated Air. Darling little starter home and close to Shopping and Parks.
-
2008-07-30soldstatus
ⓘ Source: listings_history table (triggers on properties + properties_extension) + one-shot
backfill from property_details.listing_events for pre-trigger history.
Tax reassessment forecast NM · Resets to sale price
- Current annual tax
- $705 · $59/mo
- Projected year-2 tax
- $1,240 · $103/mo
- Expected delta
- +$535/yr (+$45/mo · 76.0%)
ⓘ Screening estimate from a state-policy table — verify with the county assessor before closing.
Climate risk First Street
- Flood 1/10 Low FEMA zone AH · 0% chance over 30 yrs
- Wildfire 4/10 Moderate
- Heat 5/10 Major 7 d/yr ≥98°F today · 25 d/yr by 30 yrs out
- Wind 1/10 Low
- Air quality 1/10 Low 0 unhealthy d/yr today · 0 by 30 yrs out
Nearby sold comps map
Loading sold comps map…
Walkable amenities ~0.75 mi
Loading nearby amenities…
Taxation est. · year 1
- Rental income
- $16,837
- − Mortgage interest
- −$8,682
- − Property taxes
- −$705
- − Insurance
- −$2,600
- − Repairs & maintenance
- −$1,347
- − Management
- −$1,347
- − Depreciation
- −$4,509
- Taxable loss
- −$2,352
- Est. tax savings @ 24.0%
- +$565
- After-tax cash flow
- $808/yr
For passive investors: Depreciation is non-cash, so a rental often shows a tax loss while cash-flowing — sheltering income. Rental losses are passive: they offset passive income freely, and up to $25,000/yr can offset ordinary (W-2) income if you actively participate and your MAGI is under $100k (phasing out to $0 by $150k); unused losses carry forward. On sale, claimed depreciation is recaptured at up to 25%, and gains may owe capital-gains tax (a 1031 exchange can defer both). Figures are a year-1 estimate at your 24.0% rate — not tax advice; consult a CPA.
Schools (NCES district)
- District
- Alamogordo Public Schools
- NCES district ID
- 3500030
- Math proficiency
- 26% —
- Reading proficiency
- 39% —
- Median HH income
- $42,194
- Composite
- 30.24/100
- National rank
- #11572
- State rank
- #26 of 95 in NM
Livability — Alamogordo
- Score
- 77/100
- State rank
- #5
- US rank
- #3233
Category grades
Schools grade is shown separately in the Schools card above.
Census & demographics
- Census place
- Alamogordo, NM
- County
- Otero County · 36,983 people
- City population
- 36,983
- Metro
- Alamogordo, NM
- Population (ZIP)
- 36,983
- Household income
- $57,214
- Rent vs Own
- Severe rent burden
- 1231.0
Population outlook (Otero County) Hauer SSP2
- Today (2025)
- 62,967 people
- By 2030
- 62,164 · -1.3%
- By 2040
- 60,253 · -4.3%
- By 2050
- 58,575 · -7.0%
- By 2075
- 55,411 · -12.0%
- By 2100
- 48,551 · -22.9%
Race, ethnicity, and origin ACS 2023
- Neighborhood character
- Diverse neighborhood (Simpson 0.59)
- Race & ethnicity
- White 56% Hispanic / Latino 31% Two or more races 18% Black 5% Asian 2% Native American 2%
- Hispanic origin (detail)
- Mexican 25%
- Common ancestry
- Slovak 3% Lithuanian 2% Italian 1%
- Foreign-born
- 6% · Canada
- Languages at home
- 85% English-only · Spanish 12% Tagalog/Filipino 1%
Political lean MEDSL · Otero
- 2024 margin
- Strong R (+27.0) · D 35.4% · R 62.4% · Other 2.2%
- 2008→2024 swing
- -7.7pp toward R · 2008: -19.3pp · 2024: -27.0pp
- All cycles
- 2024: R+27.0 2020: R+25.6 2016: R+29.1 2012: R+28.0 2008: R+19.3
Not yet ingested
- Civics
- —
Market trends
- HPI YoY
- ▼ -174.88%
- Current HPI
- 181.737
- Rent YoY
- ▲ 1.65%
- Metro
- Alamogordo, NM
- State GDP YoY
- —
- F500 in state
- 0
Price history
+99.0% since first listed6 events — show timeline
- 2026-04-16 Pending — OCAOR
- 2026-04-12 Listed $155,000 OCAOR
- 2022-07-08 Sold (MLS) — OCAOR
- 2021-01-28 Sold (Public Records) — Public Records
- 2020-10-22 Listed $77,900 OCAOR
- 2008-07-30 Sold (Public Records) — Public Records
Property tax history
+4.2%/yrLatest (2025): $705 · +3.5% YoY. Source: county tax records.
Cash-flow waterfall
monthlySold comps — $/sqft
last 12 mo · ≤1 miLoading sold comps…