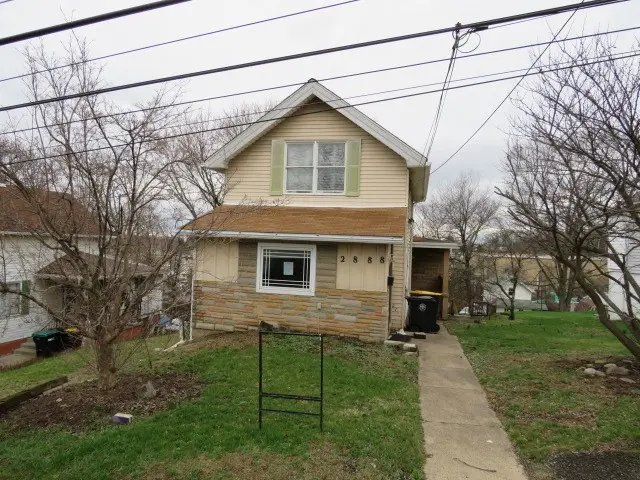
2888 Maple St · Bethel Park, PA
Flood risk 1/10 · Minimal
- FEMA flood zone
- X (unshaded)
- Chance of flooding over 30 yrs
- 0.0%
- Est. flood insurance / yr
- $473 – $860
Fire risk 1/10 · Minimal
- Est. fire insurance / yr
- $511 – $949
Heat risk 3/10 · Minor
- Hot days now (above 96°F)
- 7 days/yr
- Hot days in 30 yrs
- 17 days/yr
Wind risk 2/10 · Minimal
- Chance of severe wind over 30 yrs
- —
Air-quality risk 3/10 · Minor
- Unhealthy air days now
- 2 days/yr
- Unhealthy air days in 30 yrs
- 4 days/yr
Risk factors via First Street. Map © Google.
Why this score? — see what drove the B- grade
The composite is a weighted blend of 9 inputs, each scored 0–100. Each bar is that input's sub-score; the figure is the points it added to the 100-point composite (weight × sub-score).
- Cash flow +28.5/30.0
- DSCR +10.0/10.0
- 1% rule +7.5/10.0
- ARV discount +7.5/15.0
- Schools +5.6/10.0
- Livability +4.2/5.0
- Rent growth +3.9/5.0
- Condition / age +2.5/5.0
- Appreciation +0.0/10.0
$128,750
🖨 Deal sheet (PDF) 📄 Offer letter ✓ Due diligence
Listing remarks
Spacious two story home located in the heart of Bethel Park. Plenty of counter and cabinet space in the kitchen. Convenient first floor laundry room in the full bathroom. Upstairs you will find both bedrooms and the half bathroom. Partially finished lower level with a second laundry room and additional storage space. Minutes to Rt 88, the T station, shops, restaurants, and more.
Key facts
- Two story home
- Second laundry room
- 7,840 sq ft lot
Tags
Neighborhood map
What this means for you Summary
Snapshot
- This is a 2-bed/1.5-bath single-family listed at $129k.
Deal economics
- At list price, monthly cash flow is $420 ($5k/yr) — positive.
- The deal already cash-flows at list — no discount required.
- Meets the 1% rule at list price ($2k rent vs $129k).
- Recommended offer: $127k (1.5% below list) — sets the bar for market timing.
- Cap rate 10.2% vs local median 3.1% in Bethel Park — top-decile yield for the area; either an underpriced asset or a hidden risk that comps aren't pricing in. Stress-test before assuming the spread holds.
Location & tenants
- Location reads 85/100 on livability (#70 in PA, #483 nationally) — a professional / high-income tenant draw. Strengths: crime A+, employment A+, cost of living A+; Watch: amenities C-, commute F.
- Bethel Park SD (suburban): math 52% / reading 76% proficiency, ranked #50 of 539 in PA (top 9%) — acceptable for families but not a draw, mixed tenant base, ~2y average lease; only 11% free/reduced lunch — higher-income household profile.
- Zoned schools: Benjamin Franklin El Sch (math 62% / reading 87%, grade A, #89 of 1,518 statewide, top 7%, 327 students, 20% FRL); Neil Armstrong 5-6 Ms (math 47% / reading 74%, grade B+, #39 of 512 statewide, top 8%, 583 students, 19% FRL); Bethel Park Hs (math 75% / reading 24%, grade D+, #135 of 437 statewide, top 31%, 1,338 students, 16% FRL).
- Market conditions: Rents rising fast (+5.4%/yr); 89 active listings in the ZIP; 8 comparable units currently listed for rent nearby; rentals leasing fast (median 10d on market — plan ~1-2 weeks tenant-placement turnaround); solid renter incomes; 2,996 units permitted in Allegheny County in 2024 (1,588 in 5+ unit buildings).
- This rent is only 18% of the median local income ($109k/yr) — well below the 30% rent-burden line; pricing power to push rent on renewal without tenant pushback.
Forward outlook
- Local home prices are declining (-3.0%/yr); year-one equity from $890 of loan paydown is wiped out by about $4k of value loss. Plan a longer hold.
- At projected returns (-3.0% appreciation + 5.4% rent growth), your $36k cash investment doubles in ~7 years — after that, you're playing with house money.
Negotiation context
- It's been on market 18 days — a 2% lower offer ($127k) is reasonable based on typical stale-listing flexibility.
Risks & watch-outs
- Watch-outs: built in 1920 — expect roof / HVAC / electrical / plumbing capex.
Questions for the listing agent
- Built in 1920 — when were the roof, HVAC, electrical panel, plumbing, and water heater last replaced?
- Is there a deadline driving the sale (1031 exchange, divorce, estate, relocation)? That informs how much negotiation room exists.
- Schools are A-rated — typically a magnet for longer-tenancy family renters. What's the average tenant stay here, and is there a school-zone premium baked into asking?
- What's the average days-on-market for RENTAL listings here right now (not sales)? A rising rental-DOM trend means longer vacancies and softer asking-rent achievability than the comps imply.
- What's the recent tenant-quality profile in this submarket — average credit score on applications, eviction rate, late-payment / NSF rate, and stable-employment percentage? A property-management company in the area should have these aggregated.
- How much new for-sale + rental construction is in the pipeline within 1–3 miles? Heavy new supply typically softens prices + rents 12–24 months out; constrained supply supports both.
Investment metrics
- 1% rule
- 1.25% ✓
- Cap rate
- 10.21%
- Cash-on-cash
- 13.99%
- DSCR
- 1.62
- GRM
- 6.6
CMA / ARV
- ARV (on-the-fly)
- $257,697
- Comps found
- 12
Show comp detail 12 sales within ~0.75 mi
| Address | Dist | Beds/Ba | Sqft | Sold | Price | $/sf | Match |
|---|---|---|---|---|---|---|---|
| 2828 Oak St | 0.16mi | 2/1.5 | 1,244 (+1%) | 6mo | $121,000 | $97 | 86 |
| 2861 Maple St | 0.07mi | 3/1.0 (+1) | 1,208 (-2%) | 6mo | $168,000 | $139 | 81 |
| 5195 Texas Ave | 0.31mi | 3/2.0 (+1) | 1,222 (-1%) | 2mo | $292,000 | $239 | 76 |
| 2833 Oak St | 0.17mi | 3/2.0 (+1) | 1,372 (+11%) | 1mo | $285,000 | $208 | 66 |
| 2735 Bertha St | 0.44mi | 3/1.5 (+1) | 1,134 (-8%) | 2mo | $262,000 | $231 | 60 |
| 348 Logan Rd | 0.48mi | 3/2.0 (+1) | 1,318 (+7%) | 4mo | $275,000 | $209 | 56 |
| 224 Logan Rd | 0.62mi | 3/1.5 (+1) | 1,275 (+3%) | 6mo | $245,000 | $192 | 55 |
| 362 Church Rd | 0.49mi | 3/2.0 (+1) | 1,404 (+14%) | 3mo | $325,000 | $231 | 44 |
| 3218 Eastview Rd | 0.70mi | 3/2.0 (+1) | 1,360 (+10%) | 0mo | $273,000 | $201 | 43 |
| 3217 Elderwood Dr | 0.60mi | 3/2.0 (+1) | 1,085 (-12%) | 3mo | $195,000 | $180 | 42 |
| 1166 Sarah St | 0.65mi | 3/1.5 (+1) | 1,057 (-14%) | 0mo | $280,000 | $265 | 41 |
| 5579 Florida Ave | 0.66mi | 3/2.0 (+1) | 1,392 (+13%) | 2mo | $299,900 | $215 | 39 |
Match score weights: distance 35% · size 25% · config 20% · recency 20%. Top-matched comps best support the ARV.
Projected returns pro-forma
-3.0% appreciation · 5.44% rent growth · sell at horizon
- IRR
- 6.9%
- Equity multiple
- 1.28×
- Total profit
- $9,975
- Equity at exit
- $19,197
- IRR
- 18.2%
- Equity multiple
- 2.68×
- Total profit
- $60,685
- Equity at exit
- $11,132
Cash invested: $36,050 (down + closing). Projections, not guarantees.
Landlord ↔ Tenant lean methodology
- Overall (STATE)
- 62 Landlord-Friendly
- State Pennsylvania
- 62 Landlord-Friendly · EVEN
- County
- — inherits STATE
- City
- — inherits STATE
ZIP-level market 15102
- Rents YoY
- 5.4%
- Active inventory
- 89
- Price-to-rent
- 6.6×
Monthly cashflow live
- Estimated rent
- $1,614 high interval (Pro) →
- Mortgage (P&I)
- −$675
- Tax from tax record
- −$126 /mo · $1,508/yr
- Insurance
- −$54
- HOA
- −$0
- Vacancy / Maint / Mgmt
- −$339
- Net cashflow
- $420
Break-even live
Sensitivity live
| Price | -10% $493 | -5% $457 | +0% $420 | +5% $384 | +10% $348 |
|---|---|---|---|---|---|
| Rent | -10% $293 | -5% $357 | +0% $420 | +5% $484 | +10% $548 |
| Rate | -1.0pp $485 | -0.5pp $453 | base $420 | +0.5pp $387 | +1.0pp $353 |
UW: 25.0% down · 7.5% · 30yr · 1.5% tax · 5.0% vac · 8.0% maint · 8.0% mgmt
Financing live
Cash to close
- Down payment
- $32,188
- Closing costs
- $3,862
- Reserves months
- —
- Total cash needed
- —
Loan-product check · same deal, 3 products live
Conventional
25% down · 7.5% · 30yr
- Down + closing
- —
- Monthly P&I
- —
- Monthly cashflow
- —
- DSCR
- —
- Eligible?
- —
Personal DTI + credit; lowest rate.
DSCR
20% down · 8.5% · 30yr
- Down + closing
- —
- Monthly P&I
- —
- Monthly cashflow
- —
- DSCR
- —
- Eligible?
- —
No personal income docs; deal must DSCR.
Hard money
10% down · 12.0% · 12mo
- Down + closing
- —
- Monthly P&I
- —
- Monthly cashflow
- —
- DSCR
- —
- Eligible?
- —
Short-term bridge; refi at stabilization.
Rent comps 8 comps
| Address | Beds | Baths | Sqft | Rent | $/sqft | DOM | Units | Dist |
|---|---|---|---|---|---|---|---|---|
| 2898 Maple St Bethel Park, PA | 2.0 | 1.0 | 1124 | $1,629 | $1.45 | 22d | 1 | 0.06mi |
| 3106 S Park Rd Bethel Park, PA | 2.0 | 1.0 | 1428 | $1,500 | $1.05 | 9d | 1 | 0.47mi |
| 336 Logan Rd Bethel Park, PA | 3.0 | 2.0 | 1497 | $2,200 | $1.47 | 23d | 1 | 0.51mi |
| 5560 Library Rd Bethel Park, PA | 1.0–2.0 | 1.0 | 715 | $1,299 | $1.82 | 5d | 2 | 0.66mi |
| 102 Sonnybrook Ct Bethel Park, PA | 3.0 | 2.5 | 1280 | $1,795 | $1.40 | 6d | 1 | 0.72mi |
| 3302 S Park Rd Bethel Park, PA | 3.0 | 2.0 | 1300 | $1,850 | $1.42 | 0d | 1 | 0.83mi |
| 5751 Pebble Creek Ct Unit 5102 Bethel Park, PA | 2.0 | 1.0 | 1100 | $1,350 | $1.23 | 45d | 1 | 0.88mi |
| 5 Dorchester Dr Pittsburgh, PA | 1.0–2.0 | 1.0–1.5 | 837 | $1,652 | $1.97 | 0d | 46 | 1.23mi |
Listing history 3 events
-
2026-04-06status Pending
-
2026-03-31historical Contingent
-
2026-03-19$128,750 Active
ⓘ Source: listings_history table (triggers on properties + properties_extension) + one-shot
backfill from property_details.listing_events for pre-trigger history.
Tax reassessment forecast PA · Partial reset (capped growth)
- Current annual tax
- $1,508 · $126/mo
- Projected year-2 tax
- $1,771 · $148/mo
- Expected delta
- +$263/yr (+$22/mo · 17.5%)
ⓘ Screening estimate from a state-policy table — verify with the county assessor before closing.
Climate risk First Street
- Flood 1/10 Low FEMA zone X (unshaded) · 0% chance over 30 yrs
- Wildfire 1/10 Low
- Heat 3/10 Moderate 7 d/yr ≥96°F today · 17 d/yr by 30 yrs out
- Wind 2/10 Low
- Air quality 3/10 Moderate 2 unhealthy d/yr today · 4 by 30 yrs out
Nearby sold comps map
Loading sold comps map…
Walkable amenities ~0.75 mi
Loading nearby amenities…
Taxation est. · year 1
- Rental income
- $19,366
- − Mortgage interest
- −$7,212
- − Property taxes
- −$1,508
- − Insurance
- −$644
- − Repairs & maintenance
- −$1,549
- − Management
- −$1,549
- − Depreciation
- −$3,745
- Taxable income
- $3,158
- Est. tax owed @ 24.0%
- −$758
- After-tax cash flow
- $4,287/yr
For passive investors: Depreciation is non-cash, so a rental often shows a tax loss while cash-flowing — sheltering income. Rental losses are passive: they offset passive income freely, and up to $25,000/yr can offset ordinary (W-2) income if you actively participate and your MAGI is under $100k (phasing out to $0 by $150k); unused losses carry forward. On sale, claimed depreciation is recaptured at up to 25%, and gains may owe capital-gains tax (a 1031 exchange can defer both). Figures are a year-1 estimate at your 24.0% rate — not tax advice; consult a CPA.
Schools (NCES district)
- District
- Bethel Park SD
- NCES district ID
- 4203510
- Math proficiency
- 52% ▼ -16.00%
- Reading proficiency
- 76% ▼ -8.00%
- Median HH income
- $67,758
- Composite
- 56.0/100
- National rank
- #1194
- State rank
- #50 of 539 in PA
Livability — Bethel Park
- Score
- 85/100
- State rank
- #70
- US rank
- #483
Category grades
Schools grade is shown separately in the Schools card above.
Census & demographics
- Census place
- Bethel Park, PA
- County
- Allegheny County · 1,022,028 people
- City population
- 30,344
- Metro
- Pittsburgh, PA
- Population (ZIP)
- 30,344
- Household income
- $108,966
- Rent vs Own
- Severe rent burden
- 581.0
Population outlook (Allegheny County) Hauer SSP2
- Today (2025)
- 1,250,282 people
- By 2030
- 1,256,482 · +0.5%
- By 2040
- 1,256,318 · +0.5%
- By 2050
- 1,244,169 · -0.5%
- By 2075
- 1,197,693 · -4.2%
- By 2100
- 1,093,187 · -12.6%
Race, ethnicity, and origin ACS 2023
- Neighborhood character
- Predominantly White (93%)
- Race & ethnicity
- White 93% Two or more races 3% Asian 2% Black 1%
- Common ancestry
- Romanian 13% Lithuanian 2% Slovak 2%
- Foreign-born
- 4% · Canada
- Languages at home
- 95% English-only · Other Indo-European 2% Arabic 1% Spanish 1%
Political lean MEDSL · Allegheny
- 2024 margin
- Strong D (+20.3) · D 59.7% · R 39.4%
- 2008→2024 swing
- +4.8pp toward D · 2008: 15.5pp · 2024: 20.3pp
- All cycles
- 2024: D+20.3 2020: D+20.4 2016: D+16.4 2012: D+14.4 2008: D+15.5
Not yet ingested
- Civics
- —
Market trends
- HPI YoY
- ▼ -227.97%
- Current HPI
- 256.7682
- Rent YoY
- ▲ 5.44%
- Metro
- Pittsburgh, PA
- State GDP YoY
- ▲ 1.68%
- F500 in state
- 34
Industry mix (Fortune 500 HQ in PA)
| Industry | F500 HQs | Revenue |
|---|---|---|
| Healthcare | 2 | $309B |
|
||
| Insurance | 2 | $27B |
|
||
| Telecommunications / Media | 1 | $124B |
|
||
| Industrial Distribution | 1 | $22B |
|
||
| Financial Services | 1 | $20B |
|
||
| Chemicals / Materials | 1 | $18B |
|
||
Price history
3 events — show timeline
- 2026-04-06 Pending — West Penn MLS
- 2026-03-31 Contingent — West Penn MLS
- 2026-03-19 Listed $128,750 West Penn MLS
Property tax history
+2.0%/yrLatest (2026): $1,508 · +5.1% YoY. Source: county tax records.
Cash-flow waterfall
monthlySold comps — $/sqft
last 12 mo · ≤1 miLoading sold comps…