 Duplex
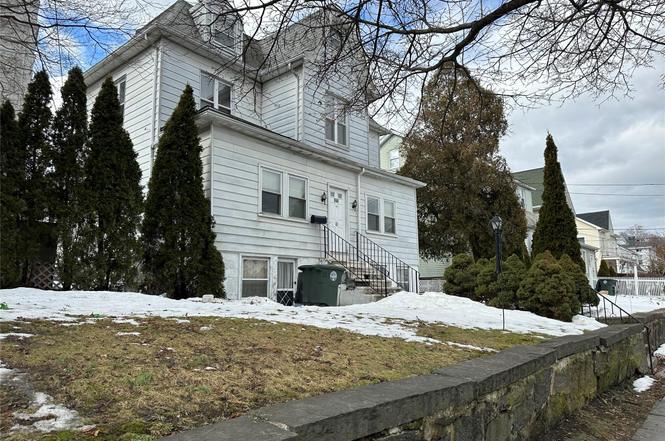
164 Highland St · Port Chester, NY
Flood risk 1/10 · Minimal
- FEMA flood zone
- X (unshaded)
- Chance of flooding over 30 yrs
- 0.0%
- Est. flood insurance / yr
- $507 – $1,088
Fire risk 1/10 · Minimal
- Est. fire insurance / yr
- $691 – $1,283
Heat risk 6/10 · Moderate
- Hot days now (above 98°F)
- 7 days/yr
- Hot days in 30 yrs
- 17 days/yr
Wind risk 6/10 · Moderate
- Chance of severe wind over 30 yrs
- 55.0%
Air-quality risk 4/10 · Minor
- Unhealthy air days now
- 5 days/yr
- Unhealthy air days in 30 yrs
- 7 days/yr
Risk factors via First Street. Map © Google.
Why this score? — see what drove the D grade
The composite is a weighted blend of 9 inputs, each scored 0–100. Each bar is that input's sub-score; the figure is the points it added to the 100-point composite (weight × sub-score).
- Cash flow +15.2/30.0
- ARV discount +7.3/15.0
- 1% rule +4.8/10.0
- DSCR +4.7/10.0
- Schools +4.1/10.0
- Livability +3.7/5.0
- Condition / age +2.5/5.0
- Rent growth +2.1/5.0
- Appreciation +0.0/10.0
$669,000
🖨 Deal sheet (PDF) 📄 Offer letter ✓ Due diligence
Multi-family units
County records classify this as Multi-Family (2-4 Unit). Listing-text estimate: 2 units. confirmed
Listing remarks
Opportunity Awaits! Strong Upside Potential! Large multifamily property offering exceptional space, flexibility, and future potential. Featuring 5 bedrooms and 2 full bathrooms, this unique property includes duplex style units ideal for owner occupancy, multigenerational living, or investment income. Large entry Sunporch on front plus Bright enclosed sunroom that overlooks the spacious backyard, creating additional living space filled with natural light. With Easy walkout to the backyard and side yard, it offers added convenience and privacy. Generous outdoor areas offer room for entertaining, gardening, or relaxation. Expansive Attic presents tremendous potential for future expansion. C
Key facts
- Large entry sunporch
- Spacious backyard
- Duplex style units
Tags
Neighborhood map
What this means for you Summary
Snapshot
- This is a 2 × 2-bed/?-bath units multifamily listed at $669k.
Deal economics
- At list price, monthly cash flow is $230 ($3k/yr) — positive. Per door: $115/mo.
- The deal already cash-flows at list — no discount required.
- To meet the 1% rule (rent ≥ 1% of price), the offer needs to be $658k (1.7% below list).
- Recommended offer: $658k (1.7% below list) — sets the bar for 1% rule.
- Cap rate 6.7% vs local median 4.3% in Port Chester — top-decile yield for the area; either an underpriced asset or a hidden risk that comps aren't pricing in. Stress-test before assuming the spread holds.
Location & tenants
- Location reads 73/100 on livability (#315 in NY) — a middle-class / working-renter tenant base. Strengths: commute A+, employment A+, health & safety A; Watch: amenities D, cost of living F.
- Port Chester-Rye Union Free School District (suburban): math 44% / reading 49% proficiency, ranked #428 of 590 in NY (top 72%) — families likely to look elsewhere, expect single-tenant / working-renter base with shorter leases.
- Zoned schools: King Street School (math 22% / reading 47%, grade F, #1,577 of 2,108 statewide, top 77%, 412 students, 60% FRL); Port Chester Middle School (math 20% / reading 43%, grade F, #522 of 729 statewide, top 73%, 971 students, 75% FRL); Port Chester Senior High School (math 88% / reading 92%, grade A+, #238 of 1,100 statewide, top 23%, 1,555 students, 73% FRL).
- Market conditions: Rents soft (-1.7%/yr); 144 active listings in the ZIP; 40 comparable units currently listed for rent nearby; rentals at typical pace (median 24d on market — plan ~3-4 weeks tenant-placement turnaround); solid renter incomes; 954 units permitted in Westchester County in 2024 (649 in 5+ unit buildings).
- At $6,575/mo this rent would consume 75% of the median local household income ($106k/yr) (locally 1362% of renters already pay >50% of income on rent) — very limited rent-growth headroom before tenants either downsize or default.
Forward outlook
- Local home prices are declining (-3.0%/yr); year-one equity from $5k of loan paydown is wiped out by about $20k of value loss. Plan a longer hold.
- Westchester County population projected at +10% by 2050 — modest demand growth; plan on rents tracking national, not racing it.
Negotiation context
- It's been on market 19 days — a 2% lower offer ($659k) is reasonable based on typical stale-listing flexibility.
- 8 sale attempts since 21y ago with the ask held roughly flat each time — persistent listings suggest the price (not the market) is what's stuck; bring a comps-based counter.
- Current owner paid $505k; 32% above their basis — modest negotiation headroom, anchor on the comps not their cost.
Risks & watch-outs
- Watch-outs: built in 1890 — expect roof / HVAC / electrical / plumbing capex.
- Climate carrying-cost: major wind risk, 55% chance of damaging wind over 30y; extreme-heat days projected 7→17/yr by 2055 (HVAC capex compounding) — expect insurance premiums to compound above CPI over the hold.
Questions for the listing agent
- Can we see the unit-by-unit rent roll, current vacancy, and any below-market leases? What's the average tenancy length?
- What capital expenditures (roof, boiler, parking lot, exteriors) have been made in the last 5 years, and what's planned in the next 2?
- Built in 1890 — when were the roof, HVAC, electrical panel, plumbing, and water heater last replaced?
- Is there a deadline driving the sale (1031 exchange, divorce, estate, relocation)? That informs how much negotiation room exists.
- Schools are D-rated, which usually means shorter tenancies and higher turnover. Who's the typical renter profile here, and what's been the actual vacancy rate?
- The area grade is low — what's the realistic commute time and amenity access for the typical tenant pool here? Any planned neighborhood developments (good or bad) we should know about?
- What's the average days-on-market for RENTAL listings here right now (not sales)? A rising rental-DOM trend means longer vacancies and softer asking-rent achievability than the comps imply.
- What's the recent tenant-quality profile in this submarket — average credit score on applications, eviction rate, late-payment / NSF rate, and stable-employment percentage? A property-management company in the area should have these aggregated.
- How much new apartment / multifamily construction is in the pipeline within 1–3 miles? Heavy new supply (>2% of stock underway) typically softens rents 12–24 months out; light construction supports rent growth.
Investment metrics
- 1% rule
- 0.98% ✗
- Cap rate
- 6.70%
- Cash-on-cash
- 1.47%
- DSCR
- 1.07
- GRM
- 8.5
CMA / ARV
- ARV (on-the-fly)
- $666,690
- Comps found
- 8
Show comp detail 8 sales within ~0.75 mi
| Address | Dist | Beds/Ba | Sqft | Sold | Price | $/sf | Match |
|---|---|---|---|---|---|---|---|
| 280 Locust Ave | 0.24mi | 3/2.0 | 1,554 (-1%) | 9mo | $645,000 | $415 | 80 |
| 37 Washington St | 0.44mi | 3/2.0 | 1,590 (+2%) | 13mo | $675,000 | $425 | 66 |
| 558 Locust Ave | 0.58mi | 3/2.0 | 1,656 (+6%) | 7mo | $705,000 | $426 | 57 |
| 43 Washington St | 0.45mi | 4/3.0 (+1) | 1,452 (-7%) | 6mo | $665,000 | $458 | 53 |
| 412 W William St | 0.73mi | 3/2.0 | 1,566 (+0%) | 17mo | $680,000 | $434 | 52 |
| 332 Locust Ave | 0.34mi | 4/3.0 (+1) | 1,480 (-5%) | 19mo | $610,000 | $412 | 51 |
| 40 Exchange Pl | 0.37mi | 4/2.0 (+1) | 1,716 (+10%) | 19mo | $830,000 | $484 | 46 |
| 312 William St | 0.61mi | 4/2.0 (+1) | 1,718 (+10%) | 14mo | $730,000 | $425 | 39 |
Match score weights: distance 35% · size 25% · config 20% · recency 20%. Top-matched comps best support the ARV.
Projected returns pro-forma
-3.0% appreciation · 0.0% rent growth · sell at horizon
- IRR
- -17.6%
- Equity multiple
- 0.40×
- Total profit
- $-112,748
- Equity at exit
- $99,750
- IRR
- -17.3%
- Equity multiple
- 0.19×
- Total profit
- $-152,565
- Equity at exit
- $57,843
Cash invested: $187,320 (down + closing). Projections, not guarantees.
Landlord ↔ Tenant lean methodology
- Overall (STATE)
- 15 Strongly Tenant-Friendly
- State New York
- 15 Strongly Tenant-Friendly · D+10
- County
- — inherits STATE
- City
- — inherits STATE
ZIP-level market 10573
- Rents YoY
- -1.7%
- Active inventory
- 144
- Price-to-rent
- 17.0×
Monthly cashflow live
- Estimated rent
- $6,575 high interval (Pro) →
- Mortgage (P&I)
- −$3,508
- Tax from tax record
- −$1,178 /mo · $14,132/yr
- Insurance
- −$279
- HOA
- −$0
- Vacancy / Maint / Mgmt
- −$1,381
- Net cashflow
- $230
Break-even live
Sensitivity live
| Price | -10% $608 | -5% $419 | +0% $230 | +5% $40 | +10% $-149 |
|---|---|---|---|---|---|
| Rent | -10% $-290 | -5% $-30 | +0% $230 | +5% $489 | +10% $749 |
| Rate | -1.0pp $566 | -0.5pp $400 | base $230 | +0.5pp $56 | +1.0pp $-120 |
2-unit breakdown (identical units grouped — click to expand)
| Units | Beds | Baths | Est. rent |
|---|---|---|---|
| 2× units | 2 | — | $6,574 |
| #1 | 2 | — | $3,287 |
| #2 | 2 | — | $3,287 |
| Total (2 units) | $6,575 | ||
UW: 25.0% down · 7.5% · 30yr · 1.5% tax · 5.0% vac · 8.0% maint · 8.0% mgmt
Financing live
Cash to close
- Down payment
- $167,250
- Closing costs
- $20,070
- Reserves months
- —
- Total cash needed
- —
Loan-product check · same deal, 3 products live
Conventional
25% down · 7.5% · 30yr
- Down + closing
- —
- Monthly P&I
- —
- Monthly cashflow
- —
- DSCR
- —
- Eligible?
- —
Personal DTI + credit; lowest rate.
DSCR
20% down · 8.5% · 30yr
- Down + closing
- —
- Monthly P&I
- —
- Monthly cashflow
- —
- DSCR
- —
- Eligible?
- —
No personal income docs; deal must DSCR.
Hard money
10% down · 12.0% · 12mo
- Down + closing
- —
- Monthly P&I
- —
- Monthly cashflow
- —
- DSCR
- —
- Eligible?
- —
Short-term bridge; refi at stabilization.
Rent comps 40 comps
| Address | Beds | Baths | Sqft | Rent | $/sqft | DOM | Units | Dist |
|---|---|---|---|---|---|---|---|---|
| 201 Willett Ave Port Chester, NY | 2.0 | 1.0–2.0 | 817 | $4,691 | $5.74 | 8d | 1 | 0.09mi |
| 169 N Main St Port Chester, NY | 2.0 | 1.0–2.0 | 799 | $4,652 | $5.82 | 2d | 43 | 0.13mi |
| 21 Willett Ave Port Chester, NY | 2.0–3.0 | 1.0–2.0 | 1199 | $4,950 | $4.13 | 2d | 1 | 0.19mi |
| 20 Church St W Unit A24 Greenwich, CT | 3.0 | 2.0 | 1578 | $10,500 | $6.65 | 3d | 1 | 0.30mi |
| 88 S Water St #107 Greenwich, CT | 2.0 | 2.0 | 1256 | $6,300 | $5.02 | 2d | 1 | 0.32mi |
| 19 Edison Pl Unit 2 Port Chester, NY | 3.0 | 2.0 | 1500 | $3,800 | $2.53 | 13d | 1 | 0.39mi |
| Westchester Ave Unit A Port Chester, NY | 2.0 | 2.0 | 1102 | $3,015 | $2.74 | 25d | 1 | 0.39mi |
| 5 Wellington Pl Unit B Greenwich, CT | 3.0 | 2.0 | 1152 | $4,500 | $3.91 | 44d | 1 | 0.45mi |
| 11 Madison Ave Unit 2nd Fl Port Chester, NY | 3.0 | 1.0 | 1200 | $3,700 | $3.08 | 25d | 1 | 0.46mi |
| 144 Pine St Unit D Greenwich, CT | 2.0 | 1.5 | 1120 | $2,950 | $2.63 | 15d | 1 | 0.47mi |
| 10 Prospect St W Greenwich, CT | 4.0 | 2.0 | 1784 | $7,495 | $4.20 | 2d | 1 | 0.51mi |
| 82 Putnam Ave Port Chester, NY | 3.0 | 1.0 | 1200 | $3,600 | $3.00 | 44d | 1 | 0.53mi |
| 347 Delavan Ave Unit A Greenwich, CT | 3.0 | 2.5 | 2158 | $5,500 | $2.55 | 19d | 1 | 0.54mi |
| 71 Byram Rd Unit 2 Greenwich, CT | 3.0 | 2.0 | 1200 | $3,400 | $2.83 | 24d | 1 | 0.54mi |
| 89 View St W Unit 2nd floor Greenwich, CT | 3.0 | 2.0 | 1870 | $5,450 | $2.91 | 19d | 1 | 0.55mi |
| 411 Westchester Ave Port Chester, NY | 2.0 | 2.0 | 1250 | $3,015 | $2.41 | 17d | 1 | 0.60mi |
| 98 Byram Shore Rd Greenwich, CT | 3.0 | 2.0 | 2000 | $6,950 | $3.48 | 2d | 1 | 0.63mi |
| 321 Olivia St Apt 1 Port Chester, NY | 4.0 | 3.0 | 2040 | $4,500 | $2.21 | 44d | 1 | 0.74mi |
| 70 Riverdale Ave #1001 Greenwich, CT | 2.0 | 2.5 | 1960 | $5,500 | $2.81 | 15d | 1 | 0.78mi |
| 124 Ritch Ave W Greenwich, CT | 1.0–3.0 | 1.0–2.0 | 1238 | $8,750 | $7.07 | 2d | 3 | 0.90mi |
| 9 1/2 Putnam Grn Greenwich, CT | 1.0–3.0 | 1.0–2.5 | 1234 | $6,577 | $5.33 | 2d | 19 | 0.91mi |
| 494 W William St Unit 1st Floor Rye Brook, NY | 2.0 | 2.0 | 1244 | $3,685 | $2.96 | 44d | 1 | 0.94mi |
| 494 W William St Port Chester, NY | 2.0 | 2.0 | 1370 | $3,685 | $2.69 | 44d | 1 | 0.94mi |
| 68 Pemberwick Rd Unit 1 Greenwich, CT | 3.0 | 1.5 | 1300 | $4,000 | $3.08 | 44d | 1 | 1.01mi |
| 83 Grant St Unit 2 Port Chester, NY | 2.0 | 1.0 | 1200 | $3,000 | $2.50 | 25d | 1 | 1.02mi |
| 108 Monica Rd Unit 4 Greenwich, CT | 3.0 | 1.5 | 1364 | $3,775 | $2.77 | 22d | 1 | 1.03mi |
| 34 Windy Knls Unit A Greenwich, CT | 3.0 | 3.0 | 2146 | $7,500 | $3.49 | 3d | 1 | 1.03mi |
| 250 S Ridge St Unit 2 Rye Brook, NY | 3.0 | 1.0 | 1350 | $3,800 | $2.81 | 25d | 1 | 1.05mi |
| 81 Pemberwick Rd Unit A Greenwich, CT | 2.0 | 3.5 | 2092 | $4,950 | $2.37 | 44d | 1 | 1.07mi |
| 42 Tower Hill Dr Port Chester, NY | 4.0 | 1.5 | 1864 | $5,100 | $2.74 | 44d | 1 | 1.10mi |
| 22 Wyman St Rye Brook, NY | 3.0 | 1.0 | 1193 | $3,500 | $2.93 | 44d | 1 | 1.14mi |
| 45 Moshier St Unit A Greenwich, CT | 3.0 | 2.0 | 1373 | $5,000 | $3.64 | 11d | 1 | 1.24mi |
| 2 Grange St Unit 2 Greenwich, CT | 3.0 | 1.0 | 1092 | $3,800 | $3.48 | 22d | 1 | 1.25mi |
| 2 Grange St Unit 2 Greenwich, CT | 3.0 | 1.0 | 1092 | $3,800 | $3.48 | 24d | 1 | 1.25mi |
| 38 Gerry St Unit 2 Greenwich, CT | 2.0 | 1.0 | 1100 | $2,995 | $2.72 | 22d | 1 | 1.31mi |
| 37 Gerry St Unit A Greenwich, CT | 3.0 | 2.0 | 1700 | $4,975 | $2.93 | 44d | 1 | 1.32mi |
| 147 Holly Hill Ln #9 Greenwich, CT | 2.0 | 2.5 | 2200 | $9,000 | $4.09 | 24d | 1 | 1.35mi |
| 147 Holly Hill Ln #2 Greenwich, CT | 2.0 | 2.5 | 2200 | $12,000 | $5.45 | 24d | 1 | 1.35mi |
| 147 Holly Hill Ln Greenwich, CT | 2.0 | 2.5 | 1611 | $11,000 | $6.83 | 44d | 2 | 1.35mi |
| 16 Harold Ave Apt 2 Greenwich, CT | 3.0 | 1.0 | 1686 | $2,800 | $1.66 | 44d | 1 | 1.41mi |
Listing history 23 events
-
2026-03-16status Pending
-
2026-02-25$669,000 Active
-
2026-01-14soldstatus $505,000
-
2018-08-31historical
-
2017-10-08historical Pending
-
2016-11-17price $399,000
-
2016-11-17status Active
-
2016-05-05historical Pending
-
2016-01-29$299,000 Active
-
2012-02-19historical
-
2011-07-07historical Pending
-
2011-02-18Active
-
2010-11-07historical
-
2010-10-11status Active
-
2010-10-08historical
-
2010-08-09price
-
2010-05-07Active
-
2006-12-27soldstatus $555,000
-
2006-11-01soldstatus $525,000
-
2006-11-01price $579,500
-
2006-02-20$525,000
-
2005-12-21historical
-
2005-09-23
ⓘ Source: listings_history table (triggers on properties + properties_extension) + one-shot
backfill from property_details.listing_events for pre-trigger history.
Tax reassessment forecast NY · Partial reset (capped growth)
- Current annual tax
- $14,132 · $1,178/mo
- Projected year-2 tax
- $14,132 · $1,178/mo
- Expected delta
- $0/yr ($0/mo · 0.0%)
ⓘ Screening estimate from a state-policy table — verify with the county assessor before closing.
Climate risk First Street
- Flood 1/10 Low FEMA zone X (unshaded) · 0% chance over 30 yrs
- Wildfire 1/10 Low
- Heat 6/10 Major 7 d/yr ≥98°F today · 17 d/yr by 30 yrs out
- Wind 6/10 Major 55% chance of damaging wind over 30 yrs
- Air quality 4/10 Moderate 5 unhealthy d/yr today · 7 by 30 yrs out
Nearby sold comps map
Loading sold comps map…
Walkable amenities ~0.75 mi
Loading nearby amenities…
Taxation est. · year 1
- Rental income
- $78,900
- − Mortgage interest
- −$37,474
- − Property taxes
- −$14,132
- − Insurance
- −$3,345
- − Repairs & maintenance
- −$6,312
- − Management
- −$6,312
- − Depreciation
- −$19,462
- Taxable loss
- −$8,137
- Est. tax savings @ 24.0%
- +$1,953
- After-tax cash flow
- $4,707/yr
For passive investors: Depreciation is non-cash, so a rental often shows a tax loss while cash-flowing — sheltering income. Rental losses are passive: they offset passive income freely, and up to $25,000/yr can offset ordinary (W-2) income if you actively participate and your MAGI is under $100k (phasing out to $0 by $150k); unused losses carry forward. On sale, claimed depreciation is recaptured at up to 25%, and gains may owe capital-gains tax (a 1031 exchange can defer both). Figures are a year-1 estimate at your 24.0% rate — not tax advice; consult a CPA.
Schools (NCES district)
- District
- Port Chester-Rye Union Free School District
- NCES district ID
- 3623460
- Math proficiency
- 44% ▲ 2.00%
- Reading proficiency
- 49% ▲ 6.00%
- Median HH income
- $58,362
- Composite
- 40.67/100
- National rank
- #3676
- State rank
- #428 of 590 in NY
Livability — Port Chester
- Score
- 73/100
- State rank
- #315
- US rank
- #5245
Category grades
Schools grade is shown separately in the Schools card above.
Census & demographics
- Census place
- Port Chester, NY
- County
- Westchester County · 709,332 people
- City population
- 40,786
- Metro
- New York-Newark-Jersey City, NY-NJ-PA
- Population (ZIP)
- 40,786
- Household income
- $105,686
- Rent vs Own
- Severe rent burden
- 1362.0
Population outlook (Westchester County) Hauer SSP2
- Today (2025)
- 1,028,035 people
- By 2030
- 1,051,636 · +2.3%
- By 2040
- 1,098,520 · +6.9%
- By 2050
- 1,136,044 · +10.5%
- By 2075
- 1,196,925 · +16.4%
- By 2100
- 1,175,147 · +14.3%
Race, ethnicity, and origin ACS 2023
- Neighborhood character
- Diverse neighborhood (Simpson 0.61)
- Race & ethnicity
- Hispanic / Latino 48% White 40% Two or more races 16% Black 5% Asian 4%
- Hispanic origin (detail)
- Mexican 7% Puerto Rican 6% Dominican 3%
- Common ancestry
- Romanian 3% Scotch-Irish 2% Italian 1%
- Foreign-born
- 37% · Canada, Jamaica, China
- Languages at home
- 50% English-only · Spanish 41% Other Indo-European 5% Chinese 1%
Political lean MEDSL · Westchester
- 2024 margin
- Strong D (+26.3) · D 63.1% · R 36.9%
- 2008→2024 swing
- -1.3pp toward R · 2008: 27.6pp · 2024: 26.3pp
- All cycles
- 2024: D+26.3 2020: D+36.3 2016: D+32.8 2012: D+22.2 2008: D+27.6
Not yet ingested
- Civics
- —
Market trends
- HPI YoY
- ▼ -389.46%
- Current HPI
- 258.9227
- Rent YoY
- ▼ -1.70%
- Metro
- New York-Newark-Jersey City, NY-NJ-PA
- State GDP YoY
- ▲ 2.60%
- F500 in state
- 92
Industry mix (Fortune 500 HQ in NY)
| Industry | F500 HQs | Revenue |
|---|---|---|
| Financial Services | 10 | $950B |
|
||
| Consumer Goods | 9 | $162B |
|
||
| Insurance | 4 | $225B |
|
||
| Telecommunications | 2 | $144B |
|
||
| Pharmaceuticals | 2 | $112B |
|
||
| Media / Entertainment | 2 | $69B |
|
||
Price history
+27.4% since first listed23 events — show timeline
- 2026-03-16 Pending — OneKey® MLS as Distributed by MLS Grid
- 2026-02-25 Listed $669,000 OneKey® MLS as Distributed by MLS Grid
- 2026-01-14 Sold (Public Records) $505,000 Public Records
- 2018-08-31 Listing Removed — OneKey® MLS as Distributed by MLS Grid
- 2017-10-08 Contingent — OneKey® MLS as Distributed by MLS Grid
- 2016-11-17 Relisted — OneKey® MLS as Distributed by MLS Grid
- 2016-11-17 Price Changed $399,000 OneKey® MLS as Distributed by MLS Grid
- 2016-05-05 Contingent — OneKey® MLS as Distributed by MLS Grid
- 2016-01-29 Listed $299,000 OneKey® MLS as Distributed by MLS Grid
- 2012-02-19 Delisted — HGMLS
- 2011-07-07 Contingent — HGMLS
- 2011-02-18 Listed — HGMLS
- 2010-11-07 Delisted — HGMLS
- 2010-10-11 Relisted — HGMLS
- 2010-10-08 Delisted — HGMLS
- 2010-08-09 Price Changed — HGMLS
- 2010-05-07 Listed — HGMLS
- 2006-12-27 Sold (Public Records) $555,000 Public Records
- 2006-11-01 Price Changed $579,500 HGMLS
- 2006-11-01 Sold (MLS) $525,000 HGMLS
- 2006-02-20 Listed $525,000 HGMLS
- 2005-12-21 Delisted — HGMLS
- 2005-09-23 Listed — HGMLS
Property tax history
+0.4%/yrLatest (2025): $14,132 · +9.1% YoY. Source: county tax records.
Cash-flow waterfall
monthlySold comps — $/sqft
last 12 mo · ≤1 miLoading sold comps…