1123 NW 24th Ter · Cape Coral, FL
Flood risk 4/10 · Minor
- FEMA flood zone
- X (unshaded)
- Chance of flooding over 30 yrs
- 0.2%
- Est. flood insurance / yr
- $507 – $1,088
Fire risk 6/10 · Moderate
- Est. fire insurance / yr
- $947 – $1,759
Heat risk 10/10 · Severe
- Hot days now (above 107°F)
- 7 days/yr
- Hot days in 30 yrs
- 30 days/yr
Wind risk 10/10 · Severe
- Chance of severe wind over 30 yrs
- 99.0%
Air-quality risk 2/10 · Minimal
- Unhealthy air days now
- 1 days/yr
- Unhealthy air days in 30 yrs
- 1 days/yr
Risk factors via First Street. Map © Google.
Why this score? — see what drove the C+ grade
The composite is a weighted blend of 9 inputs, each scored 0–100. Each bar is that input's sub-score; the figure is the points it added to the 100-point composite (weight × sub-score).
- Cash flow +27.2/30.0
- DSCR +9.5/10.0
- ARV discount +7.5/15.0
- 1% rule +6.3/10.0
- Schools +4.1/10.0
- Livability +3.9/5.0
- Condition / age +2.5/5.0
- Rent growth +1.1/5.0
- Appreciation +0.0/10.0
$199,000
🖨 Deal sheet 📄 Offer letter ✓ Due diligence
Listing remarks MLS
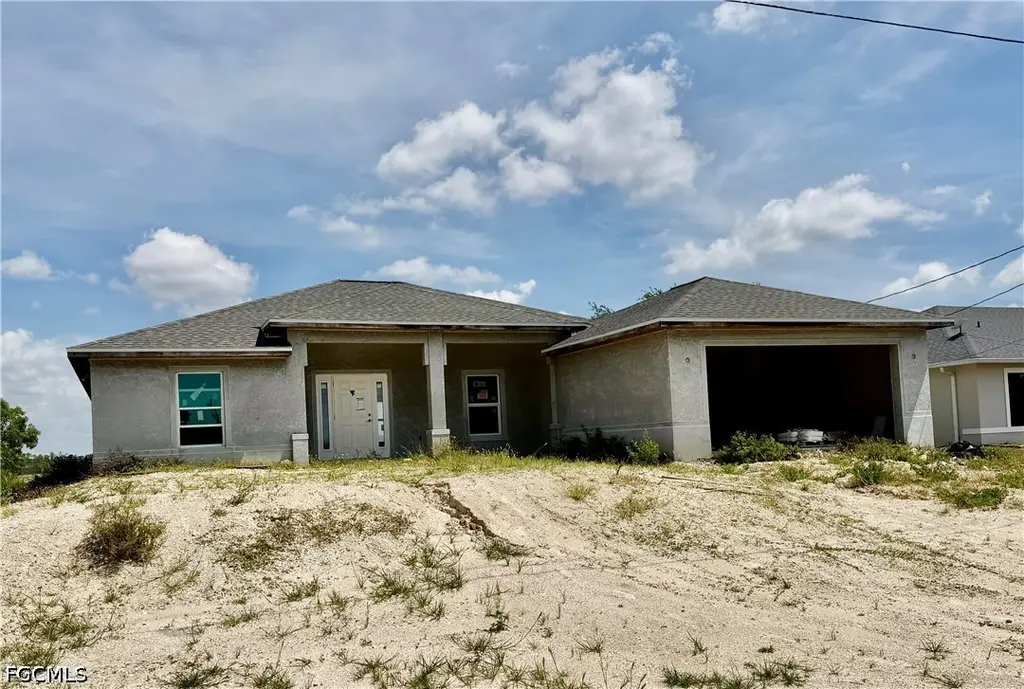
Fantastic opportunity to build your dream home on this CANAL front lot in popular NW Cape Coral. Great location on a quiet street, provides easy access to shops, services, dining and all your practical everyday needs. Take a drive by today and secure your own little slice of SW Florida paradise!
Key facts
- Peaceful water views
- Near local parks
- Freshwater canal
Tags
Property features AI
Finance
- Other: Zoned R1-W; Lot dimensions approximately 80 x 125
- Financial info: Pets allowed
- HOA & community: No association fee reported
Exterior
- Parking: Attached garage with 2 covered spaces; Driveway; Paved parking
- Security:
- Utilities: Cable available; Private sewer; Well water
- Home design: Single-story home; Entry at level 1; Facing south; Under construction
- Construction: Block, concrete and stucco construction; Shingle roof
- Exterior features: Patio; Lanai; Screened porch; Porch; Room for a pool; Canal access waterfront; North exposure; Paved road access; Rectangular lot
Interior
- Kitchen:
- Bedrooms: Bedrooms arranged in a split layout
- Flooring: Tile flooring; Vinyl flooring
- Bathrooms: Three full bathrooms; Shower-only configuration for at least one bathroom; Separate shower
- Heating & cooling:
- Interior features: Tray ceilings; Split bedroom floorplan; Shower-only bath with separate shower; Walk-in closet(s); Casement windows, sliding windows, impact glass, and shutters; Unfurnished
- Laundry & utility: Laundry inside the home
Neighborhood map
What this means for you Summary
Snapshot
- This is a 4-bed/3.0-bath land listed at $199k.
Deal economics
- At list price, monthly cash flow is $571 ($7k/yr) — positive.
- The deal already cash-flows at list — no discount required.
- Meets the 1% rule at list price ($2k rent vs $199k).
- Cap rate 9.7% vs local median 3.1% in Cape Coral — top-decile yield for the area; either an underpriced asset or a hidden risk that comps aren't pricing in. Stress-test before assuming the spread holds.
Location & tenants
- Location reads 77/100 on livability (#208 in FL, #3,098 nationally) — a middle-class / working-renter tenant base. Strengths: housing A+, health & safety A+, amenities B+; Watch: commute F.
- Lee (suburban): math 47% / reading 50% proficiency, ranked #42 of 73 in FL (top 58%) — families likely to look elsewhere, expect single-tenant / working-renter base with shorter leases.
- Market conditions: Rents falling (-5.5%/yr); 2652 active listings in the ZIP; 40 comparable units currently listed for rent nearby; rentals at typical pace (median 20d on market — plan ~3-4 weeks tenant-placement turnaround); solid renter incomes; 15,411 units permitted in Lee County in 2024 (4,686 in 5+ unit buildings).
Forward outlook
- Local home prices are declining (-3.0%/yr); year-one equity from $1k of loan paydown is wiped out by about $6k of value loss. Plan a longer hold.
- Lee County population projected at +44% by 2050 — long-run rental-demand tailwind backs the buy-and-hold thesis.
Negotiation context
- Only 12 days on market — expect competitive offers; lowballing is unlikely to land.
- 2 sale attempts since 5y ago with the ask held roughly flat each time — persistent listings suggest the price (not the market) is what's stuck; bring a comps-based counter.
- Current owner paid $32k; list at $199k implies a 522% gain — meaningful room to come down on a strong offer.
Risks & watch-outs
- Climate carrying-cost: severe wind risk, 99% chance of damaging wind over 30y; major wildfire risk; extreme-heat days projected 7→30/yr by 2055 (HVAC capex compounding) — expect insurance premiums to compound above CPI over the hold.
Questions for the listing agent
- Is there a deadline driving the sale (1031 exchange, divorce, estate, relocation)? That informs how much negotiation room exists.
- Schools are B-rated — typically a magnet for longer-tenancy family renters. What's the average tenant stay here, and is there a school-zone premium baked into asking?
- What's the average days-on-market for RENTAL listings here right now (not sales)? A rising rental-DOM trend means longer vacancies and softer asking-rent achievability than the comps imply.
- What's the recent tenant-quality profile in this submarket — average credit score on applications, eviction rate, late-payment / NSF rate, and stable-employment percentage? A property-management company in the area should have these aggregated.
- How much new for-sale + rental construction is in the pipeline within 1–3 miles? Heavy new supply typically softens prices + rents 12–24 months out; constrained supply supports both.
Investment metrics
- 1% rule
- 1.13% ✓
- Cap rate
- 9.74%
- Cash-on-cash
- 12.31%
- DSCR
- 1.55
- GRM
- 7.4
CMA / ARV
No comps found within radius.
Projected returns pro-forma
-3.0% appreciation · 0.0% rent growth · sell at horizon
- IRR
- -1.2%
- Equity multiple
- 0.95×
- Total profit
- $-2,522
- Equity at exit
- $29,672
- IRR
- 5.2%
- Equity multiple
- 1.34×
- Total profit
- $18,868
- Equity at exit
- $17,206
Cash invested: $55,720 (down + closing). Projections, not guarantees.
Landlord ↔ Tenant lean methodology
- Overall (STATE)
- 87 Strongly Landlord-Friendly
- State Florida
- 87 Strongly Landlord-Friendly · R+3
- County
- — inherits STATE
- City
- — inherits STATE
ZIP-level market 33993
- Home prices YoY
- -14.1%
- Rents YoY
- -5.5%
- Active inventory
- 2652
- Price-to-rent
- 7.4×
Monthly cashflow live
- Estimated rent
- $2,254 high interval (Pro) →
- Mortgage (P&I)
- −$1,044
- Tax from tax record
- −$83 /mo · $994/yr
- Insurance
- −$83
- HOA
- −$0
- Vacancy / Maint / Mgmt
- −$473
- Net cashflow
- $571
Break-even live
UW: 25.0% down · 7.5% · 30yr · 1.5% tax · 5.0% vac · 8.0% maint · 8.0% mgmt
Financing live
Cash to close
- Down payment
- $49,750
- Closing costs
- $5,970
- Reserves months
- —
- Total cash needed
- —
Loan-product check · same deal, 3 products live
Conventional
25% down · 7.5% · 30yr
- Down + closing
- —
- Monthly P&I
- —
- Monthly cashflow
- —
- DSCR
- —
- Eligible?
- —
Personal DTI + credit; lowest rate.
DSCR
20% down · 8.5% · 30yr
- Down + closing
- —
- Monthly P&I
- —
- Monthly cashflow
- —
- DSCR
- —
- Eligible?
- —
No personal income docs; deal must DSCR.
Hard money
10% down · 12.0% · 12mo
- Down + closing
- —
- Monthly P&I
- —
- Monthly cashflow
- —
- DSCR
- —
- Eligible?
- —
Short-term bridge; refi at stabilization.
Rent comps 40 comps
| Address | Beds | Baths | Sqft | Rent | $/sqft | DOM | Units | Dist |
|---|---|---|---|---|---|---|---|---|
| 1011 Kismet Pkwy W Cape Coral, FL | 4.0 | 2.0 | 1787 | $2,100 | $1.18 | 3d | 1 | 0.18mi |
| 2227 NW 11th Ct Cape Coral, FL | 4.0 | 2.0 | 1650 | $1,895 | $1.15 | 23d | 1 | 0.21mi |
| 1023 NW 22nd Ter Cape Coral, FL | 3.0 | 2.0 | 1469 | $1,831 | $1.25 | 14d | 1 | 0.27mi |
| 2308 NW 9th Ave Cape Coral, FL | 4.0 | 3.0 | 1683 | $2,200 | $1.31 | 23d | 1 | 0.38mi |
| 1026 NW 21st Ter Cape Coral, FL | 4.0 | 2.0 | 1760 | $1,825 | $1.04 | 3d | 1 | 0.40mi |
| 2604 NW 8th Pl Cape Coral, FL | 4.0 | 2.0 | 1650 | $1,795 | $1.09 | 21d | 1 | 0.46mi |
| 2103 NW 10th Ave Cape Coral, FL | 3.0 | 2.0 | 1455 | $2,200 | $1.51 | 23d | 1 | 0.48mi |
| 1917 NW 12th Ave Cape Coral, FL | 3.0 | 2.0 | 1528 | $2,200 | $1.44 | 23d | 1 | 0.59mi |
| 1431 NW 20th Ter Cape Coral, FL | 3.0 | 2.0 | 2052 | $1,775 | $0.87 | 19d | 1 | 0.62mi |
| 2809 NW 8th Pl Cape Coral, FL | 3.0 | 2.0 | 1400 | $2,400 | $1.71 | 23d | 1 | 0.65mi |
| 1427 NW 20th St Cape Coral, FL | 4.0 | 2.0 | 1617 | $1,895 | $1.17 | 16d | 1 | 0.66mi |
| 609 NW 25th St Cape Coral, FL | 4.0 | 2.0 | 1556 | $2,000 | $1.29 | 3d | 1 | 0.68mi |
| 1719 NW 25th Ln Cape Coral, FL | 4.0 | 2.0 | 1829 | $2,291 | $1.25 | 3d | 1 | 0.75mi |
| 2206 NW 17th Pl Cape Coral, FL | 4.0 | 2.0 | 1779 | $2,075 | $1.17 | 23d | 1 | 0.78mi |
| 2000 NW 7th Ave Cape Coral, FL | 4.0 | 2.0 | 1708 | $1,950 | $1.14 | 14d | 1 | 0.80mi |
| 2000 NW 7th Ave Cape Coral, FL | 4.0 | 2.0 | 1708 | $1,950 | $1.14 | 23d | 1 | 0.80mi |
| 501 NW 26th Ter Cape Coral, FL | 3.0 | 2.0 | 1465 | $2,200 | $1.50 | 14d | 1 | 0.80mi |
| 2014 NW 16th Pl Cape Coral, FL | 4.0 | 2.0 | 1712 | $1,701 | $0.99 | 14d | 1 | 0.81mi |
| 520 NW 23rd Ter Cape Coral, FL | 4.0 | 2.0 | 1693 | $2,350 | $1.39 | 23d | 1 | 0.82mi |
| 721 NW Douglas Cir Cape Coral, FL | 3.0 | 2.0 | 1164 | $1,770 | $1.52 | 19d | 1 | 0.87mi |
| 2124 NW 18th Ave Cape Coral, FL | 3.0 | 2.0 | 1556 | $2,000 | $1.29 | 19d | 1 | 0.88mi |
| 1818 NW 27th Ter Cape Coral, FL | 4.0 | 2.0 | 1665 | $1,975 | $1.19 | 3d | 1 | 0.95mi |
| 1834 NW 6th Ave Cape Coral, FL | 3.0 | 2.0 | 1200 | $1,530 | $1.27 | 21d | 1 | 0.97mi |
| 1834 NW 6th Ave Cape Coral, FL | 3.0 | 2.0 | 1200 | $1,575 | $1.31 | 23d | 1 | 0.97mi |
| 2423 NW 19th Pl Cape Coral, FL | 4.0 | 2.0 | 1829 | $1,761 | $0.96 | 10d | 1 | 0.98mi |
| 1831 NW 6th Ave Cape Coral, FL | 4.0 | 2.0 | 1833 | $1,795 | $0.98 | 2d | 1 | 1.01mi |
| 324 NW 24th Ter Cape Coral, FL | 3.0 | 2.0 | 1499 | $2,500 | $1.67 | 3d | 1 | 1.01mi |
| 1907 NW 26th St Cape Coral, FL | 3.0 | 2.0 | 1842 | $2,200 | $1.19 | 14d | 1 | 1.02mi |
| 2901 NW 18th Pl Cape Coral, FL | 3.0 | 2.0 | 1555 | $2,190 | $1.41 | 13d | 1 | 1.05mi |
| 2227 NW 3rd Pl Cape Coral, FL | 3.0 | 3.0 | 1771 | $1,999 | $1.13 | 14d | 1 | 1.08mi |
| 2227 NW 3rd Pl Cape Coral, FL | 3.0 | 2.5 | 1771 | $1,799 | $1.02 | 23d | 1 | 1.08mi |
| 221 NW 25th St Cape Coral, FL | 3.0 | 2.0 | 1407 | $1,780 | $1.27 | 23d | 1 | 1.13mi |
| 214 NW 25th St Cape Coral, FL | 3.0 | 2.0 | 1983 | $2,100 | $1.06 | 23d | 1 | 1.15mi |
| 1823 NW 19th Ave Cape Coral, FL | 4.0 | 2.0 | 1712 | $1,850 | $1.08 | 23d | 1 | 1.16mi |
| 2838 NW 19th Pl Cape Coral, FL | 4.0 | 2.0 | 1650 | $1,845 | $1.12 | 23d | 1 | 1.17mi |
| 1823 NW 31st St Cape Coral, FL | 3.0 | 2.0 | 1408 | $1,950 | $1.38 | 3d | 1 | 1.20mi |
| 2919 NW 4th Pl Cape Coral, FL | 4.0 | 2.0 | 1639 | $1,926 | $1.18 | 3d | 1 | 1.24mi |
| 1809 NW 17th Ter Cape Coral, FL | 3.0 | 2.0 | 1750 | $1,980 | $1.13 | 23d | 1 | 1.25mi |
| 2936 NW 4th Pl Cape Coral, FL | 4.0 | 2.0 | 1769 | $1,895 | $1.07 | 23d | 1 | 1.26mi |
| 2616 NW 1st Pl Cape Coral, FL | 4.0 | 2.0 | 1829 | $1,946 | $1.06 | 21d | 1 | 1.27mi |
Listing history 9 events
-
2026-05-19status Pending
-
2026-05-07$199,000 Active
-
2021-12-07soldstatus $32,000
-
2021-11-29soldstatus $32,000 Closed 296-char remark
Show marketing remark (296 chars)
Fantastic opportunity to build your dream home on this CANAL front lot in popular NW Cape Coral. Great location on a quiet street, provides easy access to shops, services, dining and all your practical everyday needs. Take a drive by today and secure your own little slice of SW Florida paradise!
-
2021-11-13status Pending 296-char remark
Show marketing remark (296 chars)
Fantastic opportunity to build your dream home on this CANAL front lot in popular NW Cape Coral. Great location on a quiet street, provides easy access to shops, services, dining and all your practical everyday needs. Take a drive by today and secure your own little slice of SW Florida paradise!
-
2021-10-27$38,000 Active 296-char remark
Show marketing remark (296 chars)
Fantastic opportunity to build your dream home on this CANAL front lot in popular NW Cape Coral. Great location on a quiet street, provides easy access to shops, services, dining and all your practical everyday needs. Take a drive by today and secure your own little slice of SW Florida paradise!
-
2013-09-16price $120,000
-
2005-07-05soldstatus $121,500
-
2005-06-17soldstatus $121,500
ⓘ Source: listings_history table (triggers on properties + properties_extension) + one-shot
backfill from property_details.listing_events for pre-trigger history.
Tax reassessment forecast FL · Resets to sale price
- Current annual tax
- $994 · $83/mo
- Projected year-2 tax
- $1,652 · $138/mo
- Expected delta
- +$658/yr (+$55/mo · 66.2%)
ⓘ Screening estimate from a state-policy table — verify with the county assessor before closing.
Climate risk First Street
- Flood 4/10 Moderate FEMA zone X (unshaded) · 20% chance over 30 yrs
- Wildfire 6/10 Major
- Heat 10/10 Extreme 7 d/yr ≥107°F today · 30 d/yr by 30 yrs out
- Wind 10/10 Extreme 99% chance of damaging wind over 30 yrs
- Air quality 2/10 Low 1 unhealthy d/yr today · 1 by 30 yrs out
Nearby sold comps map
Loading sold comps map…
Walkable amenities ~0.75 mi
Loading nearby amenities…
Taxation est. · year 1
- Rental income
- $27,050
- − Mortgage interest
- −$11,147
- − Property taxes
- −$994
- − Insurance
- −$995
- − Repairs & maintenance
- −$2,164
- − Management
- −$2,164
- − Depreciation
- −$5,789
- Taxable income
- $3,797
- Est. tax owed @ 24.0%
- −$911
- After-tax cash flow
- $5,947/yr
For passive investors: Depreciation is non-cash, so a rental often shows a tax loss while cash-flowing — sheltering income. Rental losses are passive: they offset passive income freely, and up to $25,000/yr can offset ordinary (W-2) income if you actively participate and your MAGI is under $100k (phasing out to $0 by $150k); unused losses carry forward. On sale, claimed depreciation is recaptured at up to 25%, and gains may owe capital-gains tax (a 1031 exchange can defer both). Figures are a year-1 estimate at your 24.0% rate — not tax advice; consult a CPA.
Schools (NCES district)
- District
- Lee
- NCES district ID
- 1201080
- Math proficiency
- 47% ▼ -11.00%
- Reading proficiency
- 50% ▼ -4.00%
- Median HH income
- $49,518
- Composite
- 41.49/100
- National rank
- #3458
- State rank
- #42 of 73 in FL
Livability — Cape Coral
- Score
- 77/100
- State rank
- #208
- US rank
- #3098
Category grades
Schools grade is shown separately in the Schools card above.
Census & demographics
- Census place
- Cape Coral, FL
- County
- Lee County · 788,662 people
- City population
- 217,388
- Metro
- Cape Coral-Fort Myers, FL
- Population (ZIP)
- 35,580
- Household income
- $90,577
- Rent vs Own
- Severe rent burden
- 286.0
Population outlook (Lee County) Hauer SSP2
- Today (2025)
- 871,946 people
- By 2030
- 955,468 · +9.6%
- By 2040
- 1,113,587 · +27.7%
- By 2050
- 1,256,891 · +44.1%
- By 2075
- 1,560,270 · +78.9%
- By 2100
- 1,726,848 · +98.0%
Race, ethnicity, and origin ACS 2023
- Neighborhood character
- Diverse neighborhood (Simpson 0.58)
- Race & ethnicity
- White 57% Hispanic / Latino 30% Two or more races 21% Black 7% Asian 2%
- Hispanic origin (detail)
- Mexican 2% Puerto Rican 6% Cuban 17% Dominican 1%
- Common ancestry
- Romanian 2% Hispanic 2% Lithuanian 2%
- Foreign-born
- 21% · Canada, Jamaica, China
- Languages at home
- 73% English-only · Spanish 24% French/Haitian/Cajun 1% Russian/Polish/Slavic 1%
Political lean MEDSL · Lee
- 2024 margin
- Strong R (+28.4) · D 35.5% · R 63.9%
- 2008→2024 swing
- -18.0pp toward R · 2008: -10.4pp · 2024: -28.4pp
- All cycles
- 2024: R+28.4 2020: R+19.2 2016: R+20.4 2012: R+16.6 2008: R+10.4
Not yet ingested
- Civics
- —
Market trends
- HPI YoY
- ▼ -55.34%
- Current HPI
- 337.0575
- Rent YoY
- ▼ -5.51%
- Metro
- Cape Coral-Fort Myers, FL
- State GDP YoY
- ▲ 3.28%
- F500 in state
- 36
Industry mix (Fortune 500 HQ in FL)
| Industry | F500 HQs | Revenue |
|---|---|---|
| Industrial Technology | 2 | $29B |
|
||
| Insurance | 2 | $17B |
|
||
| Retail | 1 | $60B |
|
||
| Technology Distribution | 1 | $58B |
|
||
| Homebuilding | 1 | $35B |
|
||
| Technology Manufacturing | 1 | $35B |
|
||
Price history
+63.8% since first listed9 events — show timeline
- 2026-05-19 Pending — FORTMLS
- 2026-05-07 Listed $199,000 FORTMLS
- 2021-12-07 Sold (Public Records) $32,000 Public Records
- 2021-11-29 Sold (MLS) $32,000 FORTMLS
- 2021-11-13 Pending — FORTMLS
- 2021-10-27 Listed $38,000 FORTMLS
- 2013-09-16 Price Changed $120,000 FORTMLS
- 2005-07-05 Sold (Public Records) $121,500 Public Records
- 2005-06-17 Sold (MLS) $121,500 FORTMLS
Property tax history
+9.6%/yrLatest (2025): $994 · +15.3% YoY. Source: county tax records.
Cash-flow waterfall
monthlySold comps — $/sqft
last 12 mo · ≤1 miLoading sold comps…