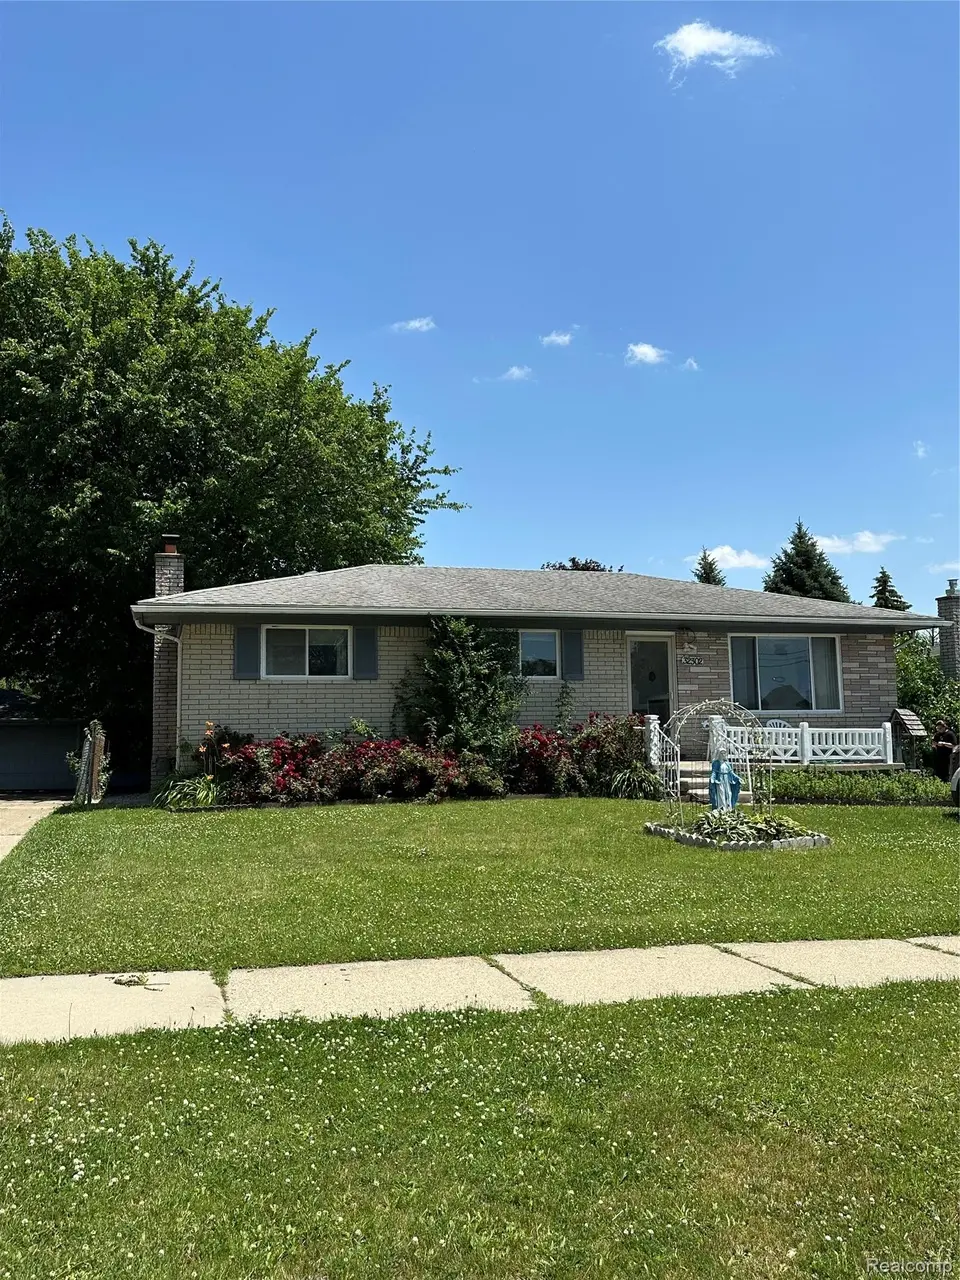
32302 Ryan Rd · Warren, MI
Flood risk 1/10 · Minimal
- FEMA flood zone
- X (unshaded)
- Chance of flooding over 30 yrs
- 0.0%
- Est. flood insurance / yr
- $473 – $860
Fire risk 1/10 · Minimal
- Est. fire insurance / yr
- $784 – $1,456
Heat risk 2/10 · Minimal
- Hot days now (above 97°F)
- 6 days/yr
- Hot days in 30 yrs
- 13 days/yr
Wind risk 1/10 · Minimal
- Chance of severe wind over 30 yrs
- —
Air-quality risk 3/10 · Minor
- Unhealthy air days now
- 3 days/yr
- Unhealthy air days in 30 yrs
- 5 days/yr
Risk factors via First Street. Map © Google.
Why this score? — see what drove the D grade
The composite is a weighted blend of 9 inputs, each scored 0–100. Each bar is that input's sub-score; the figure is the points it added to the 100-point composite (weight × sub-score).
- ARV discount +14.9/15.0
- Cash flow +8.6/30.0
- Rent growth +4.5/5.0
- Livability +3.7/5.0
- 1% rule +2.9/10.0
- Schools +2.5/10.0
- Condition / age +2.5/5.0
- DSCR +2.4/10.0
- Appreciation +0.0/10.0
$239,900
🖨 Deal sheet 📄 Offer letter ✓ Due diligence
Listing remarks MLS
THIS WELL PRICED NORTH WARREN RANCH IS READY FOR ITS NEW OWNERS. CLEAN AND UPDATED WITH LOTS OF SUNLIGHT SHINING THROUGH. LARGE LIVING ROOM WITH BIG PICTURE WINDOW, RECESSED LIGHTING AND NATURAL WOOD FLOOR. 3RD BEDROOM IS A FLEX ROOM CURRENTLY BEIMG USED AS A DINING ROOM. COMPLETELY UPDATED MAIN BATHROOM WITH HIGH END FINISHES. UPDATED KITCHEN WITH STAINLESS STEEL APPLIANCES AND BREAKFAST NOOK. FINISHED BASEMENT HAS A DEDICATED LAUNDRY ROOM AND FULL BATH WITH JACUZZI TUB. UPDATED ELECTRICAL. 75 GALLON HOT WATER HEATER. COVERED FRONT PORCH PERFECT FOR LOUNGING ON A NICE DAY. HUGE YARD WITH CONCRETE PATIO AND LARGE SHED FOR STORAGE. SCHEDULE YOUR PRIVATE VIEWING TODAY.
Key facts
- Big picture window
- Large living room
- Recessed lighting
Tags
Neighborhood map
What this means for you Summary
Snapshot
- This is a 3-bed/1.0-bath single-family listed at $240k.
Deal economics
- At list price, monthly cash flow is $-208 ($-2k/yr) — negative.
- To cash-flow at today's rent, offer at most $203k (15.3% below list).
- To meet the 1% rule (rent ≥ 1% of price), the offer needs to be $190k (20.7% below list).
- Recommended offer: $190k (20.7% below list) — sets the bar for 1% rule.
Location & tenants
- Location reads 74/100 on livability (#171 in MI, #4,491 nationally) — a middle-class / working-renter tenant base. Strengths: commute A+, cost of living A+, housing A+; Watch: schools D, amenities D, employment D.
- Warren Consolidated Schools (urban): math 18% / reading 39% proficiency, ranked #373 of 540 in MI (top 69%) — low school quality limits family demand, transient renter base, plan for 1-2y turnover.
- Market conditions: Rents rising fast (+8.0%/yr); 96 active listings in the ZIP; 12 comparable units currently listed for rent nearby; rentals leasing fast (median 13d on market — plan ~1-2 weeks tenant-placement turnaround); 1,321 units permitted in Macomb County in 2024 (86 in 5+ unit buildings).
- This rent runs 31% of the median local income ($74k/yr) — at the standard rent-burdened threshold; future hikes will face affordability resistance.
Forward outlook
- Local home prices are declining (-3.0%/yr); year-one equity from $2k of loan paydown is wiped out by about $7k of value loss. Plan a longer hold.
- Macomb County population projected at +9% by 2050 — modest demand growth; plan on rents tracking national, not racing it.
Negotiation context
- It's been on market 67 days — a 6% lower offer ($226k) is reasonable based on typical stale-listing flexibility.
- 10 sale attempts since 30y ago with the ask held roughly flat each time — persistent listings suggest the price (not the market) is what's stuck; bring a comps-based counter.
- Current owner paid $120k; list at $240k implies a 100% gain — meaningful room to come down on a strong offer.
Questions for the listing agent
- What do current leases actually rent for vs. the listed asking? Can we see a recent rent roll and the last 12 months of T-12 income?
- It's been on market 67 days. Have you received any prior offers? Is the seller open to a 21% concession, seller financing, or rate buy-down credit?
- Built in 1971 — when were the roof, HVAC, electrical panel, plumbing, and water heater last replaced?
- Why hasn't it sold? Are there any deal-killer items the seller is aware of (foundation, flood, title, zoning, code violations)?
- Is there a deadline driving the sale (1031 exchange, divorce, estate, relocation)? That informs how much negotiation room exists.
- Schools are D-rated, which usually means shorter tenancies and higher turnover. Who's the typical renter profile here, and what's been the actual vacancy rate?
- Crime grade is D in this area — have there been break-ins, vandalism, or insurance claims at this property in the last 3 years? What carrier currently insures it and at what premium?
- The area grade is low — what's the realistic commute time and amenity access for the typical tenant pool here? Any planned neighborhood developments (good or bad) we should know about?
- What's the average days-on-market for RENTAL listings here right now (not sales)? A rising rental-DOM trend means longer vacancies and softer asking-rent achievability than the comps imply.
- What's the recent tenant-quality profile in this submarket — average credit score on applications, eviction rate, late-payment / NSF rate, and stable-employment percentage? A property-management company in the area should have these aggregated.
- How much new for-sale + rental construction is in the pipeline within 1–3 miles? Heavy new supply typically softens prices + rents 12–24 months out; constrained supply supports both.
Investment metrics
- 1% rule
- 0.79% ✗
- Cap rate
- 5.25%
- Cash-on-cash
- -3.71%
- DSCR
- 0.84
- GRM
- 10.5
CMA / ARV
- ARV (median comp)
- $287,163
- List price
- $239,900
- Delta
- -16.46%
- Verdict
- UNDERPRICED
- Comps
- 20 within 1.0 mi
Show comp detail 12 sales within ~0.75 mi
| Address | Dist | Beds/Ba | Sqft | Sold | Price | $/sf | Match |
|---|---|---|---|---|---|---|---|
| 32961 Wexford Dr | 0.39mi | 3/1.0 | 1,100 (-2%) | 2mo | $227,000 | $206 | 76 |
| 4702 Arden Ave | 0.37mi | 3/1.0 | 1,075 (-5%) | 1mo | $170,000 | $158 | 74 |
| 4144 Hillcrest Dr | 0.14mi | 2/1.0 (-1) | 1,058 (-6%) | 10mo | $160,000 | $151 | 70 |
| 32246 Oakview Dr | 0.51mi | 3/1.0 | 1,180 (+5%) | 1mo | $239,000 | $203 | 68 |
| 32176 Exeter Dr | 0.47mi | 3/1.0 | 1,075 (-5%) | 4mo | $210,000 | $195 | 67 |
| 4640 Arden Ave | 0.36mi | 3/1.0 | 1,075 (-5%) | 12mo | $200,000 | $186 | 65 |
| 4812 Berwyn Dr | 0.43mi | 3/1.0 | 1,001 (-11%) | 2mo | $217,000 | $217 | 60 |
| 3235 Earl Dr Dr | 0.44mi | 3/1.5 | 1,208 (+7%) | 9mo | $260,000 | $215 | 58 |
| 32955 Hawthorne Dr | 0.71mi | 3/1.5 | 1,180 (+5%) | 3mo | $240,000 | $203 | 54 |
| 4700 Berwyn Dr | 0.38mi | 3/1.5 | 1,001 (-11%) | 13mo | $215,000 | $215 | 51 |
| 3506 Hein Dr | 0.72mi | 3/1.5 | 1,100 (-2%) | 13mo | $250,000 | $227 | 49 |
| 31495 Lyons Cir | 0.71mi | 3/1.5 | 1,037 (-8%) | 6mo | $185,000 | $178 | 46 |
Match score weights: distance 35% · size 25% · config 20% · recency 20%. Top-matched comps best support the ARV.
Projected returns pro-forma
-3.0% appreciation · 8.0% rent growth · sell at horizon
- IRR
- -16.9%
- Equity multiple
- 0.38×
- Total profit
- $-41,977
- Equity at exit
- $35,770
- IRR
- -1.3%
- Equity multiple
- 0.89×
- Total profit
- $-7,558
- Equity at exit
- $20,742
Cash invested: $67,172 (down + closing). Projections, not guarantees.
Landlord ↔ Tenant lean methodology
- Overall (STATE)
- 62 Landlord-Friendly
- State Michigan
- 62 Landlord-Friendly · EVEN
- County
- — inherits STATE
- City
- — inherits STATE
ZIP-level market 48092
- Rents YoY
- 8.0%
- Active inventory
- 96
- Price-to-rent
- 10.5×
Monthly cashflow live
- Estimated rent
- $1,903 high interval (Pro) →
- Mortgage (P&I)
- −$1,258
- Tax from tax record
- −$353 /mo · $4,234/yr
- Insurance
- −$100
- HOA
- −$0
- Vacancy / Maint / Mgmt
- −$400
- Net cashflow
- $-208
Break-even live
UW: 25.0% down · 7.5% · 30yr · 1.5% tax · 5.0% vac · 8.0% maint · 8.0% mgmt
Financing live
Cash to close
- Down payment
- $59,975
- Closing costs
- $7,197
- Reserves months
- —
- Total cash needed
- —
Loan-product check · same deal, 3 products live
Conventional
25% down · 7.5% · 30yr
- Down + closing
- —
- Monthly P&I
- —
- Monthly cashflow
- —
- DSCR
- —
- Eligible?
- —
Personal DTI + credit; lowest rate.
DSCR
20% down · 8.5% · 30yr
- Down + closing
- —
- Monthly P&I
- —
- Monthly cashflow
- —
- DSCR
- —
- Eligible?
- —
No personal income docs; deal must DSCR.
Hard money
10% down · 12.0% · 12mo
- Down + closing
- —
- Monthly P&I
- —
- Monthly cashflow
- —
- DSCR
- —
- Eligible?
- —
Short-term bridge; refi at stabilization.
Rent comps 12 comps
| Address | Beds | Baths | Sqft | Rent | $/sqft | DOM | Units | Dist |
|---|---|---|---|---|---|---|---|---|
| 31779 Ryan Rd Warren, MI | 3.0 | 1.0 | 1200 | $1,800 | $1.50 | 44d | 1 | 0.33mi |
| 32725 Grinsell Dr Warren, MI | 4.0 | 2.0 | 1057 | $2,000 | $1.89 | 44d | 1 | 0.58mi |
| 4473 Buchanan Ave Warren, MI | 3.0 | 1.5 | 1064 | $1,650 | $1.55 | 24d | 1 | 0.61mi |
| 34350 Ryan Rd Sterling Heights, MI | 1.0–2.0 | 1.0–2.0 | 853 | $1,775 | $2.08 | 5d | 44 | 0.99mi |
| 31499 Mound Rd Warren, MI | 1.0–2.0 | 1.0 | 900 | $1,413 | $1.57 | 3d | 5 | 1.04mi |
| 2252 Winston Dr Sterling Heights, MI | 3.0 | 1.0 | 950 | $1,900 | $2.00 | 22d | 1 | 1.08mi |
| 2252 Winston Dr Sterling Heights, MI | 3.0 | 2.0 | 950 | $2,100 | $2.21 | 11d | 1 | 1.08mi |
| 34830 Pisces Dr Sterling Heights, MI | 1.0–2.0 | 1.0–3.0 | 839 | $1,650 | $1.97 | 2d | 6 | 1.24mi |
| 4560 15 Mile Rd Sterling Heights, MI | 1.0–2.0 | 1.0 | 801 | $1,585 | $1.98 | 2d | 12 | 1.26mi |
| 34400 Dequindre Rd Sterling Heights, MI | 1.0–2.0 | 1.0–2.0 | 898 | $1,540 | $1.71 | 12d | 2 | 1.36mi |
| 1545 E Thirteen Mile Rd Madison Heights, MI | 2.0 | 1.0–2.0 | 870 | $1,910 | $2.20 | 3d | 14 | 1.39mi |
| 29745 Fox Run Cir Warren, MI | 3.0 | 2.0 | 1487 | $2,200 | $1.48 | 44d | 1 | 1.49mi |
Listing history 30 events
-
2026-03-23$239,900 Active 676-char remark
Show marketing remark (675 chars)
THIS WELL PRICED NORTH WARREN RANCH IS READY FOR ITS NEW OWNERS. CLEAN AND UPDATED WITH LOTS OF SUNLIGHT SHINING THROUGH. LARGE LIVING ROOM WITH BIG PICTURE WINDOW, RECESSED LIGHTING AND NATURAL WOOD FLOOR. 3RD BEDROOM IS A FLEX ROOM CURRENTLY BEIMG USED AS A DINING ROOM. COMPLETELY UPDATED MAIN BATHROOM WITH HIGH END FINISHES. UPDATED KITCHEN WITH STAINLESS STEEL APPLIANCES AND BREAKFAST NOOK. FINISHED BASEMENT HAS A DEDICATED LAUNDRY ROOM AND FULL BATH WITH JACUZZI TUB. UPDATED ELECTRICAL. 75 GALLON HOT WATER HEATER. COVERED FRONT PORCH PERFECT FOR LOUNGING ON A NICE DAY. HUGE YARD WITH CONCRETE PATIO AND LARGE SHED FOR STORAGE. SCHEDULE YOUR PRIVATE VIEWING TODAY.
-
2026-03-23$239,900 Active 675-char remark
Show marketing remark (675 chars)
THIS WELL PRICED NORTH WARREN RANCH IS READY FOR ITS NEW OWNERS. CLEAN AND UPDATED WITH LOTS OF SUNLIGHT SHINING THROUGH. LARGE LIVING ROOM WITH BIG PICTURE WINDOW, RECESSED LIGHTING AND NATURAL WOOD FLOOR. 3RD BEDROOM IS A FLEX ROOM CURRENTLY BEIMG USED AS A DINING ROOM. COMPLETELY UPDATED MAIN BATHROOM WITH HIGH END FINISHES. UPDATED KITCHEN WITH STAINLESS STEEL APPLIANCES AND BREAKFAST NOOK. FINISHED BASEMENT HAS A DEDICATED LAUNDRY ROOM AND FULL BATH WITH JACUZZI TUB. UPDATED ELECTRICAL. 75 GALLON HOT WATER HEATER. COVERED FRONT PORCH PERFECT FOR LOUNGING ON A NICE DAY. HUGE YARD WITH CONCRETE PATIO AND LARGE SHED FOR STORAGE. SCHEDULE YOUR PRIVATE VIEWING TODAY.
-
2026-03-01historical
-
2026-03-01historical
-
2025-12-31price $244,900
-
2025-12-30price $244,900
-
2025-10-09price $249,900
-
2025-10-08price $249,900
-
2025-08-10price $254,900
-
2025-08-10price $254,900
-
2025-06-25$259,000 Active
-
2025-06-25$259,000 Active
-
2024-08-12historical
-
2024-08-12historical
-
2024-08-05price $264,900
-
2024-08-05price $264,900
-
2024-06-25$269,900 Active
-
2024-06-25$269,900 Active
-
2017-09-27soldstatus $120,000
-
2008-09-12soldstatus $75,000
-
2008-04-08$84,900
-
2003-07-28historical
-
2003-04-01$144,900
-
1996-08-19soldstatus $96,000
-
1996-07-25soldstatus $96,000
-
1996-07-24soldstatus $96,000
-
1996-04-26historical
-
1996-02-29$99,900
-
1996-02-29$99,900
-
1992-01-23soldstatus $60,000
ⓘ Source: listings_history table (triggers on properties + properties_extension) + one-shot
backfill from property_details.listing_events for pre-trigger history.
Tax reassessment forecast MI · Partial reset (capped growth)
- Current annual tax
- $4,234 · $353/mo
- Projected year-2 tax
- $4,234 · $353/mo
- Expected delta
- $0/yr ($0/mo · 0.0%)
ⓘ Screening estimate from a state-policy table — verify with the county assessor before closing.
Climate risk First Street
- Flood 1/10 Low FEMA zone X (unshaded) · 0% chance over 30 yrs
- Wildfire 1/10 Low
- Heat 2/10 Low 6 d/yr ≥97°F today · 13 d/yr by 30 yrs out
- Wind 1/10 Low
- Air quality 3/10 Moderate 3 unhealthy d/yr today · 5 by 30 yrs out
Nearby sold comps map
Loading sold comps map…
Walkable amenities ~0.75 mi
Loading nearby amenities…
Taxation est. · year 1
- Rental income
- $22,834
- − Mortgage interest
- −$13,438
- − Property taxes
- −$4,234
- − Insurance
- −$1,200
- − Repairs & maintenance
- −$1,827
- − Management
- −$1,827
- − Depreciation
- −$6,979
- Taxable loss
- −$6,669
- Est. tax savings @ 24.0%
- +$1,601
- After-tax cash flow
- $-890/yr
For passive investors: Depreciation is non-cash, so a rental often shows a tax loss while cash-flowing — sheltering income. Rental losses are passive: they offset passive income freely, and up to $25,000/yr can offset ordinary (W-2) income if you actively participate and your MAGI is under $100k (phasing out to $0 by $150k); unused losses carry forward. On sale, claimed depreciation is recaptured at up to 25%, and gains may owe capital-gains tax (a 1031 exchange can defer both). Figures are a year-1 estimate at your 24.0% rate — not tax advice; consult a CPA.
Schools (NCES district)
- District
- Warren Consolidated Schools
- NCES district ID
- 2635190
- Math proficiency
- 18% ▼ -14.00%
- Reading proficiency
- 39% ▼ -8.00%
- Median HH income
- $52,259
- Composite
- 25.09/100
- National rank
- #7533
- State rank
- #373 of 540 in MI
Livability — Warren
- Score
- 74/100
- State rank
- #171
- US rank
- #4491
Category grades
Schools grade is shown separately in the Schools card above.
Census & demographics
- Census place
- Warren, MI
- County
- Macomb County · 638,552 people
- City population
- 114,937
- Metro
- Detroit-Warren-Dearborn, MI
- Population (ZIP)
- 27,374
- Household income
- $73,808
- Rent vs Own
- Severe rent burden
- 675.0
Population outlook (Macomb County) Hauer SSP2
- Today (2025)
- 925,296 people
- By 2030
- 948,226 · +2.5%
- By 2040
- 983,961 · +6.3%
- By 2050
- 1,010,200 · +9.2%
- By 2075
- 1,076,222 · +16.3%
- By 2100
- 1,077,065 · +16.4%
Race, ethnicity, and origin ACS 2023
- Neighborhood character
- Diverse neighborhood (Simpson 0.55)
- Race & ethnicity
- White 63% Asian 17% Black 14% Two or more races 4% Hispanic / Latino 2%
- Common ancestry
- Romanian 10% Arab 4% Subsaharan African 2%
- Foreign-born
- 22% · Vietnam, Canada, China
- Languages at home
- 70% English-only · Other Indo-European 11% Arabic 5% Russian/Polish/Slavic 3%
Political lean MEDSL · Macomb
- 2024 margin
- R (+13.7) · D 42.2% · R 55.9% · Other 1.9%
- 2008→2024 swing
- -22.3pp toward R · 2008: 8.6pp · 2024: -13.7pp
- All cycles
- 2024: R+13.7 2020: R+8.1 2016: R+11.6 2012: D+4.0 2008: D+8.6
Not yet ingested
- Civics
- —
Market trends
- HPI YoY
- ▼ -262.85%
- Current HPI
- 189.7524
- Rent YoY
- ▲ 8.03%
- Metro
- Detroit-Warren-Dearborn, MI
- State GDP YoY
- ▲ 1.37%
- F500 in state
- 28
Industry mix (Fortune 500 HQ in MI)
| Industry | F500 HQs | Revenue |
|---|---|---|
| Automotive Parts | 3 | $48B |
|
||
| Automotive | 2 | $372B |
|
||
| Chemicals | 1 | $45B |
|
||
| Automotive Retail | 1 | $29B |
|
||
| Healthcare / Medical Devices | 1 | $23B |
|
||
| Automotive Technology | 1 | $20B |
|
||
Price history
+299.8% since first listed30 events — show timeline
- 2026-03-23 Listed $239,900 REALCOMP
- 2026-03-23 Listed $239,900 MiRealSource-MiMLS
- 2026-03-01 Listing Removed — REALCOMP
- 2026-03-01 Listing Removed — MiRealSource-MiMLS
- 2025-12-31 Price Changed $244,900 MiRealSource-MiMLS
- 2025-12-30 Price Changed $244,900 REALCOMP
- 2025-10-09 Price Changed $249,900 MiRealSource-MiMLS
- 2025-10-08 Price Changed $249,900 REALCOMP
- 2025-08-10 Price Changed $254,900 MiRealSource-MiMLS
- 2025-08-10 Price Changed $254,900 REALCOMP
- 2025-06-25 Listed $259,000 REALCOMP
- 2025-06-25 Listed $259,000 MiRealSource-MiMLS
- 2024-08-12 Listing Removed — REALCOMP
- 2024-08-12 Listing Removed — MiRealSource-MiMLS
- 2024-08-05 Price Changed $264,900 MiRealSource-MiMLS
- 2024-08-05 Price Changed $264,900 REALCOMP
- 2024-06-25 Listed $269,900 REALCOMP
- 2024-06-25 Listed $269,900 MiRealSource-MiMLS
- 2017-09-27 Sold (Public Records) $120,000 Public Records
- 2008-09-12 Sold (MLS) $75,000 REALCOMP
- 2008-04-08 Listed $84,900 REALCOMP
- 2003-07-28 Listing Removed — REALCOMP
- 2003-04-01 Listed $144,900 REALCOMP
- 1996-08-19 Sold (MLS) $96,000 REALCOMP
- 1996-07-25 Sold (MLS) $96,000 MiRealSource-MiMLS
- 1996-07-24 Sold (Public Records) $96,000 Public Records
- 1996-04-26 Listing Removed — MiRealSource-MiMLS
- 1996-02-29 Listed $99,900 MiRealSource-MiMLS
- 1996-02-29 Listed $99,900 REALCOMP
- 1992-01-23 Sold (Public Records) $60,000 Public Records
Property tax history
+4.6%/yrLatest (2025): $4,234 · +2.2% YoY. Source: county tax records.
Cash-flow waterfall
monthlySold comps — $/sqft
last 12 mo · ≤1 miLoading sold comps…