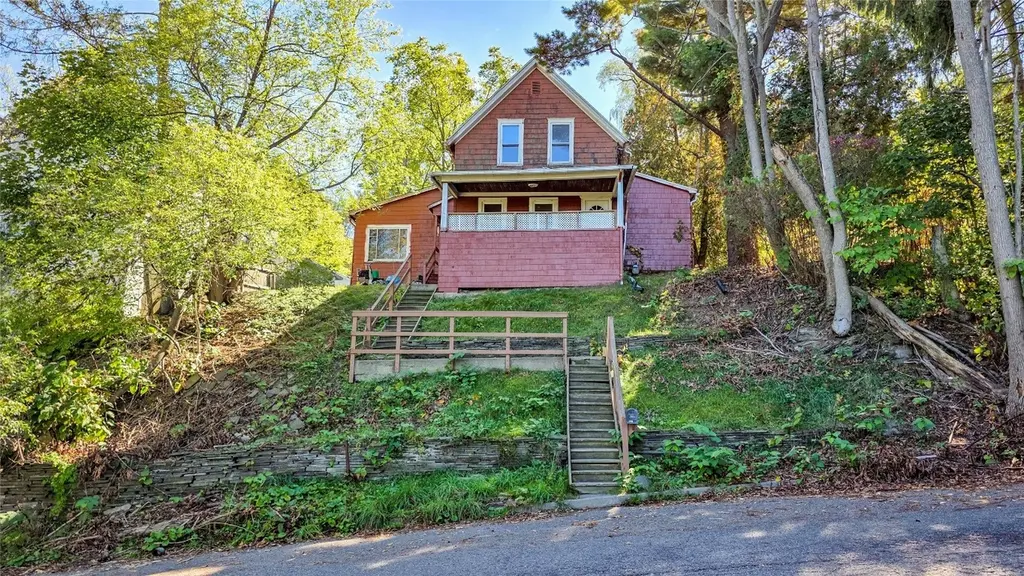
25 Hotchkiss Street St · Binghamton, NY
Flood risk 1/10 · Minimal
- FEMA flood zone
- X
- Chance of flooding over 30 yrs
- 0.0%
- Est. flood insurance / yr
- $473 – $860
Fire risk 1/10 · Minimal
- Est. fire insurance / yr
- $691 – $1,283
Heat risk 3/10 · Minor
- Hot days now (above 92°F)
- 7 days/yr
- Hot days in 30 yrs
- 15 days/yr
Wind risk 2/10 · Minimal
- Chance of severe wind over 30 yrs
- 1.0%
Air-quality risk 2/10 · Minimal
- Unhealthy air days now
- 0 days/yr
- Unhealthy air days in 30 yrs
- 1 days/yr
Risk factors via First Street. Map © Google.
Why this score? — see what drove the B+ grade
The composite is a weighted blend of 9 inputs, each scored 0–100. Each bar is that input's sub-score; the figure is the points it added to the 100-point composite (weight × sub-score).
- Cash flow +24.5/30.0
- ARV discount +13.9/15.0
- Appreciation +10.0/10.0
- DSCR +7.9/10.0
- 1% rule +6.9/10.0
- Livability +3.9/5.0
- Schools +3.0/10.0
- Rent growth +2.5/5.0
- Condition / age +2.5/5.0
$145,000
🖨 Deal sheet 📄 Offer letter ✓ Due diligence
Listing remarks MLS
BEAUTIFUL VIEWS from this Binghamton Cape Cod home, with an eat-in kitchen, hardwood floors, come and take a look today!
Key facts
- Eat-in kitchen
- Hardwood floors
- 9,147 sq ft lot
Tags
Neighborhood map
What this means for you Summary
Snapshot
- This is a 3-bed/2.0-bath single-family listed at $145k.
Deal economics
- At list price, monthly cash flow is $296 ($4k/yr) — positive.
- The deal already cash-flows at list — no discount required.
- Meets the 1% rule at list price ($2k rent vs $145k).
- Recommended offer: $128k (12.0% below list) — sets the bar for market timing.
- Cap rate 8.7% vs local median 6.4% in Binghamton — top-decile yield for the area; either an underpriced asset or a hidden risk that comps aren't pricing in. Stress-test before assuming the spread holds.
Location & tenants
- Location reads 78/100 on livability (#174 in NY, #2,710 nationally) — a middle-class / working-renter tenant base. Strengths: amenities A+, commute A+, cost of living A+; Watch: schools D, crime F, employment F.
- Binghamton City School District (urban): math 30% / reading 44% proficiency, ranked #557 of 590 in NY (top 94%) — families likely to look elsewhere, expect single-tenant / working-renter base with shorter leases; 61% free/reduced lunch — lower-income household profile, screen leases tightly.
- Market conditions: 112 active listings in the ZIP; 12 comparable units currently listed for rent nearby; rentals lingering (median 44d on market — plan ~5-8 weeks vacancy on turnover, expect pricing pressure); 67% of comp listings sitting > 30 days — soft ceiling on asking rent; 340 units permitted in Broome County in 2024 (269 in 5+ unit buildings).
- This rent runs 31% of the median local income ($66k/yr) — at the standard rent-burdened threshold; future hikes will face affordability resistance.
Forward outlook
- In year one you build about $16k of equity ($1k loan paydown + $14k appreciation (10.0% local appreciation)).
- Broome County population projected at -13% by 2050 — secular population decline; favor cash flow + early exit over multi-decade hold.
- At projected returns (10.0% appreciation + 3.0% rent growth), your $41k cash investment doubles in ~3 years — after that, you're playing with house money.
- By year 3, paydown + projected appreciation supports a ~$39k cash-out refi (75% LTV) — recoverable capital for the next deal without selling this one.
Negotiation context
- It's been on market 259 days — a 12% lower offer ($128k) is reasonable based on typical stale-listing flexibility.
Risks & watch-outs
- Watch-outs: built in 1880 — expect roof / HVAC / electrical / plumbing capex.
Questions for the listing agent
- It's been on market 259 days. Have you received any prior offers? Is the seller open to a 12% concession, seller financing, or rate buy-down credit?
- Built in 1880 — when were the roof, HVAC, electrical panel, plumbing, and water heater last replaced?
- Why hasn't it sold? Are there any deal-killer items the seller is aware of (foundation, flood, title, zoning, code violations)?
- Is there a deadline driving the sale (1031 exchange, divorce, estate, relocation)? That informs how much negotiation room exists.
- Schools are D-rated, which usually means shorter tenancies and higher turnover. Who's the typical renter profile here, and what's been the actual vacancy rate?
- Crime grade is F in this area — have there been break-ins, vandalism, or insurance claims at this property in the last 3 years? What carrier currently insures it and at what premium?
- What's the average days-on-market for RENTAL listings here right now (not sales)? A rising rental-DOM trend means longer vacancies and softer asking-rent achievability than the comps imply.
- What's the recent tenant-quality profile in this submarket — average credit score on applications, eviction rate, late-payment / NSF rate, and stable-employment percentage? A property-management company in the area should have these aggregated.
- How much new for-sale + rental construction is in the pipeline within 1–3 miles? Heavy new supply typically softens prices + rents 12–24 months out; constrained supply supports both.
Investment metrics
- 1% rule
- 1.19% ✓
- Cap rate
- 8.75%
- Cash-on-cash
- 8.76%
- DSCR
- 1.39
- GRM
- 7.0
CMA / ARV
- ARV (median comp)
- $169,232
- List price
- $145,000
- Delta
- -14.32%
- Verdict
- UNDERPRICED
- Comps
- 20 within 1.0 mi
Show comp detail 12 sales within ~0.75 mi
| Address | Dist | Beds/Ba | Sqft | Sold | Price | $/sf | Match |
|---|---|---|---|---|---|---|---|
| 14 Allendale Rd | 0.27mi | 3/2.5 | 1,643 (+2%) | 1mo | $280,000 | $170 | 80 |
| 8 Sherwood Ave | 0.25mi | 3/1.5 | 1,603 (-0%) | 10mo | $175,000 | $109 | 78 |
| 39 Park Ave | 0.41mi | 4/1.5 (+1) | 1,538 (-4%) | 9mo | $102,500 | $67 | 59 |
| 2030 Rexford St | 0.59mi | 3/2.0 | 1,713 (+7%) | 5mo | $165,000 | $96 | 57 |
| 4 Denton Rd | 0.42mi | 3/1.0 | 1,377 (-14%) | 2mo | $231,000 | $168 | 51 |
| 28 Bayless Ave | 0.42mi | 4/1.0 (+1) | 1,396 (-13%) | 1mo | $23,275 | $17 | 49 |
| 103 S Washington St | 0.48mi | 3/2.0 | 1,384 (-14%) | 8mo | $167,500 | $121 | 48 |
| 14 Hallam St | 0.60mi | 3/1.5 | 1,452 (-10%) | 9mo | $175,000 | $121 | 46 |
| 30 Duane Ave | 0.64mi | 4/2.0 (+1) | 1,472 (-8%) | 10mo | $154,680 | $105 | 42 |
| 50 Tremont Ave | 0.74mi | 4/1.5 (+1) | 1,725 (+8%) | 4mo | $175,000 | $101 | 42 |
| 25 Duane Ave | 0.66mi | 4/1.5 (+1) | 1,740 (+8%) | 8mo | $170,000 | $98 | 42 |
| 8 Christopher St | 0.50mi | 2/1.5 (-1) | 1,400 (-13%) | 10mo | $175,000 | $125 | 40 |
Match score weights: distance 35% · size 25% · config 20% · recency 20%. Top-matched comps best support the ARV.
Projected returns pro-forma
10.0% appreciation · 3.0% rent growth · sell at horizon
- IRR
- 30.7%
- Equity multiple
- 3.41×
- Total profit
- $97,918
- Equity at exit
- $130,627
- IRR
- 26.6%
- Equity multiple
- 7.74×
- Total profit
- $273,641
- Equity at exit
- $281,703
Cash invested: $40,600 (down + closing). Projections, not guarantees.
Landlord ↔ Tenant lean methodology
- Overall (STATE)
- 15 Strongly Tenant-Friendly
- State New York
- 15 Strongly Tenant-Friendly · D+10
- County
- — inherits STATE
- City
- — inherits STATE
ZIP-level market 13903
- Home prices YoY
- 4.3%
- Active inventory
- 112
- Price-to-rent
- 7.0×
Monthly cashflow live
- Estimated rent
- $1,729 high interval (Pro) →
- Mortgage (P&I)
- −$760
- Tax from tax record
- −$249 /mo · $2,983/yr
- Insurance
- −$60
- HOA
- −$0
- Vacancy / Maint / Mgmt
- −$363
- Net cashflow
- $296
Break-even live
UW: 25.0% down · 7.5% · 30yr · 1.5% tax · 5.0% vac · 8.0% maint · 8.0% mgmt
Financing live
Cash to close
- Down payment
- $36,250
- Closing costs
- $4,350
- Reserves months
- —
- Total cash needed
- —
Loan-product check · same deal, 3 products live
Conventional
25% down · 7.5% · 30yr
- Down + closing
- —
- Monthly P&I
- —
- Monthly cashflow
- —
- DSCR
- —
- Eligible?
- —
Personal DTI + credit; lowest rate.
DSCR
20% down · 8.5% · 30yr
- Down + closing
- —
- Monthly P&I
- —
- Monthly cashflow
- —
- DSCR
- —
- Eligible?
- —
No personal income docs; deal must DSCR.
Hard money
10% down · 12.0% · 12mo
- Down + closing
- —
- Monthly P&I
- —
- Monthly cashflow
- —
- DSCR
- —
- Eligible?
- —
Short-term bridge; refi at stabilization.
Rent comps 12 comps
| Address | Beds | Baths | Sqft | Rent | $/sqft | DOM | Units | Dist |
|---|---|---|---|---|---|---|---|---|
| 31 Indiana St Binghamton, NY | 3.0 | 1.5 | 1232 | $1,500 | $1.22 | 43d | 1 | 0.61mi |
| 71 Mary St Unit 2 Binghamton, NY | 2.0 | 1.0 | 1100 | $1,300 | $1.18 | 13d | 1 | 0.64mi |
| 1 Euclid Ave Unit 1 Binghamton, NY | 3.0 | 1.0 | 1100 | $1,500 | $1.36 | 43d | 1 | 0.93mi |
| 29 Laurel Ave Unit 2 Binghamton, NY | 3.0 | 1.5 | 1500 | $2,250 | $1.50 | 43d | 1 | 0.95mi |
| 86 Conklin Ave Binghamton, NY | 3.0 | 1.0 | 1316 | $1,600 | $1.22 | 13d | 1 | 1.06mi |
| 26 Johnson Ave Unit 1 Binghamton, NY | 3.0 | 1.0 | 1633 | $1,600 | $0.98 | 43d | 1 | 1.06mi |
| 73 Leroy St Unit 02 Binghamton, NY | 3.0 | 1.0 | 1100 | $1,950 | $1.77 | 43d | 1 | 1.15mi |
| 50 Lathrop Ave Unit 2 Binghamton, NY | 3.0 | 1.0 | 1250 | $1,600 | $1.28 | 13d | 1 | 1.22mi |
| 53 Seminary Ave Unit 1 Binghamton, NY | 2.0 | 1.0 | 1722 | $925 | $0.54 | 21d | 1 | 1.26mi |
| 5 Arthur St Unit 2 Binghamton, NY | 4.0 | 1.0 | 1200 | $1,800 | $1.50 | 43d | 1 | 1.30mi |
| 113 Hawley St Binghamton, NY | 4.0 | 1.5 | 1637 | $2,000 | $1.22 | 43d | 1 | 1.37mi |
| 136 Court St Unit 2 Binghamton, NY | 4.0 | 1.0 | 1373 | $3,000 | $2.18 | 43d | 1 | 1.43mi |
Listing history 17 events
-
2026-06-19days on market $145,000 Active 259 DOM
-
2026-06-18days on market $145,000 Active 258 DOM
-
2026-06-17days on market $145,000 Active 257 DOM
-
2026-06-16days on market $145,000 Active 256 DOM
-
2026-06-15days on market $145,000 Active 255 DOM
-
2026-06-14days on market $145,000 Active 253 DOM
-
2026-06-13days on market $145,000 Active 252 DOM
-
2026-06-10days on market $145,000 Active 250 DOM
-
2026-06-09days on market $145,000 Active 249 DOM
-
2026-06-08days on market $145,000 Active 248 DOM
-
2026-06-07days on market $145,000 Active 247 DOM
-
2026-06-03days on market $145,000 Active 243 DOM
-
2026-06-02days on market $145,000 Active 242 DOM
-
2026-06-01days on market $145,000 Active 241 DOM
-
2026-05-31days on market $145,000 Active 240 DOM
-
2026-05-30days on market $145,000 Active 239 DOM
-
2025-10-03$145,000 Active 120-char remark
Show marketing remark (120 chars)
BEAUTIFUL VIEWS from this Binghamton Cape Cod home, with an eat-in kitchen, hardwood floors, come and take a look today!
ⓘ Source: listings_history table (triggers on properties + properties_extension) + one-shot
backfill from property_details.listing_events for pre-trigger history.
Tax reassessment forecast NY · Partial reset (capped growth)
- Current annual tax
- $2,983 · $249/mo
- Projected year-2 tax
- $2,983 · $249/mo
- Expected delta
- $0/yr ($0/mo · 0.0%)
ⓘ Screening estimate from a state-policy table — verify with the county assessor before closing.
Climate risk First Street
- Flood 1/10 Low FEMA zone X · 0% chance over 30 yrs
- Wildfire 1/10 Low
- Heat 3/10 Moderate 7 d/yr ≥92°F today · 15 d/yr by 30 yrs out
- Wind 2/10 Low 100% chance of damaging wind over 30 yrs
- Air quality 2/10 Low 0 unhealthy d/yr today · 1 by 30 yrs out
Nearby sold comps map
Loading sold comps map…
Walkable amenities ~0.75 mi
Loading nearby amenities…
Taxation est. · year 1
- Rental income
- $20,746
- − Mortgage interest
- −$8,122
- − Property taxes
- −$2,983
- − Insurance
- −$725
- − Repairs & maintenance
- −$1,660
- − Management
- −$1,660
- − Depreciation
- −$4,218
- Taxable income
- $1,379
- Est. tax owed @ 24.0%
- −$331
- After-tax cash flow
- $3,226/yr
For passive investors: Depreciation is non-cash, so a rental often shows a tax loss while cash-flowing — sheltering income. Rental losses are passive: they offset passive income freely, and up to $25,000/yr can offset ordinary (W-2) income if you actively participate and your MAGI is under $100k (phasing out to $0 by $150k); unused losses carry forward. On sale, claimed depreciation is recaptured at up to 25%, and gains may owe capital-gains tax (a 1031 exchange can defer both). Figures are a year-1 estimate at your 24.0% rate — not tax advice; consult a CPA.
Schools (NCES district)
- District
- Binghamton City School District
- NCES district ID
- 3604870
- Math proficiency
- 30% ▬ 0.00%
- Reading proficiency
- 44% ▲ 15.00%
- Median HH income
- $30,475
- Composite
- 30.09/100
- National rank
- #6342
- State rank
- #557 of 590 in NY
Livability — Binghamton
- Score
- 78/100
- State rank
- #174
- US rank
- #2710
Category grades
Schools grade is shown separately in the Schools card above.
Census & demographics
- Census place
- Binghamton, NY
- County
- Broome County · 126,805 people
- City population
- 65,170
- Metro
- Binghamton, NY
- Population (ZIP)
- 17,569
- Household income
- $66,278
- Rent vs Own
- Severe rent burden
- 602.0
Population outlook (Broome County) Hauer SSP2
- Today (2025)
- 187,989 people
- By 2030
- 183,066 · -2.6%
- By 2040
- 172,228 · -8.4%
- By 2050
- 163,161 · -13.2%
- By 2075
- 153,641 · -18.3%
- By 2100
- 140,851 · -25.1%
Race, ethnicity, and origin ACS 2023
- Neighborhood character
- Predominantly White (80%)
- Race & ethnicity
- White 80% Black 9% Two or more races 6% Hispanic / Latino 4% Asian 1%
- Common ancestry
- Romanian 6% Slovak 2% Scotch-Irish 2%
- Foreign-born
- 5% · Canada
- Languages at home
- 94% English-only · Spanish 2% Other Indo-European 1% Arabic 1%
Political lean MEDSL · Broome
- 2024 margin
- Toss-up / Even · D 50.2% · R 49.8%
- 2008→2024 swing
- -7.6pp toward R · 2008: 8.0pp · 2024: 0.4pp
- All cycles
- 2024: D+0.4 2020: D+3.5 2016: R+3.7 2012: D+4.6 2008: D+8.0
Not yet ingested
- Civics
- —
Market trends
- HPI YoY
- ▲ 11.68%
- Current HPI
- 286.1001
- Rent YoY
- —
- Metro
- Binghamton, NY
- State GDP YoY
- ▲ 2.60%
- F500 in state
- 92
Industry mix (Fortune 500 HQ in NY)
| Industry | F500 HQs | Revenue |
|---|---|---|
| Financial Services | 10 | $950B |
|
||
| Consumer Goods | 9 | $162B |
|
||
| Insurance | 4 | $225B |
|
||
| Telecommunications | 2 | $144B |
|
||
| Pharmaceuticals | 2 | $112B |
|
||
| Media / Entertainment | 2 | $69B |
|
||
Price history
1 event — show timeline
- 2025-10-03 Listed $145,000 GBAOR
Property tax history
-1.6%/yrLatest (2025): $2,983 · +0.9% YoY. Source: county tax records.
Cash-flow waterfall
monthlySold comps — $/sqft
last 12 mo · ≤1 miLoading sold comps…