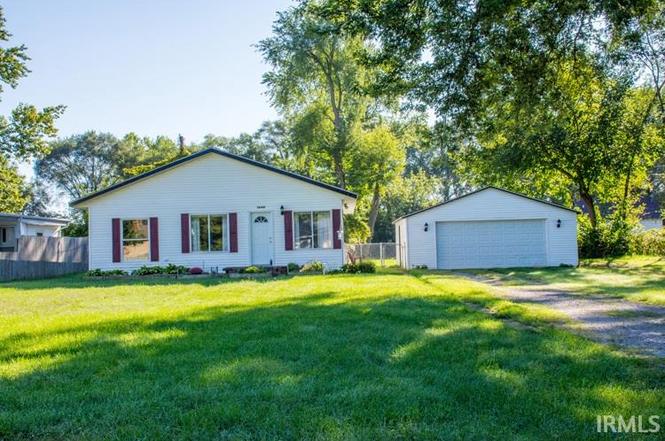
56400 Francis Ave · Mishawaka, IN
Flood risk 1/10 · Minimal
- FEMA flood zone
- X (unshaded)
- Chance of flooding over 30 yrs
- 0.0%
- Est. flood insurance / yr
- $507 – $1,088
Fire risk 1/10 · Minimal
- Est. fire insurance / yr
- $717 – $1,331
Heat risk 2/10 · Minimal
- Hot days now (above 100°F)
- 7 days/yr
- Hot days in 30 yrs
- 16 days/yr
Wind risk 2/10 · Minimal
- Chance of severe wind over 30 yrs
- —
Air-quality risk 3/10 · Minor
- Unhealthy air days now
- 2 days/yr
- Unhealthy air days in 30 yrs
- 3 days/yr
Risk factors via First Street. Map © Google.
Why this score? — see what drove the B grade
The composite is a weighted blend of 9 inputs, each scored 0–100. Each bar is that input's sub-score; the figure is the points it added to the 100-point composite (weight × sub-score).
- Cash flow +27.1/30.0
- ARV discount +15.0/15.0
- DSCR +9.4/10.0
- 1% rule +6.2/10.0
- Schools +5.1/10.0
- Rent growth +3.8/5.0
- Livability +3.8/5.0
- Condition / age +2.5/5.0
- Appreciation +0.0/10.0
$149,000
🖨 Deal sheet 📄 Offer letter ✓ Due diligence
Listing remarks MLS
This Home Is A Real Beauty! Move In Ready! Living Room Has Hardwood Floors, Kitchen Has Been Updated, Includes Stainless Steel Appliances. Large Lot 120 x 128. 24 x 24 Garage. New Roof In 2014. Gas Or Electric Hookup For Clothes Dryer. Penn Harris Madison District. Curtains And Rods Reserved. Holes Will Be Patched After Removal. All Blinds To Stay. Highest and Best Offers to be submitted by noon tomorrow.
Key facts
- Large laundry room
- Functional layout
- Center island
Tags
Neighborhood map
What this means for you Summary
Snapshot
- This is a 3-bed/1.0-bath single-family listed at $149k.
Deal economics
- At list price, monthly cash flow is $420 ($5k/yr) — positive.
- The deal already cash-flows at list — no discount required.
- Meets the 1% rule at list price ($2k rent vs $149k).
- Recommended offer: $140k (6.0% below list) — sets the bar for market timing.
- Cap rate 9.7% vs local median 5.3% in Mishawaka — top-decile yield for the area; either an underpriced asset or a hidden risk that comps aren't pricing in. Stress-test before assuming the spread holds.
Location & tenants
- Location reads 76/100 on livability (#53 in IN, #3,586 nationally) — a middle-class / working-renter tenant base. Strengths: cost of living A+, housing A+, health & safety B; Watch: amenities F, employment F.
- Penn-Harris-Madison School Corporation (suburban): math 54% / reading 64% proficiency, ranked #19 of 301 in IN (top 6%) — acceptable for families but not a draw, mixed tenant base, ~2y average lease.
- Zoned schools: Elsie Rogers Elementary School (math 52% / reading 47%, grade D, #279 of 994 statewide, top 30%, 386 students, 42% FRL); Schmucker Middle School (math 40% / reading 56%, grade C-, #60 of 330 statewide, top 18%, 1,004 students, 36% FRL); Penn High School (math 53% / reading 83%, grade B, #22 of 369 statewide, top 6%, 3,624 students, 27% FRL).
- Market conditions: Rents rising fast (+5.2%/yr); 74 active listings in the ZIP; 754 units permitted in St. Joseph County in 2024 (460 in 5+ unit buildings).
- This rent runs 35% of the median local income ($57k/yr) — at the standard rent-burdened threshold; future hikes will face affordability resistance.
Forward outlook
- Local home prices are declining (-3.0%/yr); year-one equity from $1k of loan paydown is wiped out by about $4k of value loss. Plan a longer hold.
- At projected returns (-3.0% appreciation + 5.2% rent growth), your $42k cash investment doubles in ~8 years — after that, you're playing with house money.
Negotiation context
- It's been on market 70 days — a 6% lower offer ($140k) is reasonable based on typical stale-listing flexibility.
- 3 sale attempts since 8y ago; this cycle's ask has dropped $16k (10%) from the opening price — seller is motivated, your offer sets the floor, not the list.
- Current owner paid $115k; 30% above their basis — modest negotiation headroom, anchor on the comps not their cost.
Risks & watch-outs
- Watch-outs: built in 1950 — expect roof / HVAC / electrical / plumbing capex.
Questions for the listing agent
- It's been on market 70 days. Have you received any prior offers? Is the seller open to a 6% concession, seller financing, or rate buy-down credit?
- Built in 1950 — when were the roof, HVAC, electrical panel, plumbing, and water heater last replaced?
- Why hasn't it sold? Are there any deal-killer items the seller is aware of (foundation, flood, title, zoning, code violations)?
- Is there a deadline driving the sale (1031 exchange, divorce, estate, relocation)? That informs how much negotiation room exists.
- What's the average days-on-market for RENTAL listings here right now (not sales)? A rising rental-DOM trend means longer vacancies and softer asking-rent achievability than the comps imply.
- What's the recent tenant-quality profile in this submarket — average credit score on applications, eviction rate, late-payment / NSF rate, and stable-employment percentage? A property-management company in the area should have these aggregated.
- How much new for-sale + rental construction is in the pipeline within 1–3 miles? Heavy new supply typically softens prices + rents 12–24 months out; constrained supply supports both.
Investment metrics
- 1% rule
- 1.12% ✓
- Cap rate
- 9.67%
- Cash-on-cash
- 12.07%
- DSCR
- 1.54
- GRM
- 7.4
CMA / ARV
- ARV (on-the-fly)
- $199,680
- Comps found
- 12
Show comp detail 12 sales within ~0.75 mi
| Address | Dist | Beds/Ba | Sqft | Sold | Price | $/sf | Match |
|---|---|---|---|---|---|---|---|
| 13320 La Salle Ave | 0.27mi | 3/2.0 | 1,286 (+0%) | 2mo | $175,000 | $136 | 81 |
| 56170 Miller Ave | 0.27mi | 3/1.0 | 1,216 (-5%) | 2mo | $200,000 | $164 | 77 |
| 4116 Cassell Ave | 0.63mi | 3/1.0 | 1,296 (+1%) | 1mo | $202,000 | $156 | 68 |
| 13551 Haynes Ave | 0.28mi | 2/1.0 (-1) | 1,152 (-10%) | 6mo | $180,000 | $156 | 60 |
| 3751 Terry Ln | 0.62mi | 3/1.5 | 1,360 (+6%) | 8mo | $230,000 | $169 | 52 |
| 56315 Francis St | 0.10mi | 3/2.0 | 1,440 (+12%) | 23mo | $208,000 | $144 | 52 |
| 12920 Mckinley Hwy | 0.69mi | 3/1.0 | 1,326 (+4%) | 18mo | $110,000 | $83 | 47 |
| 13721 Esther Ave | 0.46mi | 3/1.5 | 1,462 (+14%) | 8mo | $224,000 | $153 | 46 |
| 4003 Pleasant Point Ct | 0.73mi | 3/1.0 | 1,384 (+8%) | 13mo | $140,000 | $101 | 41 |
| 56325 Elm Rd | 0.73mi | 3/1.0 | 1,377 (+8%) | 16mo | $215,000 | $156 | 40 |
| 4018 Cassell Ave | 0.56mi | 2/1.0 (-1) | 1,403 (+10%) | 22mo | $170,000 | $121 | 34 |
| 211 Manchester Dr | 0.68mi | 3/2.0 | 1,104 (-14%) | 16mo | $260,000 | $236 | 28 |
Match score weights: distance 35% · size 25% · config 20% · recency 20%. Top-matched comps best support the ARV.
Projected returns pro-forma
-3.0% appreciation · 5.2% rent growth · sell at horizon
- IRR
- 3.8%
- Equity multiple
- 1.15×
- Total profit
- $6,331
- Equity at exit
- $22,216
- IRR
- 15.2%
- Equity multiple
- 2.34×
- Total profit
- $56,002
- Equity at exit
- $12,883
Cash invested: $41,720 (down + closing). Projections, not guarantees.
Landlord ↔ Tenant lean methodology
- Overall (STATE)
- 90 Strongly Landlord-Friendly
- State Indiana
- 90 Strongly Landlord-Friendly · R+11
- County
- — inherits STATE
- City
- — inherits STATE
ZIP-level market 46545
- Rents YoY
- 5.2%
- Active inventory
- 74
- Price-to-rent
- 7.4×
Monthly cashflow live
- Estimated rent
- $1,676 medium interval (Pro) →
- Mortgage (P&I)
- −$781
- Tax from tax record
- −$61 /mo · $728/yr
- Insurance
- −$62
- HOA
- −$0
- Vacancy / Maint / Mgmt
- −$352
- Net cashflow
- $420
Break-even live
UW: 25.0% down · 7.5% · 30yr · 1.5% tax · 5.0% vac · 8.0% maint · 8.0% mgmt
Financing live
Cash to close
- Down payment
- $37,250
- Closing costs
- $4,470
- Reserves months
- —
- Total cash needed
- —
Loan-product check · same deal, 3 products live
Conventional
25% down · 7.5% · 30yr
- Down + closing
- —
- Monthly P&I
- —
- Monthly cashflow
- —
- DSCR
- —
- Eligible?
- —
Personal DTI + credit; lowest rate.
DSCR
20% down · 8.5% · 30yr
- Down + closing
- —
- Monthly P&I
- —
- Monthly cashflow
- —
- DSCR
- —
- Eligible?
- —
No personal income docs; deal must DSCR.
Hard money
10% down · 12.0% · 12mo
- Down + closing
- —
- Monthly P&I
- —
- Monthly cashflow
- —
- DSCR
- —
- Eligible?
- —
Short-term bridge; refi at stabilization.
Listing history 11 events
-
2025-12-11status Pending
-
2025-11-14historical Active Under Contract
-
2025-11-08status Active
-
2025-11-08price $149,000
-
2025-10-27historical Active Under Contract
-
2025-10-23price $155,000
-
2025-10-16price $159,000
-
2025-10-02$165,000 Active
-
2018-11-02soldstatus $115,000 409-char remark
Show marketing remark (409 chars)
This Home Is A Real Beauty! Move In Ready! Living Room Has Hardwood Floors, Kitchen Has Been Updated, Includes Stainless Steel Appliances. Large Lot 120 x 128. 24 x 24 Garage. New Roof In 2014. Gas Or Electric Hookup For Clothes Dryer. Penn Harris Madison District. Curtains And Rods Reserved. Holes Will Be Patched After Removal. All Blinds To Stay. Highest and Best Offers to be submitted by noon tomorrow.
-
2018-09-12$115,000 409-char remark
Show marketing remark (409 chars)
This Home Is A Real Beauty! Move In Ready! Living Room Has Hardwood Floors, Kitchen Has Been Updated, Includes Stainless Steel Appliances. Large Lot 120 x 128. 24 x 24 Garage. New Roof In 2014. Gas Or Electric Hookup For Clothes Dryer. Penn Harris Madison District. Curtains And Rods Reserved. Holes Will Be Patched After Removal. All Blinds To Stay. Highest and Best Offers to be submitted by noon tomorrow.
-
2011-02-09soldstatus $33,355
ⓘ Source: listings_history table (triggers on properties + properties_extension) + one-shot
backfill from property_details.listing_events for pre-trigger history.
Tax reassessment forecast IN · Partial reset (capped growth)
- Current annual tax
- $728 · $61/mo
- Projected year-2 tax
- $997 · $83/mo
- Expected delta
- +$269/yr (+$22/mo · 37.0%)
ⓘ Screening estimate from a state-policy table — verify with the county assessor before closing.
Climate risk First Street
- Flood 1/10 Low FEMA zone X (unshaded) · 0% chance over 30 yrs
- Wildfire 1/10 Low
- Heat 2/10 Low 7 d/yr ≥100°F today · 16 d/yr by 30 yrs out
- Wind 2/10 Low
- Air quality 3/10 Moderate 2 unhealthy d/yr today · 3 by 30 yrs out
Nearby sold comps map
Loading sold comps map…
Walkable amenities ~0.75 mi
Loading nearby amenities…
Taxation est. · year 1
- Rental income
- $20,110
- − Mortgage interest
- −$8,346
- − Property taxes
- −$728
- − Insurance
- −$745
- − Repairs & maintenance
- −$1,609
- − Management
- −$1,609
- − Depreciation
- −$4,335
- Taxable income
- $2,739
- Est. tax owed @ 24.0%
- −$657
- After-tax cash flow
- $4,380/yr
For passive investors: Depreciation is non-cash, so a rental often shows a tax loss while cash-flowing — sheltering income. Rental losses are passive: they offset passive income freely, and up to $25,000/yr can offset ordinary (W-2) income if you actively participate and your MAGI is under $100k (phasing out to $0 by $150k); unused losses carry forward. On sale, claimed depreciation is recaptured at up to 25%, and gains may owe capital-gains tax (a 1031 exchange can defer both). Figures are a year-1 estimate at your 24.0% rate — not tax advice; consult a CPA.
Schools (NCES district)
- District
- Penn-Harris-Madison School Corporation
- NCES district ID
- 1808760
- Math proficiency
- 54% ▼ -11.00%
- Reading proficiency
- 64% ▼ -6.00%
- Median HH income
- $59,421
- Composite
- 51.11/100
- National rank
- #1764
- State rank
- #19 of 301 in IN
Livability — Mishawaka
- Score
- 76/100
- State rank
- #53
- US rank
- #3586
Category grades
Schools grade is shown separately in the Schools card above.
Census & demographics
- County
- Saint Joseph County · 189,048 people
- City population
- 57,683
- Metro
- South Bend-Mishawaka, IN-MI
- Population (ZIP)
- 26,606
- Household income
- $56,865
- Rent vs Own
- Severe rent burden
- 1243.0
Population outlook (St. Joseph County) Hauer SSP2
- Today (2025)
- 273,186 people
- By 2030
- 273,594 · +0.1%
- By 2040
- 271,641 · -0.6%
- By 2050
- 269,187 · -1.5%
- By 2075
- 263,136 · -3.7%
- By 2100
- 245,659 · -10.1%
Race, ethnicity, and origin ACS 2023
- Neighborhood character
- Predominantly White (78%)
- Race & ethnicity
- White 78% Two or more races 8% Black 7% Hispanic / Latino 6% Asian 3%
- Hispanic origin (detail)
- Mexican 2%
- Common ancestry
- Romanian 6% Lithuanian 2% English 2%
- Foreign-born
- 8% · Canada, China, South Korea
- Languages at home
- 90% English-only · Spanish 4% Chinese 1% Other Indo-European 1%
Political lean MEDSL · St. Joseph
- 2024 margin
- Toss-up / Even · D 50.0% · R 48.5% · Other 1.5%
- 2008→2024 swing
- -15.6pp toward R · 2008: 17.1pp · 2024: 1.5pp
- All cycles
- 2024: D+1.5 2020: D+5.8 2016: D+0.2 2012: D+3.5 2008: D+17.1
Not yet ingested
- Civics
- —
Market trends
- HPI YoY
- ▼ -114.83%
- Current HPI
- 188.2811
- Rent YoY
- ▲ 5.20%
- Metro
- South Bend-Mishawaka, IN-MI
- State GDP YoY
- ▲ 2.90%
- F500 in state
- 18
Industry mix (Fortune 500 HQ in IN)
| Industry | F500 HQs | Revenue |
|---|---|---|
| Industrial Machinery | 2 | $37B |
|
||
| Healthcare | 1 | $177B |
|
||
| Pharmaceuticals | 1 | $45B |
|
||
| Metals / Steel | 1 | $18B |
|
||
| Agriculture | 1 | $17B |
|
||
| Packaging | 1 | $12B |
|
||
Price history
+346.7% since first listed11 events — show timeline
- 2025-12-11 Pending — IRMLS
- 2025-11-14 Contingent — IRMLS
- 2025-11-08 Relisted — IRMLS
- 2025-11-08 Price Changed $149,000 IRMLS
- 2025-10-27 Contingent — IRMLS
- 2025-10-23 Price Changed $155,000 IRMLS
- 2025-10-16 Price Changed $159,000 IRMLS
- 2025-10-02 Listed $165,000 IRMLS
- 2018-11-02 Sold (MLS) $115,000 IRMLS
- 2018-09-12 Listed $115,000 IRMLS
- 2011-02-09 Sold (Public Records) $33,355 Public Records
Property tax history
+7.7%/yrLatest (2023): $728 · -8.9% YoY. Source: county tax records.
Cash-flow waterfall
monthlySold comps — $/sqft
last 12 mo · ≤1 miLoading sold comps…