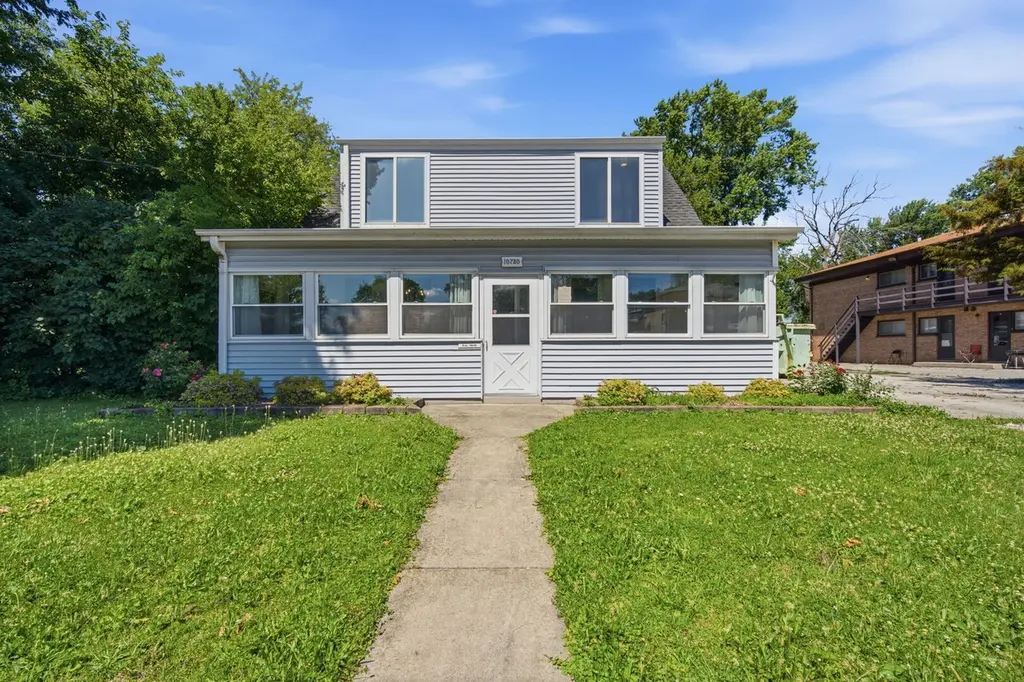
10730 S Ridgeland St · Worth, IL
Flood risk 1/10 · Minimal
- FEMA flood zone
- X (unshaded)
- Chance of flooding over 30 yrs
- 0.0%
- Est. flood insurance / yr
- $473 – $860
Fire risk 1/10 · Minimal
- Est. fire insurance / yr
- $804 – $1,492
Heat risk 3/10 · Minor
- Hot days now (above 101°F)
- 7 days/yr
- Hot days in 30 yrs
- 15 days/yr
Wind risk 2/10 · Minimal
- Chance of severe wind over 30 yrs
- —
Air-quality risk 3/10 · Minor
- Unhealthy air days now
- 4 days/yr
- Unhealthy air days in 30 yrs
- 4 days/yr
Risk factors via First Street. Map © Google.
Why this score? — see what drove the F grade
The composite is a weighted blend of 9 inputs, each scored 0–100. Each bar is that input's sub-score; the figure is the points it added to the 100-point composite (weight × sub-score).
- Livability +4.0/5.0
- Cash flow +3.0/30.0
- Rent growth +2.5/5.0
- Condition / age +2.5/5.0
- Schools +1.6/10.0
- 1% rule +0.0/10.0
- DSCR +0.0/10.0
- ARV discount +0.0/15.0
- Appreciation +0.0/10.0
$399,000
🖨 Deal sheet (PDF) 📄 Offer letter ✓ Due diligence
Listing remarks
Welcome to your dream home! This beautifully charming residence boasts 4 spacious bedrooms and 2 full baths (one conveniently located upstairs and another downstairs), plus an additional half bath on the main level. The expansive living room has been the heart of countless unforgettable family gatherings, seamlessly connecting to the dining room and a delightful eat-in kitchen-an ideal setup for hosting summer barbecues and creating lasting memories. The kitchen opens directly to the backyard, easily accessible through the laundry room. Venture further into the laundry, and you'll discover a sizable storage basement with three distinct areas, perfect for a crafting station, playroom, cozy l
Key facts
- Large deck
- Generous patio
- Small private deck
Tags
Property features AI
Finance
- Other: Lot roughly 0.5–0.99 acre
- HOA & community: No required master association fee; Community features: park
Exterior
- Parking: Detached garage (owned), asphalt driveway; Total 2 parking spaces, 2 garage spaces
- Utilities: Lake Michigan water source; Public sewer
- Home design: Detached single-family home; Two-story; Fee simple ownership; Built 81–90 years ago; Built before 1978
- Construction: Vinyl siding and brick exterior; Asphalt roof
- Exterior features: Deck; Chain-link fence; Curbs, sidewalks, street lights, paved streets; Commuter bus access nearby
Interior
- Kitchen: Main-level kitchen with breakfast area (14 x 12), ceramic tile; Second-level kitchen (11 x 10), vinyl; Range; Microwave; Dishwasher; Refrigerator
- Bedrooms: Main-level master bedroom (includes full bath); Second-level bedroom (20 x 15) with drapes; Second-level bedroom (16 x 15) with drapes; Second-level bedroom (18 x 13)
- Flooring: Laminate flooring; Vinyl flooring in several rooms; Ceramic tile in main kitchen
- Bathrooms: Two full bathrooms; One half bathroom
- Heating & cooling: Natural gas heating; Central air conditioning
- Interior features: First-floor bedroom; 8 total rooms; Unfinished/partial basement; Combined dining and living room
- Laundry & utility: Main-level laundry room (13 x 10); Washer and dryer included; Gas dryer hookup; Laundry in unit
Neighborhood map
What this means for you Summary
Snapshot
- This is a 3-bed/1.5-bath single-family listed at $399k.
Deal economics
- At list price, monthly cash flow is $-1k ($-15k/yr) — negative.
- To cash-flow at today's rent, offer at most $171k (57.2% below list).
- To meet the 1% rule (rent ≥ 1% of price), the offer needs to be $193k (51.6% below list).
- Recommended offer: $171k (57.2% below list) — sets the bar for cash-flow.
- Cap rate 2.4% vs local median 5.0% in Worth — below-typical yield; the buyer is paying a premium for something (appreciation thesis, condition, location) that the cap rate doesn't capture.
Location & tenants
- Location reads 79/100 on livability (#128 in IL, #2,352 nationally) — a middle-class / working-renter tenant base. Strengths: commute A+, cost of living A+, housing A+; Watch: amenities F.
- Chsd 218 (suburban): math 14% / reading 20% proficiency, ranked #454 of 620 in IL (top 73%) — low school quality limits family demand, transient renter base, plan for 1-2y turnover.
- Zoned schools: Worth Elem School (math 22% / reading 22%, grade F, #940 of 2,056 statewide, top 49%, 379 students, 0% FRL); Worth Jr High School (math 13% / reading 26%, grade F, #425 of 665 statewide, top 65%, 346 students, 0% FRL); Dd Eisenhower High Sch (Campus) (math 10% / reading 13%, grade F, #520 of 693 statewide, top 75%, 1,841 students, 0% FRL).
- Market conditions: 17 active listings in the ZIP; 19 comparable units currently listed for rent nearby; rentals at typical pace (median 17d on market — plan ~3-4 weeks tenant-placement turnaround); 6,272 units permitted in Cook County in 2024 (4,658 in 5+ unit buildings).
Forward outlook
- Local home prices are declining (-3.0%/yr); year-one equity from $3k of loan paydown is wiped out by about $12k of value loss. Plan a longer hold.
Negotiation context
- Only 3 days on market — expect competitive offers; lowballing is unlikely to land.
- 4 sale attempts since 2y ago with the ask held roughly flat each time — persistent listings suggest the price (not the market) is what's stuck; bring a comps-based counter.
- Current owner paid $170k; list at $399k implies a 135% gain — meaningful room to come down on a strong offer.
Risks & watch-outs
- Watch-outs: built in 1943 — expect roof / HVAC / electrical / plumbing capex.
Questions for the listing agent
- What do current leases actually rent for vs. the listed asking? Can we see a recent rent roll and the last 12 months of T-12 income?
- Built in 1943 — when were the roof, HVAC, electrical panel, plumbing, and water heater last replaced?
- Is there a deadline driving the sale (1031 exchange, divorce, estate, relocation)? That informs how much negotiation room exists.
- Schools are D-rated, which usually means shorter tenancies and higher turnover. Who's the typical renter profile here, and what's been the actual vacancy rate?
- The area grade is low — what's the realistic commute time and amenity access for the typical tenant pool here? Any planned neighborhood developments (good or bad) we should know about?
- What's the average days-on-market for RENTAL listings here right now (not sales)? A rising rental-DOM trend means longer vacancies and softer asking-rent achievability than the comps imply.
- What's the recent tenant-quality profile in this submarket — average credit score on applications, eviction rate, late-payment / NSF rate, and stable-employment percentage? A property-management company in the area should have these aggregated.
- How much new for-sale + rental construction is in the pipeline within 1–3 miles? Heavy new supply typically softens prices + rents 12–24 months out; constrained supply supports both.
Investment metrics
- 1% rule
- 0.48% ✗
- Cap rate
- 2.41%
- Cash-on-cash
- -13.87%
- DSCR
- 0.38
- GRM
- 17.2
CMA / ARV
- ARV (on-the-fly)
- $293,040
- Comps found
- 12
Show comp detail 12 sales within ~0.75 mi
| Address | Dist | Beds/Ba | Sqft | Sold | Price | $/sf | Match |
|---|---|---|---|---|---|---|---|
| 10901 S Nagle Ave | 0.20mi | 3/1.0 | 1,152 (+4%) | 5mo | $264,000 | $229 | 79 |
| 10816 Princess Ave | 0.17mi | 2/1.0 (-1) | 1,056 (-5%) | 4mo | $245,000 | $232 | 74 |
| 10345 Barnard Dr | 0.46mi | 3/2.0 | 1,093 (-2%) | 2mo | $324,900 | $297 | 73 |
| 6524 Ridge Dr | 0.36mi | 4/2.0 (+1) | 1,072 (-3%) | 0mo | $372,000 | $347 | 70 |
| 10532 Oak Ave | 0.32mi | 3/1.0 | 1,033 (-7%) | 3mo | $245,000 | $237 | 69 |
| 10812 Princess Ave | 0.16mi | 4/1.0 (+1) | 1,209 (+9%) | 2mo | $225,000 | $186 | 68 |
| 10615 S Plahm Ct | 0.58mi | 3/1.5 | 1,155 (+4%) | 2mo | $360,000 | $312 | 65 |
| 10854 Lyman Ave | 0.42mi | 3/1.0 | 1,014 (-9%) | 1mo | $285,000 | $281 | 64 |
| 5901 108th Pl | 0.66mi | 3/2.0 | 1,132 (+2%) | 1mo | $315,000 | $278 | 63 |
| 11241 S Nagle Ave | 0.64mi | 3/1.5 | 1,205 (+9%) | 2mo | $220,000 | $183 | 54 |
| 6801 W 109th St | 0.54mi | 3/1.0 | 1,000 (-10%) | 4mo | $236,500 | $237 | 53 |
| 5825 109th St | 0.74mi | 3/1.0 | 1,191 (+7%) | 3mo | $315,000 | $264 | 49 |
Match score weights: distance 35% · size 25% · config 20% · recency 20%. Top-matched comps best support the ARV.
Projected returns pro-forma
-3.0% appreciation · 3.0% rent growth · sell at horizon
- IRR
- -42.5%
- Equity multiple
- -0.31×
- Total profit
- $-146,819
- Equity at exit
- $59,492
- IRR
- -72.6%
- Equity multiple
- -1.09×
- Total profit
- $-233,466
- Equity at exit
- $34,498
Cash invested: $111,720 (down + closing). Projections, not guarantees.
Landlord ↔ Tenant lean methodology
- Overall (STATE)
- 43 Moderately Tenant-Leaning
- State Illinois
- 43 Moderately Tenant-Leaning · D+7
- County
- — inherits STATE
- City
- — inherits STATE
ZIP-level market 60482
- Home prices YoY
- -27.3%
- Active inventory
- 17
- Price-to-rent
- 17.2×
Monthly cashflow live
- Estimated rent
- $1,930 high interval (Pro) →
- Mortgage (P&I)
- −$2,092
- Tax from tax record
- −$557 /mo · $6,690/yr
- Insurance
- −$166
- HOA
- −$0
- Vacancy / Maint / Mgmt
- −$405
- Net cashflow
- $-1,291
Break-even live
Sensitivity live
| Price | -10% $-1,065 | -5% $-1,178 | +0% $-1,291 | +5% $-1,404 | +10% $-1,517 |
|---|---|---|---|---|---|
| Rent | -10% $-1,444 | -5% $-1,367 | +0% $-1,291 | +5% $-1,215 | +10% $-1,139 |
| Rate | -1.0pp $-1,090 | -0.5pp $-1,190 | base $-1,291 | +0.5pp $-1,394 | +1.0pp $-1,500 |
UW: 25.0% down · 7.5% · 30yr · 1.5% tax · 5.0% vac · 8.0% maint · 8.0% mgmt
Financing live
Cash to close
- Down payment
- $99,750
- Closing costs
- $11,970
- Reserves months
- —
- Total cash needed
- —
Loan-product check · same deal, 3 products live
Conventional
25% down · 7.5% · 30yr
- Down + closing
- —
- Monthly P&I
- —
- Monthly cashflow
- —
- DSCR
- —
- Eligible?
- —
Personal DTI + credit; lowest rate.
DSCR
20% down · 8.5% · 30yr
- Down + closing
- —
- Monthly P&I
- —
- Monthly cashflow
- —
- DSCR
- —
- Eligible?
- —
No personal income docs; deal must DSCR.
Hard money
10% down · 12.0% · 12mo
- Down + closing
- —
- Monthly P&I
- —
- Monthly cashflow
- —
- DSCR
- —
- Eligible?
- —
Short-term bridge; refi at stabilization.
Rent comps 19 comps
| Address | Beds | Baths | Sqft | Rent | $/sqft | DOM | Units | Dist |
|---|---|---|---|---|---|---|---|---|
| 6135 Birmingham St Chicago Ridge, IL | 3.0 | 2.0 | 1100 | $2,800 | $2.55 | 0d | 1 | 0.40mi |
| 10440 Natoma Ave #5 Chicago Ridge, IL | 2.0 | 1.0 | 850 | $1,700 | $2.00 | 0d | 1 | 0.42mi |
| 11011 S Lloyd Dr Worth, IL | 2.0 | 1.0 | 800 | $1,600 | $2.00 | 18d | 1 | 0.45mi |
| 10410 Moody Ave Unit 1S Chicago Ridge, IL | 2.0 | 1.0 | 900 | $1,600 | $1.78 | 14d | 1 | 0.49mi |
| 6139 Marshall Ave Apt 1E Chicago Ridge, IL | 2.0 | 2.0 | 950 | $1,850 | $1.95 | 4d | 1 | 0.56mi |
| 6005 Marshall Ave #8 Chicago Ridge, IL | 2.0 | 1.0 | 1000 | $1,700 | $1.70 | 6d | 1 | 0.58mi |
| 10326 Mayfield Ave Unit 1N Oak Lawn, IL | 4.0 | 2.0 | 1300 | $2,400 | $1.85 | 18d | 1 | 0.78mi |
| 10326 Mayfield Ave Oak Lawn, IL | 2.0 | 1.0 | 850 | $1,650 | $1.94 | 19d | 1 | 0.78mi |
| 10326 Mayfield Ave Apt 2S Oak Lawn, IL | 2.0 | 1.0 | 850 | $1,650 | $1.94 | 20d | 1 | 0.78mi |
| 10435 Menard Ave Oak Lawn, IL | 2.0 | 1.0 | 850 | $1,750 | $2.06 | 0d | 1 | 0.83mi |
| 10435 Menard Ave Oak Lawn, IL | 2.0 | 2.0 | 1050 | $1,850 | $1.76 | 26d | 1 | 0.83mi |
| 5644 105th St Unit 2W Oak Lawn, IL | 2.0 | 1.0 | 1100 | $1,750 | $1.59 | 26d | 1 | 0.91mi |
| 7121 W 110th St Unit 2W Worth, IL | 2.0 | 1.0 | 900 | $1,550 | $1.72 | 16d | 1 | 0.97mi |
| 11447 S Natoma Ave Worth, IL | 3.0 | 1.0 | 1000 | $2,850 | $2.85 | 0d | 1 | 0.97mi |
| 10541 Parkside Ave Unit 2W Chicago Ridge, IL | 2.0 | 2.0 | 1000 | $1,700 | $1.70 | 12d | 1 | 0.98mi |
| 10604 S Oak Tree Dr Worth, IL | 2.0 | 1.0 | 800 | $1,450 | $1.81 | 26d | 1 | 1.12mi |
| 9806 Marion Ave Oak Lawn, IL | 3.0 | 1.0 | 897 | $1,950 | $2.17 | 26d | 1 | 1.16mi |
| 9950 Sayre Ave Unit 108 Chicago Ridge, IL | 2.0 | 1.0 | 900 | $1,400 | $1.56 | 22d | 1 | 1.22mi |
| 10200 Mulberry Ln Bridgeview, IL | 2.0 | 2.0 | 1350 | $3,000 | $2.22 | 4d | 1 | 1.43mi |
Listing history 3 events
-
2026-06-21days on market $399,000 Active 3 DOM
-
2026-06-18remarks 699-char remark
-
2026-06-18$399,000 Active 1 DOM
ⓘ Source: listings_history table (triggers on properties + properties_extension) + one-shot
backfill from property_details.listing_events for pre-trigger history.
Tax reassessment forecast IL · Partial reset (capped growth)
- Current annual tax
- $6,690 · $557/mo
- Projected year-2 tax
- $7,874 · $656/mo
- Expected delta
- +$1,184/yr (+$99/mo · 17.7%)
ⓘ Screening estimate from a state-policy table — verify with the county assessor before closing.
Climate risk First Street
- Flood 1/10 Low FEMA zone X (unshaded) · 0% chance over 30 yrs
- Wildfire 1/10 Low
- Heat 3/10 Moderate 7 d/yr ≥101°F today · 15 d/yr by 30 yrs out
- Wind 2/10 Low
- Air quality 3/10 Moderate 4 unhealthy d/yr today · 4 by 30 yrs out
Nearby sold comps map
Loading sold comps map…
Walkable amenities ~0.75 mi
Loading nearby amenities…
Taxation est. · year 1
- Rental income
- $23,165
- − Mortgage interest
- −$22,350
- − Property taxes
- −$6,690
- − Insurance
- −$1,995
- − Repairs & maintenance
- −$1,853
- − Management
- −$1,853
- − Depreciation
- −$11,607
- Taxable loss
- −$23,183
- Est. tax savings @ 24.0%
- +$5,564
- After-tax cash flow
- $-9,929/yr
For passive investors: Depreciation is non-cash, so a rental often shows a tax loss while cash-flowing — sheltering income. Rental losses are passive: they offset passive income freely, and up to $25,000/yr can offset ordinary (W-2) income if you actively participate and your MAGI is under $100k (phasing out to $0 by $150k); unused losses carry forward. On sale, claimed depreciation is recaptured at up to 25%, and gains may owe capital-gains tax (a 1031 exchange can defer both). Figures are a year-1 estimate at your 24.0% rate — not tax advice; consult a CPA.
Schools (NCES district)
- District
- Chsd 218
- NCES district ID
- 1706540
- Math proficiency
- 14% ▼ -4.00%
- Reading proficiency
- 20% ▼ -1.00%
- Median HH income
- $57,166
- Composite
- 16.09/100
- National rank
- #9235
- State rank
- #454 of 620 in IL
Livability — Worth
- Score
- 79/100
- State rank
- #128
- US rank
- #2352
Category grades
Schools grade is shown separately in the Schools card above.
Census & demographics
- Census place
- Worth, IL
- City population
- 10,878
- Population (ZIP)
- 10,878
Population outlook (Cook County) Hauer SSP2
- Today (2025)
- 5,347,519 people
- By 2030
- 5,357,703 · +0.2%
- By 2040
- 5,324,924 · -0.4%
- By 2050
- 5,230,762 · -2.2%
- By 2075
- 4,785,735 · -10.5%
- By 2100
- 4,188,836 · -21.7%
Race, ethnicity, and origin ACS 2023
- Neighborhood character
- Predominantly White (69%)
- Race & ethnicity
- White 69% Hispanic / Latino 21% Two or more races 9% Asian 3% Black 3%
- Hispanic origin (detail)
- Mexican 18% Puerto Rican 1%
- Common ancestry
- Romanian 15% Iranian 3% Lithuanian 1%
- Foreign-born
- 20% · Canada
- Languages at home
- 66% English-only · Spanish 15% Arabic 8% Russian/Polish/Slavic 7%
Political lean MEDSL · Cook
- 2024 margin
- Solid D (+42.0) · D 70.4% · R 28.4% · Other 1.2%
- 2008→2024 swing
- -11.4pp toward R · 2008: 53.4pp · 2024: 42.0pp
- All cycles
- 2024: D+42.0 2020: D+50.3 2016: D+53.0 2012: D+49.4 2008: D+53.4
Not yet ingested
- Civics
- —
Market trends
- HPI YoY
- ▼ -96.51%
- Current HPI
- 256.694
- Rent YoY
- —
- Metro
- —
- State GDP YoY
- ▲ 1.59%
- F500 in state
- 60
Industry mix (Fortune 500 HQ in IL)
| Industry | F500 HQs | Revenue |
|---|---|---|
| Insurance | 4 | $201B |
|
||
| Consumer Goods | 4 | $87B |
|
||
| Industrial Machinery | 3 | $64B |
|
||
| Healthcare | 2 | $55B |
|
||
| Retail / Pharmacy | 1 | $148B |
|
||
| Agriculture / Food | 1 | $86B |
|
||
Price history
+134.7% since first listed12 events — show timeline
- 2026-06-18 Listed $399,000 MRED as Distributed by MLS Grid
- 2025-08-25 Listing Removed — MRED as Distributed by MLS Grid
- 2025-08-15 Price Changed — MRED as Distributed by MLS Grid
- 2025-06-26 Listing Removed — MRED as Distributed by MLS Grid
- 2025-06-26 Listed — MRED as Distributed by MLS Grid
- 2025-06-22 Price Changed — MRED as Distributed by MLS Grid
- 2025-05-30 Relisted — MRED as Distributed by MLS Grid
- 2025-05-30 Price Changed — MRED as Distributed by MLS Grid
- 2024-11-20 Listing Removed — MRED as Distributed by MLS Grid
- 2024-10-25 Price Changed — MRED as Distributed by MLS Grid
- 2024-08-07 Listed — MRED as Distributed by MLS Grid
- 2002-10-01 Sold (Public Records) $170,000 Public Records
Property tax history
+3.3%/yrLatest (2023): $6,690 · +25.7% YoY. Source: county tax records.
Cash-flow waterfall
monthlySold comps — $/sqft
last 12 mo · ≤1 miLoading sold comps…