 🏗️ New Construction
7419 64th St · Lubbock, TX
Flood risk No data
- FEMA flood zone
- —
- Chance of flooding over 30 yrs
- —
- Est. flood insurance / yr
- —
Fire risk No data
- Est. fire insurance / yr
- —
Heat risk No data
- Hot days now (above threshold)
- —
- Hot days in 30 yrs
- —
Wind risk No data
- Chance of severe wind over 30 yrs
- —
Air-quality risk No data
- Unhealthy air days now
- —
- Unhealthy air days in 30 yrs
- —
Risk factors via First Street. Map © Google.
Why this score? — see what drove the D grade
The composite is a weighted blend of 9 inputs, each scored 0–100. Each bar is that input's sub-score; the figure is the points it added to the 100-point composite (weight × sub-score).
- Cash flow +12.0/30.0
- ARV discount +7.5/15.0
- Condition / age +4.8/5.0
- Schools +4.4/10.0
- Livability +4.0/5.0
- DSCR +3.5/10.0
- 1% rule +3.4/10.0
- Rent growth +2.5/5.0
- Appreciation +0.0/10.0
$201,000
🖨 Deal sheet (PDF) 📄 Offer letter ✓ Due diligence
Listing remarks
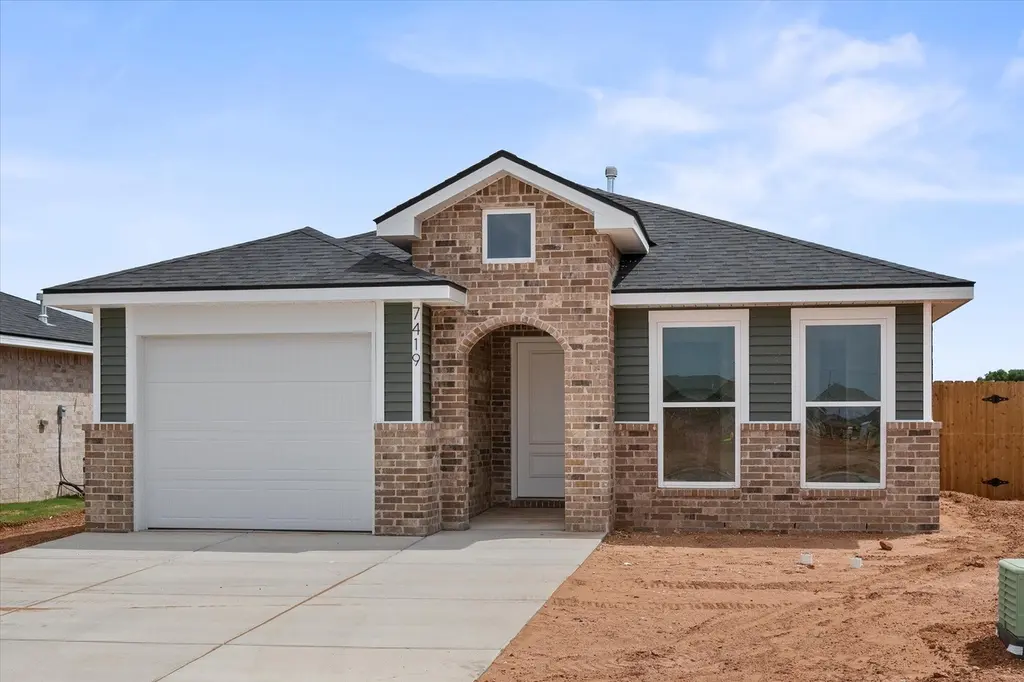
Buy NOW and get up to $7,000 Use-It-Your-Way Cash! Discover the charm and efficiency of our cottage-style homes—perfect for first-time buyers. The Kathleen floor plan features a beautiful brick and vinyl exterior, an inviting covered entry, and a bright open-concept layout with luxury vinyl plank flooring throughout the main areas. Enjoy a modern kitchen with an island, granite or quartz countertops, stainless steel appliances, and upgraded fixtures. This thoughtfully designed home also offers a private master suite with a walk-in closet, plus two additional bedrooms and a second full bath. The Kathleen combines style, comfort, and affordability—everything you need to feel at ho
Key facts
- Covered entry
- Modern kitchen
- Island
Tags
Property features AI
Exterior
- Parking: Attached garage; Driveway
- Utilities: Public water; Public sewer; Electricity available; Natural gas available; Cable available; Phone available
- Home design: Single family residence; New construction; Single-story
- Construction: Brick construction; Slab foundation; Composition roof; Built as new construction
- Exterior features: Private yard; Back yard; Front yard; Fenced yard (wood)
Interior
- Kitchen: Range; Free-standing range; Dishwasher; Disposal; Microwave
- Bedrooms: Total rooms: 5
- Flooring: Carpet; Vinyl
- Bathrooms: 2 full bathrooms
- Heating & cooling: Central heating (natural gas); Central air; Electric cooling; Ceiling fans
- Interior features: Ceiling fans; Open floor plan; Pantry
- Laundry & utility: Dedicated laundry room
Neighborhood map
What this means for you Summary
Snapshot
- This is a 3-bed/2.0-bath single-family listed at $201k. Condition is rated excellent.
Deal economics
- At list price, monthly cash flow is $-48 ($-580/yr) — negative.
- To cash-flow at today's rent, offer at most $194k (3.5% below list).
- To meet the 1% rule (rent ≥ 1% of price), the offer needs to be $170k (15.6% below list).
- Recommended offer: $170k (15.6% below list) — sets the bar for 1% rule.
Location & tenants
- Location reads 80/100 on livability (#37 in TX, #1,749 nationally) — a professional / high-income tenant draw. Strengths: commute A+, cost of living A+, housing A+; Watch: employment C-, crime F.
- Frenship ISD (urban): math 47% / reading 54% proficiency, ranked #162 of 826 in TX (top 20%) — acceptable for families but not a draw, mixed tenant base, ~2y average lease.
- Zoned schools: Bennett El (math 62% / reading 64%, grade B, #300 of 4,322 statewide, top 7%, 876 students, 43% FRL); Frenship Middle (math 46% / reading 50%, grade C-, #400 of 1,662 statewide, top 24%, 833 students, 47% FRL); Frenship H S (math 44% / reading 65%, grade C-, #379 of 1,632 statewide, top 26%, 3,247 students, 46% FRL).
- Market conditions: Rents soft (-0.1%/yr); 613 active listings in the ZIP; 7 comparable units currently listed for rent nearby; rentals lingering (median 46d on market — plan ~5-8 weeks vacancy on turnover, expect pricing pressure); 57% of comp listings sitting > 30 days — soft ceiling on asking rent; 2,219 units permitted in Lubbock County in 2024 (252 in 5+ unit buildings).
- This rent runs 33% of the median local income ($62k/yr) — at the standard rent-burdened threshold; future hikes will face affordability resistance.
Forward outlook
- Local home prices are declining (-3.0%/yr); year-one equity from $1k of loan paydown is wiped out by about $6k of value loss. Plan a longer hold.
- Lubbock County population projected at +39% by 2050 — long-run rental-demand tailwind backs the buy-and-hold thesis.
Negotiation context
- It's been on market 39 days — a 3% lower offer ($195k) is reasonable based on typical stale-listing flexibility.
- 2 sale attempts with the ask held roughly flat each time — persistent listings suggest the price (not the market) is what's stuck; bring a comps-based counter.
Questions for the listing agent
- What do current leases actually rent for vs. the listed asking? Can we see a recent rent roll and the last 12 months of T-12 income?
- It's been on market 39 days. Have you received any prior offers? Is the seller open to a 16% concession, seller financing, or rate buy-down credit?
- Is there a deadline driving the sale (1031 exchange, divorce, estate, relocation)? That informs how much negotiation room exists.
- Schools are D-rated, which usually means shorter tenancies and higher turnover. Who's the typical renter profile here, and what's been the actual vacancy rate?
- Crime grade is F in this area — have there been break-ins, vandalism, or insurance claims at this property in the last 3 years? What carrier currently insures it and at what premium?
- The area grade is low — what's the realistic commute time and amenity access for the typical tenant pool here? Any planned neighborhood developments (good or bad) we should know about?
- What's the average days-on-market for RENTAL listings here right now (not sales)? A rising rental-DOM trend means longer vacancies and softer asking-rent achievability than the comps imply.
- What's the recent tenant-quality profile in this submarket — average credit score on applications, eviction rate, late-payment / NSF rate, and stable-employment percentage? A property-management company in the area should have these aggregated.
- How much new for-sale + rental construction is in the pipeline within 1–3 miles? Heavy new supply typically softens prices + rents 12–24 months out; constrained supply supports both.
Investment metrics
- 1% rule
- 0.84% ✗
- Cap rate
- 6.00%
- Cash-on-cash
- -1.03%
- DSCR
- 0.95
- GRM
- 9.9
CMA / ARV
No comps found within radius.
Projected returns pro-forma
-3.0% appreciation · 0.0% rent growth · sell at horizon
- IRR
- -21.4%
- Equity multiple
- 0.28×
- Total profit
- $-40,595
- Equity at exit
- $29,970
- IRR
- -24.3%
- Equity multiple
- -0.04×
- Total profit
- $-58,427
- Equity at exit
- $17,379
Cash invested: $56,280 (down + closing). Projections, not guarantees.
Landlord ↔ Tenant lean methodology
- Overall (STATE)
- 87 Strongly Landlord-Friendly
- State Texas
- 87 Strongly Landlord-Friendly · R+5
- County
- — inherits STATE
- City
- — inherits STATE
ZIP-level market 79407
- Home prices YoY
- -16.3%
- Rents YoY
- -0.1%
- Active inventory
- 613
- Price-to-rent
- 9.9×
Monthly cashflow live
- Estimated rent
- $1,697 high interval (Pro) →
- Mortgage (P&I)
- −$1,054
- Tax est. 1.5%
- −$251 /mo · $3,015/yr
- Insurance
- −$84
- HOA
- −$0
- Vacancy / Maint / Mgmt
- −$356
- Net cashflow
- $-48
Break-even live
Sensitivity live
| Price | -10% $91 | -5% $21 | +0% $-48 | +5% $-118 | +10% $-187 |
|---|---|---|---|---|---|
| Rent | -10% $-182 | -5% $-115 | +0% $-48 | +5% $19 | +10% $86 |
| Rate | -1.0pp $53 | -0.5pp $3 | base $-48 | +0.5pp $-100 | +1.0pp $-153 |
UW: 25.0% down · 7.5% · 30yr · 1.5% tax · 5.0% vac · 8.0% maint · 8.0% mgmt
Financing live
Cash to close
- Down payment
- $50,250
- Closing costs
- $6,030
- Reserves months
- —
- Total cash needed
- —
Loan-product check · same deal, 3 products live
Conventional
25% down · 7.5% · 30yr
- Down + closing
- —
- Monthly P&I
- —
- Monthly cashflow
- —
- DSCR
- —
- Eligible?
- —
Personal DTI + credit; lowest rate.
DSCR
20% down · 8.5% · 30yr
- Down + closing
- —
- Monthly P&I
- —
- Monthly cashflow
- —
- DSCR
- —
- Eligible?
- —
No personal income docs; deal must DSCR.
Hard money
10% down · 12.0% · 12mo
- Down + closing
- —
- Monthly P&I
- —
- Monthly cashflow
- —
- DSCR
- —
- Eligible?
- —
Short-term bridge; refi at stabilization.
Rent comps 7 comps
| Address | Beds | Baths | Sqft | Rent | $/sqft | DOM | Units | Dist |
|---|---|---|---|---|---|---|---|---|
| 6313 Volney Ave Lubbock, TX | 2.0 | 2.0 | 1006 | $1,495 | $1.49 | 23d | 1 | 0.12mi |
| 5865 Virginia Ave Lubbock, TX | 3.0 | 2.0 | 1500 | $1,749 | $1.17 | 45d | 1 | 0.18mi |
| 5805 Virginia Ave Lubbock, TX | 3.0 | 2.0 | 1377 | $1,800 | $1.31 | 45d | 1 | 0.36mi |
| 1218 Preston TRL Unit A Wolfforth, TX | 3.0 | 2.0 | 1420 | $1,500 | $1.06 | 23d | 1 | 0.94mi |
| 1216 Donald Preston Dr Unit B Wolfforth, TX | 3.0 | 2.0 | 1450 | $1,400 | $0.97 | 45d | 1 | 1.47mi |
| 1224 Donald Preston Dr Unit B Wolfforth, TX | 3.0 | 2.0 | 1400 | $1,550 | $1.11 | 45d | 1 | 1.47mi |
| 6140 71st St Lubbock, TX | 3.0 | 2.5 | 1350 | $1,550 | $1.15 | 15d | 1 | 1.50mi |
Listing history 26 events
-
2026-06-17status $201,000 Pending 39 DOM
-
2026-06-17days on market $201,000 Active 39 DOM
-
2026-06-16days on market $201,000 Active 38 DOM
-
2026-06-15days on market $201,000 Active 37 DOM
-
2026-06-13days on market $201,000 Active 34 DOM
-
2026-06-10days on market $201,000 Active 32 DOM
-
2026-06-09days on market $201,000 Active 31 DOM
-
2026-06-08days on market $201,000 Active 30 DOM
-
2026-06-07days on market $201,000 Active 29 DOM
-
2026-06-03days on market $201,000 Active 26 DOM
-
2026-06-02days on market $201,000 Active 25 DOM
-
2026-06-01days on market $201,000 Active 24 DOM
-
2026-05-31days on market $201,000 Active 23 DOM
-
2026-05-30days on market $201,000 Active 22 DOM
-
2026-05-20price $201,000 702-char remark
-
2026-05-20price $201,000 356-char remark
-
2026-05-08$208,000 Active 702-char remark
-
2026-05-04status Active 356-char remark
-
2026-04-29historical 356-char remark
-
2026-04-28price $208,000 356-char remark
-
2026-04-16status Active 356-char remark
-
2026-04-16historical 356-char remark
-
2026-04-13price $213,830 356-char remark
-
2026-03-12price $207,830 356-char remark
-
2026-02-12price $204,830 356-char remark
-
2025-12-01$199,830 Active 356-char remark
ⓘ Source: listings_history table (triggers on properties + properties_extension) + one-shot
backfill from property_details.listing_events for pre-trigger history.
Nearby sold comps map
Loading sold comps map…
Walkable amenities ~0.75 mi
Loading nearby amenities…
Taxation est. · year 1
- Rental income
- $20,366
- − Mortgage interest
- −$11,259
- − Property taxes
- −$3,015
- − Insurance
- −$1,005
- − Repairs & maintenance
- −$1,629
- − Management
- −$1,629
- − Depreciation
- −$5,847
- Taxable loss
- −$4,019
- Est. tax savings @ 24.0%
- +$965
- After-tax cash flow
- $385/yr
For passive investors: Depreciation is non-cash, so a rental often shows a tax loss while cash-flowing — sheltering income. Rental losses are passive: they offset passive income freely, and up to $25,000/yr can offset ordinary (W-2) income if you actively participate and your MAGI is under $100k (phasing out to $0 by $150k); unused losses carry forward. On sale, claimed depreciation is recaptured at up to 25%, and gains may owe capital-gains tax (a 1031 exchange can defer both). Figures are a year-1 estimate at your 24.0% rate — not tax advice; consult a CPA.
Condition & rehab AI · 12 photos
This Kathleen floor plan home is move-in ready with excellent condition and a modern design. It offers a private master suite, two additional bedrooms, and an open-concept layout with luxury vinyl plank flooring. The home is located in a desirable neighborhood with a fenced yard and a covered entry.
Value-add opportunities
- Both landscaping — improves curb appeal and adds value
- Both furniture — adds comfort and personalization
- Both smart home integration — enhances convenience and adds value
Renovation cost estimate screening
Value-add ROI direction
- Both landscaping — improves curb appeal and adds value ↑
- Both furniture — adds comfort and personalization ↑
- Both smart home integration — enhances convenience and adds value ↑
ⓘ Cost ranges are severity-bucket heuristics (US national rule-of-thumb). Get contractor quotes + a written scope before underwriting a rehab budget.
Schools (NCES district)
- District
- Frenship ISD
- NCES district ID
- 4819830
- Math proficiency
- 47% ▼ -8.00%
- Reading proficiency
- 54% ▬ 0.00%
- Median HH income
- $54,376
- Composite
- 43.59/100
- National rank
- #2976
- State rank
- #162 of 826 in TX
Livability — Lubbock
- Score
- 80/100
- State rank
- #37
- US rank
- #1749
Category grades
Schools grade is shown separately in the Schools card above.
Census & demographics
- Census place
- Lubbock, TX
- County
- Lubbock County · 293,542 people
- City population
- 283,030
- Metro
- Lubbock, TX
- Population (ZIP)
- 24,000
- Household income
- $61,509
- Rent vs Own
- Severe rent burden
- 1914.0
Population outlook (Lubbock County) Hauer SSP2
- Today (2025)
- 345,960 people
- By 2030
- 371,449 · +7.4%
- By 2040
- 424,539 · +22.7%
- By 2050
- 481,150 · +39.1%
- By 2075
- 633,467 · +83.1%
- By 2100
- 746,853 · +115.9%
Race, ethnicity, and origin ACS 2023
- Neighborhood character
- Diverse neighborhood (Simpson 0.56)
- Race & ethnicity
- White 58% Hispanic / Latino 31% Two or more races 17% Black 4% Asian 3%
- Hispanic origin (detail)
- Mexican 27%
- Common ancestry
- Italian 2% Lithuanian 1% Slovak 1%
- Foreign-born
- 5% · Canada, South Korea, China
- Languages at home
- 83% English-only · Spanish 13% Other Asian/Pacific 1% Chinese 1%
Political lean MEDSL · Lubbock
- 2024 margin
- Solid R (+39.5) · D 29.7% · R 69.2% · Other 1.0%
- 2008→2024 swing
- -2.8pp toward R · 2008: -36.7pp · 2024: -39.5pp
- All cycles
- 2024: R+39.5 2020: R+32.2 2016: R+38.4 2012: R+40.9 2008: R+36.7
Not yet ingested
- Civics
- —
Market trends
- HPI YoY
- ▼ -44.87%
- Current HPI
- 229.9895
- Rent YoY
- ▼ -0.07%
- Metro
- Lubbock, TX
- State GDP YoY
- ▲ 3.95%
- F500 in state
- 110
Industry mix (Fortune 500 HQ in TX)
| Industry | F500 HQs | Revenue |
|---|---|---|
| Energy | 16 | $1,198B |
|
||
| Technology | 5 | $198B |
|
||
| Engineering / Construction | 4 | $72B |
|
||
| Energy Services | 3 | $60B |
|
||
| Utilities | 3 | $41B |
|
||
| Healthcare | 2 | $330B |
|
||
Price history
-3.4% since first listed5 events — show timeline
- 2026-06-17 Pending — LARMLS
- 2026-06-04 Relisted — LARMLS
- 2026-06-04 Pending — LARMLS
- 2026-05-20 Price Changed $201,000 LARMLS
- 2026-05-08 Listed $208,000 LARMLS
Cash-flow waterfall
monthlySold comps — $/sqft
last 12 mo · ≤1 miLoading sold comps…