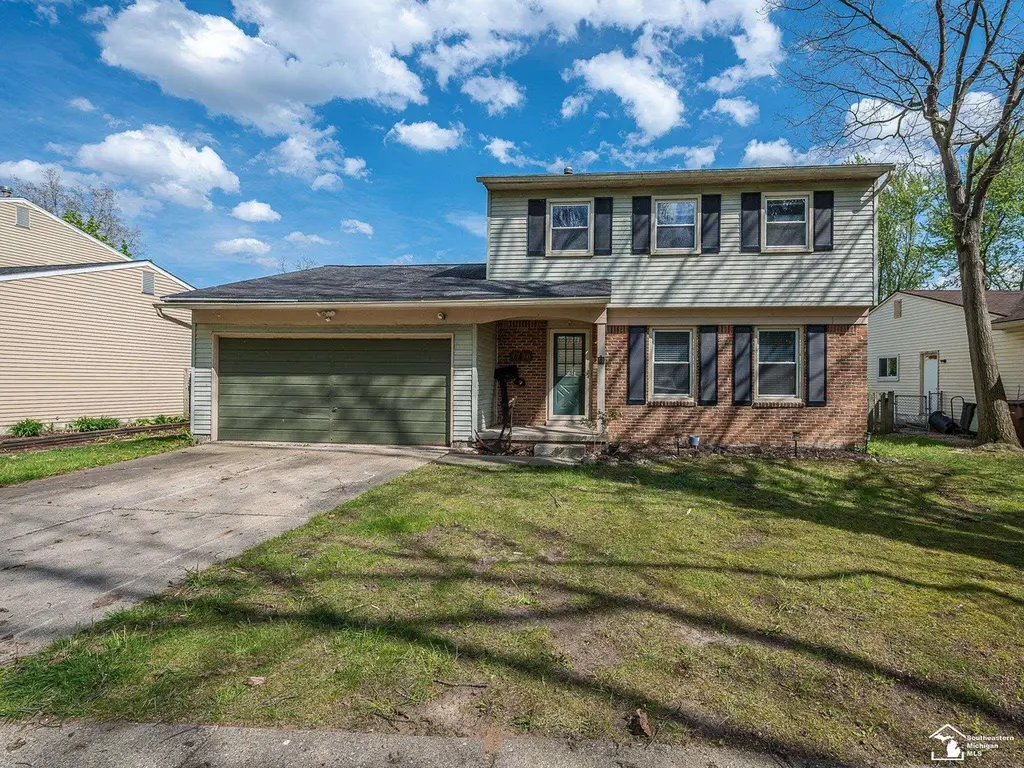
1790 Hamlet Dr · Ypsilanti, MI
Flood risk 1/10 · Minimal
- FEMA flood zone
- X (unshaded)
- Chance of flooding over 30 yrs
- 0.0%
- Est. flood insurance / yr
- $473 – $860
Fire risk 1/10 · Minimal
- Est. fire insurance / yr
- $784 – $1,456
Heat risk 2/10 · Minimal
- Hot days now (above 98°F)
- 7 days/yr
- Hot days in 30 yrs
- 15 days/yr
Wind risk 2/10 · Minimal
- Chance of severe wind over 30 yrs
- —
Air-quality risk 2/10 · Minimal
- Unhealthy air days now
- 1 days/yr
- Unhealthy air days in 30 yrs
- 2 days/yr
Risk factors via First Street. Map © Google.
Why this score? — see what drove the C- grade
The composite is a weighted blend of 9 inputs, each scored 0–100. Each bar is that input's sub-score; the figure is the points it added to the 100-point composite (weight × sub-score).
- Cash flow +16.3/30.0
- ARV discount +15.0/15.0
- 1% rule +5.0/10.0
- DSCR +5.0/10.0
- Livability +4.0/5.0
- Rent growth +3.6/5.0
- Condition / age +2.5/5.0
- Schools +1.3/10.0
- Appreciation +0.0/10.0
$199,900
🖨 Deal sheet 📄 Offer letter ✓ Due diligence
Listing remarks MLS
* Highest and Best Due by May 12th at 6pm * Come home to this lovely ranch in Woodland Acres. Three bedroom, one and half bath features an open floor plan. The home has a basement Has a family room with a gas fireplace. The large fenced back yard has lots of room for enjoying the pure Michigan summer. A two car attached garage rounds out this wonderful home.
Key facts
- 7,841 sq ft lot
- 2 garage spots
- Built 1977
Property features AI
Finance
- Other: Located in WAN WOODLAND ACRES subdivision; Cross streets: Buckingham / Hamlet
- Financial info: No financial details provided beyond HOA presence
- HOA & community: Homeowners association present
Exterior
- Parking: Attached garage with 2 parking spaces
- Security: No security features provided
- Utilities: Public water; Public sewer
- Home design: Single-family residence; Two-story home; Brick and vinyl siding exterior
- Construction: Brick and vinyl siding construction; Unfinished basement (foundation present)
- Exterior features: Lot dimensions approximately 62 x 125; Lot size about 0.18 acre; No pool
Interior
- Kitchen: No kitchen appliance details provided
- Bedrooms: Total of 7 rooms (includes bedrooms and living spaces)
- Flooring: No flooring details provided
- Bathrooms: 1 full bathroom; 1 half bathroom
- Heating & cooling: Forced air heating; Natural gas heating; No central air cooling
- Interior features: Gas water heater; Gas fireplace in the family room; Unfinished basement
- Laundry & utility: No laundry appliance details provided
Neighborhood map
What this means for you Summary
Snapshot
- This is a 3-bed/1.5-bath single-family listed at $200k.
Deal economics
- At list price, monthly cash flow is $108 ($1k/yr) — positive.
- The deal already cash-flows at list — no discount required.
- To meet the 1% rule (rent ≥ 1% of price), the offer needs to be $200k (0.1% below list).
- Recommended offer: $200k (0.1% below list) — sets the bar for 1% rule.
- Cap rate 6.9% vs local median 4.0% in Ypsilanti — top-decile yield for the area; either an underpriced asset or a hidden risk that comps aren't pricing in. Stress-test before assuming the spread holds.
Location & tenants
- Location reads 81/100 on livability (#71 in MI, #1,539 nationally) — a professional / high-income tenant draw. Strengths: amenities A+, commute A+, cost of living A+; Watch: crime F, employment D-.
- Ypsilanti Community Schools (suburban): math 11% / reading 20% proficiency, ranked #501 of 540 in MI (top 93%) — low school quality limits family demand, transient renter base, plan for 1-2y turnover; 69% free/reduced lunch — lower-income household profile, screen leases tightly.
- Market conditions: Rents rising fast (+4.4%/yr); 166 active listings in the ZIP; 3 comparable units currently listed for rent nearby; rentals at typical pace (median 18d on market — plan ~3-4 weeks tenant-placement turnaround); 996 units permitted in Washtenaw County in 2024 (492 in 5+ unit buildings).
- This rent runs 38% of the median local income ($63k/yr) — at the standard rent-burdened threshold; future hikes will face affordability resistance.
Forward outlook
- Local home prices are declining (-3.0%/yr); year-one equity from $1k of loan paydown is wiped out by about $6k of value loss. Plan a longer hold.
- Washtenaw County population projected at +25% by 2050 — long-run rental-demand tailwind backs the buy-and-hold thesis.
Negotiation context
- Only 9 days on market — expect competitive offers; lowballing is unlikely to land.
- 2 sale attempts with the ask held roughly flat each time — persistent listings suggest the price (not the market) is what's stuck; bring a comps-based counter.
- Current owner paid $121k; list at $200k implies a 65% gain — meaningful room to come down on a strong offer.
Questions for the listing agent
- Built in 1977 — when were the roof, HVAC, electrical panel, plumbing, and water heater last replaced?
- Is there a deadline driving the sale (1031 exchange, divorce, estate, relocation)? That informs how much negotiation room exists.
- Crime grade is F in this area — have there been break-ins, vandalism, or insurance claims at this property in the last 3 years? What carrier currently insures it and at what premium?
- What's the average days-on-market for RENTAL listings here right now (not sales)? A rising rental-DOM trend means longer vacancies and softer asking-rent achievability than the comps imply.
- What's the recent tenant-quality profile in this submarket — average credit score on applications, eviction rate, late-payment / NSF rate, and stable-employment percentage? A property-management company in the area should have these aggregated.
- How much new for-sale + rental construction is in the pipeline within 1–3 miles? Heavy new supply typically softens prices + rents 12–24 months out; constrained supply supports both.
Investment metrics
- 1% rule
- 1.00% ✗
- Cap rate
- 6.94%
- Cash-on-cash
- 2.32%
- DSCR
- 1.10
- GRM
- 8.3
CMA / ARV
- ARV (median comp)
- $323,908
- List price
- $199,900
- Delta
- -38.28%
- Verdict
- UNDERPRICED
- Comps
- 20 within 1.0 mi
Show comp detail 12 sales within ~0.75 mi
| Address | Dist | Beds/Ba | Sqft | Sold | Price | $/sf | Match |
|---|---|---|---|---|---|---|---|
| 1794 Hamlet Dr | 0.01mi | 3/1.5 | 1,684 (+3%) | 5mo | $296,000 | $176 | 90 |
| 1720 Bridgewater Dr | 0.33mi | 3/1.5 | 1,554 (-5%) | 2mo | $350,000 | $225 | 76 |
| 1567 Stratford Ct | 0.34mi | 3/1.5 | 1,537 (-6%) | 0mo | $180,000 | $117 | 74 |
| 1788 Savannah Ln | 0.40mi | 3/2.5 | 1,598 (-2%) | 5mo | $335,900 | $210 | 70 |
| 1477 Rue Deauville Blvd | 0.47mi | 3/1.5 | 1,546 (-5%) | 2mo | $309,000 | $200 | 68 |
| 8672 Hemlock Ct | 0.21mi | 3/2.0 | 1,412 (-14%) | 1mo | $285,000 | $202 | 65 |
| 1657 Devon St | 0.38mi | 3/1.0 | 1,776 (+9%) | 6mo | $239,900 | $135 | 61 |
| 8543 Barrington Dr | 0.53mi | 3/2.5 | 1,562 (-4%) | 6mo | $320,000 | $205 | 59 |
| 8473 Ardmoor Dr | 0.39mi | 3/3.0 | 1,750 (+7%) | 8mo | $350,000 | $200 | 57 |
| 8941 Bristol Ct | 0.47mi | 3/1.5 | 1,839 (+13%) | 0mo | $300,000 | $163 | 57 |
| 8248 Stamford Rd | 0.50mi | 3/2.0 | 1,424 (-13%) | 1mo | $389,000 | $273 | 52 |
| 1244 Lexington Pkwy | 0.59mi | 4/1.5 (+1) | 1,492 (-9%) | 7mo | $251,000 | $168 | 47 |
Match score weights: distance 35% · size 25% · config 20% · recency 20%. Top-matched comps best support the ARV.
Projected returns pro-forma
-3.0% appreciation · 4.38% rent growth · sell at horizon
- IRR
- -10.9%
- Equity multiple
- 0.60×
- Total profit
- $-22,606
- Equity at exit
- $29,806
- IRR
- 0.3%
- Equity multiple
- 1.02×
- Total profit
- $1,399
- Equity at exit
- $17,284
Cash invested: $55,972 (down + closing). Projections, not guarantees.
Landlord ↔ Tenant lean methodology
- Overall (STATE)
- 62 Landlord-Friendly
- State Michigan
- 62 Landlord-Friendly · EVEN
- County
- — inherits STATE
- City
- — inherits STATE
ZIP-level market 48198
- Rents YoY
- 4.4%
- Active inventory
- 166
- Price-to-rent
- 8.3×
Monthly cashflow live
- Estimated rent
- $1,998 medium interval (Pro) →
- Mortgage (P&I)
- −$1,048
- Tax from tax record
- −$339 /mo · $4,063/yr
- Insurance
- −$83
- HOA
- −$0
- Vacancy / Maint / Mgmt
- −$420
- Net cashflow
- $108
Break-even live
UW: 25.0% down · 7.5% · 30yr · 1.5% tax · 5.0% vac · 8.0% maint · 8.0% mgmt
Financing live
Cash to close
- Down payment
- $49,975
- Closing costs
- $5,997
- Reserves months
- —
- Total cash needed
- —
Loan-product check · same deal, 3 products live
Conventional
25% down · 7.5% · 30yr
- Down + closing
- —
- Monthly P&I
- —
- Monthly cashflow
- —
- DSCR
- —
- Eligible?
- —
Personal DTI + credit; lowest rate.
DSCR
20% down · 8.5% · 30yr
- Down + closing
- —
- Monthly P&I
- —
- Monthly cashflow
- —
- DSCR
- —
- Eligible?
- —
No personal income docs; deal must DSCR.
Hard money
10% down · 12.0% · 12mo
- Down + closing
- —
- Monthly P&I
- —
- Monthly cashflow
- —
- DSCR
- —
- Eligible?
- —
Short-term bridge; refi at stabilization.
Rent comps 3 comps
| Address | Beds | Baths | Sqft | Rent | $/sqft | DOM | Units | Dist |
|---|---|---|---|---|---|---|---|---|
| 1525 Devon St Ypsilanti, MI | 3.0 | 1.0 | 1300 | $2,300 | $1.77 | 43d | 1 | 0.43mi |
| 925 Terrace Ln Ypsilanti, MI | 2.0 | 1.0 | 1930 | $1,850 | $0.96 | 18d | 1 | 1.01mi |
| 1993 Arbor Woods Blvd Superior Charter Twp, MI | 3.0 | 2.0 | 1056 | $1,249 | $1.18 | 14d | 1 | 1.11mi |
Listing history 3 events
-
2026-05-10$199,900 Active 363-char remark
Show marketing remark (363 chars)
* Highest and Best Due by May 12th at 6pm * Come home to this lovely ranch in Woodland Acres. Three bedroom, one and half bath features an open floor plan. The home has a basement Has a family room with a gas fireplace. The large fenced back yard has lots of room for enjoying the pure Michigan summer. A two car attached garage rounds out this wonderful home.
-
1996-09-04soldstatus $121,225
ⓘ Source: listings_history table (triggers on properties + properties_extension) + one-shot
backfill from property_details.listing_events for pre-trigger history.
Tax reassessment forecast MI · Partial reset (capped growth)
- Current annual tax
- $4,063 · $339/mo
- Projected year-2 tax
- $4,063 · $339/mo
- Expected delta
- $0/yr ($0/mo · 0.0%)
ⓘ Screening estimate from a state-policy table — verify with the county assessor before closing.
Climate risk First Street
- Flood 1/10 Low FEMA zone X (unshaded) · 0% chance over 30 yrs
- Wildfire 1/10 Low
- Heat 2/10 Low 7 d/yr ≥98°F today · 15 d/yr by 30 yrs out
- Wind 2/10 Low
- Air quality 2/10 Low 1 unhealthy d/yr today · 2 by 30 yrs out
Nearby sold comps map
Loading sold comps map…
Walkable amenities ~0.75 mi
Loading nearby amenities…
Taxation est. · year 1
- Rental income
- $23,974
- − Mortgage interest
- −$11,198
- − Property taxes
- −$4,063
- − Insurance
- −$1,000
- − Repairs & maintenance
- −$1,918
- − Management
- −$1,918
- − Depreciation
- −$5,815
- Taxable loss
- −$1,936
- Est. tax savings @ 24.0%
- +$465
- After-tax cash flow
- $1,763/yr
For passive investors: Depreciation is non-cash, so a rental often shows a tax loss while cash-flowing — sheltering income. Rental losses are passive: they offset passive income freely, and up to $25,000/yr can offset ordinary (W-2) income if you actively participate and your MAGI is under $100k (phasing out to $0 by $150k); unused losses carry forward. On sale, claimed depreciation is recaptured at up to 25%, and gains may owe capital-gains tax (a 1031 exchange can defer both). Figures are a year-1 estimate at your 24.0% rate — not tax advice; consult a CPA.
Schools (NCES district)
- District
- Ypsilanti Community Schools
- NCES district ID
- 2636630
- Math proficiency
- 11% ▼ -8.00%
- Reading proficiency
- 20% ▼ -3.00%
- Median HH income
- $37,759
- Composite
- 12.98/100
- National rank
- #9572
- State rank
- #501 of 540 in MI
Livability — Ypsilanti
- Score
- 81/100
- State rank
- #71
- US rank
- #1539
Category grades
Schools grade is shown separately in the Schools card above.
Census & demographics
- County
- Washtenaw County · 306,860 people
- City population
- 105,769
- Metro
- Ann Arbor, MI
- Population (ZIP)
- 39,244
- Household income
- $63,326
- Rent vs Own
- Severe rent burden
- 1998.0
Population outlook (Washtenaw County) Hauer SSP2
- Today (2025)
- 402,878 people
- By 2030
- 424,104 · +5.3%
- By 2040
- 464,633 · +15.3%
- By 2050
- 504,728 · +25.3%
- By 2075
- 614,463 · +52.5%
- By 2100
- 676,181 · +67.8%
Race, ethnicity, and origin ACS 2023
- Neighborhood character
- Diverse neighborhood (Simpson 0.66)
- Race & ethnicity
- White 48% Black 32% Two or more races 11% Hispanic / Latino 8% Asian 2%
- Hispanic origin (detail)
- Mexican 4%
- Common ancestry
- Romanian 3% Italian 2% Slovak 2%
- Foreign-born
- 9% · Canada, China, South Korea
- Languages at home
- 88% English-only · Spanish 7% Other Indo-European 1% Arabic 1%
Political lean MEDSL · Washtenaw
- 2024 margin
- Solid D (+44.4) · D 71.0% · R 26.6% · Other 2.4%
- 2008→2024 swing
- +3.5pp toward D · 2008: 41.0pp · 2024: 44.4pp
- All cycles
- 2024: D+44.4 2020: D+46.6 2016: D+41.5 2012: D+36.0 2008: D+41.0
Not yet ingested
- Civics
- —
Market trends
- HPI YoY
- ▼ -224.96%
- Current HPI
- 204.1228
- Rent YoY
- ▲ 4.38%
- Metro
- Ann Arbor, MI
- State GDP YoY
- ▲ 1.37%
- F500 in state
- 28
Industry mix (Fortune 500 HQ in MI)
| Industry | F500 HQs | Revenue |
|---|---|---|
| Automotive Parts | 3 | $48B |
|
||
| Automotive | 2 | $372B |
|
||
| Chemicals | 1 | $45B |
|
||
| Automotive Retail | 1 | $29B |
|
||
| Healthcare / Medical Devices | 1 | $23B |
|
||
| Automotive Technology | 1 | $20B |
|
||
Price history
+64.9% since first listed5 events — show timeline
- 2026-05-19 Pending — REALCOMP
- 2026-05-19 Pending — MiRealSource-MiMLS
- 2026-05-10 Listed $199,900 REALCOMP
- 2026-05-10 Listed $199,900 MiRealSource-MiMLS
- 1996-09-04 Sold (Public Records) $121,225 Public Records
Property tax history
+3.5%/yrLatest (2025): $4,063 · +5.5% YoY. Source: county tax records.
Cash-flow waterfall
monthlySold comps — $/sqft
last 12 mo · ≤1 miLoading sold comps…