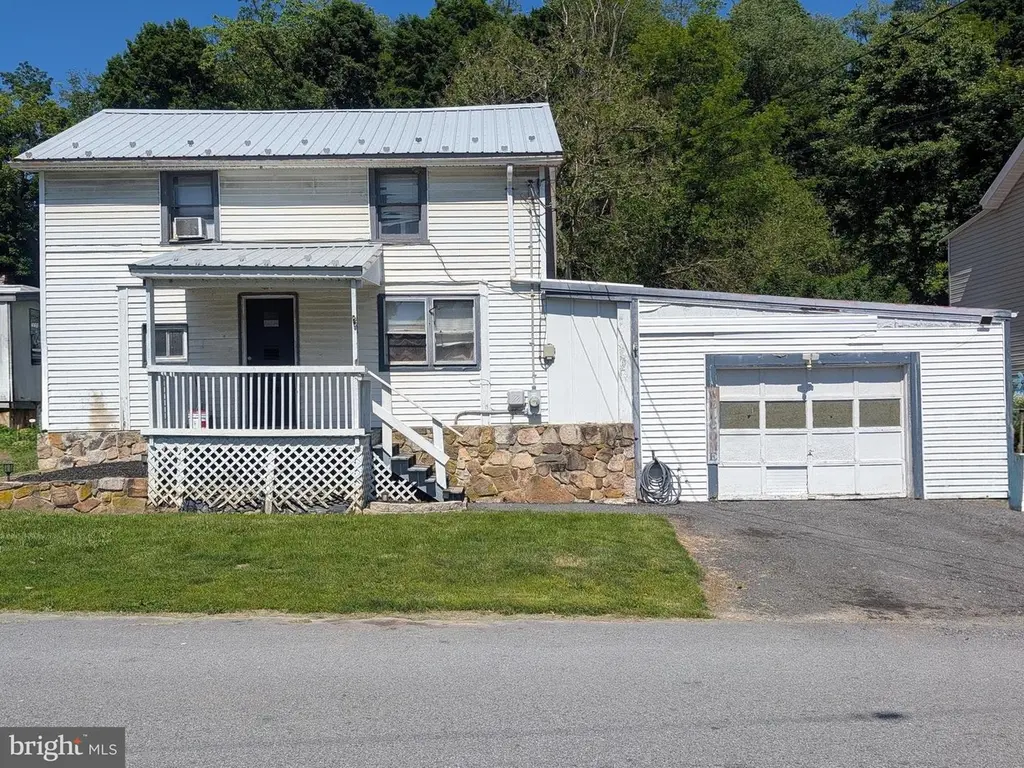
423 Hollars Ext · West Providence, PA
Flood risk 1/10 · Minimal
- FEMA flood zone
- X (unshaded)
- Chance of flooding over 30 yrs
- 0.0%
- Est. flood insurance / yr
- $473 – $860
Fire risk 3/10 · Minor
- Est. fire insurance / yr
- $511 – $949
Heat risk 4/10 · Minor
- Hot days now (above 95°F)
- 7 days/yr
- Hot days in 30 yrs
- 18 days/yr
Wind risk 2/10 · Minimal
- Chance of severe wind over 30 yrs
- —
Air-quality risk 1/10 · Minimal
- Unhealthy air days now
- 0 days/yr
- Unhealthy air days in 30 yrs
- 0 days/yr
Risk factors via First Street. Map © Google.
Why this score? — see what drove the A grade
The composite is a weighted blend of 9 inputs, each scored 0–100. Each bar is that input's sub-score; the figure is the points it added to the 100-point composite (weight × sub-score).
- Cash flow +30.0/30.0
- ARV discount +15.0/15.0
- DSCR +10.0/10.0
- Appreciation +10.0/10.0
- 1% rule +9.4/10.0
- Schools +3.5/10.0
- Rent growth +2.5/5.0
- Livability +2.5/5.0
- Condition / age +2.5/5.0
$99,000
🖨 Deal sheet 📄 Offer letter ✓ Due diligence
Listing remarks MLS
Opportunity awaits! This 3-bedroom, 1-bath home is situated on approximately . 172 acres and offers plenty of potential for the buyer with vision. Features include an attached garage, metal roof, covered front porch, and a spacious lot with room to enjoy the outdoors. The home needs repairs and updating but provides an excellent opportunity to build equity and make it your own. Whether you're looking for an investment property, renovation project, or affordable home with a yard, this property is worth a look.
Key facts
- Covered front porch
- Metal roof
- Attached garage
Tags
Property features AI
Exterior
- Parking: Driveway
- Utilities: Electric hot water; Public water service; Public sewer
- Home design: Detached property; Estimated year built
- Construction: Vinyl siding; Stone foundation; Metal roof
- Exterior features: Public water; Public sewer; No tidal water
Interior
- Kitchen: Stove; Refrigerator; Microwave
- Bedrooms: One bedroom on the main level; Two bedrooms on the first upper level
- Bathrooms: One full bathroom (located on the first upper level)
- Heating & cooling: Forced air heating (oil fuel)
- Interior features: Living room; Fireplace (1); Full basement
- Laundry & utility: Laundry room
Neighborhood map
What this means for you Summary
Snapshot
- This is a 3-bed/1.0-bath single-family listed at $99k.
Deal economics
- At list price, monthly cash flow is $446 ($5k/yr) — positive.
- The deal already cash-flows at list — no discount required.
- Meets the 1% rule at list price ($1k rent vs $99k).
Location & tenants
- Location reads: area grade A — affects rentability + tenant quality, not the cash-flow math above.
- Everett Area SD (rural): math 32% / reading 52% proficiency, ranked #337 of 539 in PA (top 62%) — families likely to look elsewhere, expect single-tenant / working-renter base with shorter leases.
- Market conditions: 61 active listings in the ZIP; 54 units permitted in Bedford County in 2024 (0 in 5+ unit buildings).
Forward outlook
- In year one you build about $11k of equity ($684 loan paydown + $10k appreciation (10.0% local appreciation)).
- Bedford County population projected at -25% by 2050 — secular population decline; favor cash flow + early exit over multi-decade hold.
- At projected returns (10.0% appreciation + 3.0% rent growth), your $28k cash investment doubles in ~2 years — after that, you're playing with house money.
- By year 4, paydown + projected appreciation supports a ~$38k cash-out refi (75% LTV) — recoverable capital for the next deal without selling this one.
Negotiation context
- Only 9 days on market — expect competitive offers; lowballing is unlikely to land.
- 6 sale attempts since 19y ago with the ask held roughly flat each time — persistent listings suggest the price (not the market) is what's stuck; bring a comps-based counter.
- Current owner paid $26k; list at $99k implies a 281% gain — meaningful room to come down on a strong offer.
Risks & watch-outs
- Watch-outs: built in 1920 — expect roof / HVAC / electrical / plumbing capex.
Questions for the listing agent
- Built in 1920 — when were the roof, HVAC, electrical panel, plumbing, and water heater last replaced?
- Is there a deadline driving the sale (1031 exchange, divorce, estate, relocation)? That informs how much negotiation room exists.
- What's the average days-on-market for RENTAL listings here right now (not sales)? A rising rental-DOM trend means longer vacancies and softer asking-rent achievability than the comps imply.
- What's the recent tenant-quality profile in this submarket — average credit score on applications, eviction rate, late-payment / NSF rate, and stable-employment percentage? A property-management company in the area should have these aggregated.
- How much new for-sale + rental construction is in the pipeline within 1–3 miles? Heavy new supply typically softens prices + rents 12–24 months out; constrained supply supports both.
Investment metrics
- 1% rule
- 1.44% ✓
- Cap rate
- 11.70%
- Cash-on-cash
- 19.30%
- DSCR
- 1.86
- GRM
- 5.8
CMA / ARV
- ARV (on-the-fly)
- $146,510
- Comps found
- 6
Show comp detail 6 sales within ~0.75 mi
| Address | Dist | Beds/Ba | Sqft | Sold | Price | $/sf | Match |
|---|---|---|---|---|---|---|---|
| 506 W Main St | 0.35mi | 3/1.5 | 1,206 (+7%) | 24mo | $155,000 | $129 | 50 |
| 70 W 6th Ave | 0.36mi | 3/1.5 | 1,228 (+9%) | 22mo | $205,000 | $167 | 48 |
| 122 W Fifth Ave | 0.29mi | 3/1.5 | 1,256 (+11%) | 22mo | $157,000 | $125 | 47 |
| 18 W South St | 0.51mi | 3/1.5 | 1,232 (+9%) | 19mo | $160,000 | $130 | 43 |
| 226 Locust Dr | 0.42mi | 3/2.0 | 1,288 (+14%) | 14mo | $259,000 | $201 | 40 |
| 421 Hill St | 0.27mi | 2/1.5 (-1) | 984 (-13%) | 24mo | $66,151 | $67 | 40 |
Match score weights: distance 35% · size 25% · config 20% · recency 20%. Top-matched comps best support the ARV.
Projected returns pro-forma
10.0% appreciation · 3.0% rent growth · sell at horizon
- IRR
- 38.7%
- Equity multiple
- 3.97×
- Total profit
- $82,332
- Equity at exit
- $89,187
- IRR
- 33.3%
- Equity multiple
- 8.94×
- Total profit
- $220,169
- Equity at exit
- $192,335
Cash invested: $27,720 (down + closing). Projections, not guarantees.
Landlord ↔ Tenant lean methodology
- Overall (STATE)
- 62 Landlord-Friendly
- State Pennsylvania
- 62 Landlord-Friendly · EVEN
- County
- — inherits STATE
- City
- — inherits STATE
ZIP-level market 15537
- Home prices YoY
- 17.3%
- Active inventory
- 61
- Price-to-rent
- 5.8×
Monthly cashflow live
- Estimated rent
- $1,430 medium interval (Pro) →
- Mortgage (P&I)
- −$519
- Tax est. 1.5%
- −$124 /mo · $1,485/yr
- Insurance
- −$41
- HOA
- −$0
- Vacancy / Maint / Mgmt
- −$300
- Net cashflow
- $446
Break-even live
UW: 25.0% down · 7.5% · 30yr · 1.5% tax · 5.0% vac · 8.0% maint · 8.0% mgmt
Financing live
Cash to close
- Down payment
- $24,750
- Closing costs
- $2,970
- Reserves months
- —
- Total cash needed
- —
Loan-product check · same deal, 3 products live
Conventional
25% down · 7.5% · 30yr
- Down + closing
- —
- Monthly P&I
- —
- Monthly cashflow
- —
- DSCR
- —
- Eligible?
- —
Personal DTI + credit; lowest rate.
DSCR
20% down · 8.5% · 30yr
- Down + closing
- —
- Monthly P&I
- —
- Monthly cashflow
- —
- DSCR
- —
- Eligible?
- —
No personal income docs; deal must DSCR.
Hard money
10% down · 12.0% · 12mo
- Down + closing
- —
- Monthly P&I
- —
- Monthly cashflow
- —
- DSCR
- —
- Eligible?
- —
Short-term bridge; refi at stabilization.
Listing history 7 events
-
2026-06-18days on market $99,000 Active 9 DOM
-
2026-06-17days on market $99,000 Active 8 DOM
-
2026-06-16days on market $99,000 Active 7 DOM
-
2026-06-15days on market $99,000 Active 6 DOM
-
2026-06-13days on market $99,000 Active 4 DOM
-
2026-06-12remarks 514-char remark
-
2026-06-12$99,000 Active 3 DOM
ⓘ Source: listings_history table (triggers on properties + properties_extension) + one-shot
backfill from property_details.listing_events for pre-trigger history.
Climate risk First Street
- Flood 1/10 Low FEMA zone X (unshaded) · 0% chance over 30 yrs
- Wildfire 3/10 Moderate
- Heat 4/10 Moderate 7 d/yr ≥95°F today · 18 d/yr by 30 yrs out
- Wind 2/10 Low
- Air quality 1/10 Low 0 unhealthy d/yr today · 0 by 30 yrs out
Nearby sold comps map
Loading sold comps map…
Walkable amenities ~0.75 mi
Loading nearby amenities…
Taxation est. · year 1
- Rental income
- $17,164
- − Mortgage interest
- −$5,546
- − Property taxes
- −$1,485
- − Insurance
- −$495
- − Repairs & maintenance
- −$1,373
- − Management
- −$1,373
- − Depreciation
- −$2,880
- Taxable income
- $4,012
- Est. tax owed @ 24.0%
- −$963
- After-tax cash flow
- $4,387/yr
For passive investors: Depreciation is non-cash, so a rental often shows a tax loss while cash-flowing — sheltering income. Rental losses are passive: they offset passive income freely, and up to $25,000/yr can offset ordinary (W-2) income if you actively participate and your MAGI is under $100k (phasing out to $0 by $150k); unused losses carry forward. On sale, claimed depreciation is recaptured at up to 25%, and gains may owe capital-gains tax (a 1031 exchange can defer both). Figures are a year-1 estimate at your 24.0% rate — not tax advice; consult a CPA.
Schools (NCES district)
- District
- Everett Area SD
- NCES district ID
- 4209360
- Math proficiency
- 32% ▼ -10.00%
- Reading proficiency
- 52% ▼ -9.00%
- Median HH income
- $41,322
- Composite
- 35.24/100
- National rank
- #4979
- State rank
- #337 of 539 in PA
Livability — West Providence
No livability data for this city. (Only ~50 U.S. cities are tracked.)
Census & demographics
- Census place
- Earlston, PA
- Population (ZIP)
- 8,272
Population outlook (Bedford County) Hauer SSP2
- Today (2025)
- 45,395 people
- By 2030
- 43,353 · -4.5%
- By 2040
- 38,858 · -14.4%
- By 2050
- 34,162 · -24.7%
- By 2075
- 24,868 · -45.2%
- By 2100
- 16,910 · -62.7%
Race, ethnicity, and origin ACS 2023
- Neighborhood character
- Predominantly White (95%)
- Race & ethnicity
- White 95% Two or more races 3% Hispanic / Latino 2%
- Common ancestry
- Lithuanian 6% Italian 2% Iranian 2%
- Foreign-born
- 2% · Canada
- Languages at home
- 98% English-only · Spanish 1%
Political lean MEDSL · Bedford
- 2024 margin
- Solid R (+68.6) · D 15.4% · R 84.0%
- 2008→2024 swing
- -23.8pp toward R · 2008: -44.8pp · 2024: -68.6pp
- All cycles
- 2024: R+68.6 2020: R+67.7 2016: R+67.4 2012: R+54.9 2008: R+44.8
Not yet ingested
- Civics
- —
Market trends
- HPI YoY
- ▲ 37.19%
- Current HPI
- 252.292
- Rent YoY
- —
- Metro
- —
- State GDP YoY
- ▲ 1.68%
- F500 in state
- 34
Industry mix (Fortune 500 HQ in PA)
| Industry | F500 HQs | Revenue |
|---|---|---|
| Healthcare | 2 | $309B |
|
||
| Insurance | 2 | $27B |
|
||
| Telecommunications / Media | 1 | $124B |
|
||
| Industrial Distribution | 1 | $22B |
|
||
| Financial Services | 1 | $20B |
|
||
| Chemicals / Materials | 1 | $18B |
|
||
Price history
+98.4% since first listed8 events — show timeline
- 2026-06-09 Listed $99,000 BRIGHT MLS
- 2026-06-09 Listed $99,000 AHARMLS
- 2017-01-18 Listed $68,900 AHARMLS
- 2012-10-27 Sold (MLS) $26,000 AHARMLS
- 2012-09-17 Listed $29,500 AHARMLS
- 2009-12-01 Listed $55,000 AHARMLS
- 2008-09-24 Sold (MLS) $47,000 AHARMLS
- 2007-09-20 Listed $49,900 AHARMLS
Cash-flow waterfall
monthlySold comps — $/sqft
last 12 mo · ≤1 miLoading sold comps…