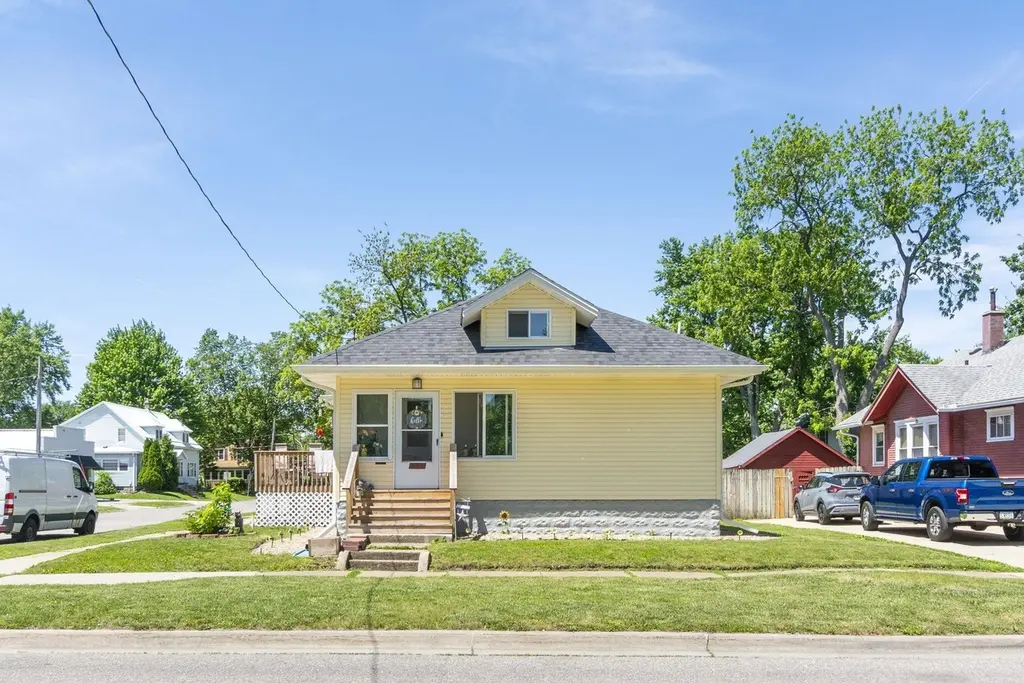
1324 W 6th St · Waterloo, IA
Flood risk 3/10 · Minor
- FEMA flood zone
- X (unshaded)
- Chance of flooding over 30 yrs
- 0.2%
- Est. flood insurance / yr
- $473 – $860
Fire risk 1/10 · Minimal
- Est. fire insurance / yr
- $902 – $1,676
Heat risk 3/10 · Minor
- Hot days now (above 101°F)
- 7 days/yr
- Hot days in 30 yrs
- 16 days/yr
Wind risk 2/10 · Minimal
- Chance of severe wind over 30 yrs
- —
Air-quality risk 1/10 · Minimal
- Unhealthy air days now
- 0 days/yr
- Unhealthy air days in 30 yrs
- 0 days/yr
Risk factors via First Street. Map © Google.
Why this score? — see what drove the F grade
The composite is a weighted blend of 9 inputs, each scored 0–100. Each bar is that input's sub-score; the figure is the points it added to the 100-point composite (weight × sub-score).
- ARV discount +7.5/15.0
- Schools +4.4/10.0
- Cash flow +4.1/30.0
- Livability +4.0/5.0
- Rent growth +3.2/5.0
- Condition / age +2.5/5.0
- 1% rule +0.0/10.0
- DSCR +0.0/10.0
- Appreciation +0.0/10.0
$224,900
🖨 Deal sheet (PDF) 📄 Offer letter ✓ Due diligence
Listing remarks MLS
Check out this 2 bed, 1 bath home in central Waterloo. Some updates have been made including flooring and paint. Has a 2 stall garage connected to the house with a breezeway. Ready to move in today! Contact your Realtor for a showing! Listing agent is part owner of the property.
Key facts
- New siding
- New water heater
- New electrical
Tags
Property features AI
Finance
- Other: Zoned R-2
Exterior
- Parking: Carport with space for 2 cars
- Utilities: Public water; Public sewer
- Home design: Single-family residence; Residential property
- Construction: Vinyl siding; Shingle roof; Below-grade finished area
- Exterior features: Deck; Porch; Concrete road surface
Interior
- Bathrooms: 1 full bathroom; 1 three-quarter bathroom
- Heating & cooling: Central air conditioning; Electric heating
- Interior features: No fireplace; Partially finished basement
Neighborhood map
What this means for you Summary
Snapshot
- This is a 3-bed/2.0-bath single-family listed at $225k.
Deal economics
- At list price, monthly cash flow is $-615 ($-7k/yr) — negative.
- To cash-flow at today's rent, offer at most $116k (48.3% below list).
- To meet the 1% rule (rent ≥ 1% of price), the offer needs to be $107k (52.5% below list).
- Recommended offer: $107k (52.5% below list) — sets the bar for 1% rule.
- Cap rate 3.0% vs local median 4.2% in Waterloo — below-typical yield; the buyer is paying a premium for something (appreciation thesis, condition, location) that the cap rate doesn't capture.
Location & tenants
- Location reads 81/100 on livability (#74 in IA, #1,589 nationally) — a professional / high-income tenant draw. Strengths: commute A+, cost of living A+, housing A+; Watch: crime F, employment D-.
- Waterloo Community School District (urban): math 50% / reading 54% proficiency, ranked #276 of 289 in IA (top 96%) — acceptable for families but not a draw, mixed tenant base, ~2y average lease.
- Zoned schools: Irving Elementary School (math 43% / reading 44%, grade F, #560 of 616 statewide, top 91%, 402 students, 92% FRL); Central Middle School (math 49% / reading 46%, grade C-, #226 of 246 statewide, top 92%, 471 students, 85% FRL); West High School (math 55% / reading 63%, grade C+, #273 of 336 statewide, top 81%, 1,652 students, 62% FRL) — zoned schools average 80% FRL vs 58% district-wide (22 pts higher); higher-poverty schools than district average — tighter screening recommended.
- Market conditions: Rents rising (+2.7%/yr); 126 active listings in the ZIP; 32 comparable units currently listed for rent nearby; rentals lingering (median 46d on market — plan ~5-8 weeks vacancy on turnover, expect pricing pressure); 53% of comp listings sitting > 30 days — soft ceiling on asking rent; 287 units permitted in Black Hawk County in 2024 (67 in 5+ unit buildings).
Forward outlook
- Local home prices are declining (-3.0%/yr); year-one equity from $2k of loan paydown is wiped out by about $7k of value loss. Plan a longer hold.
- Black Hawk County population projected at +10% by 2050 — modest demand growth; plan on rents tracking national, not racing it.
Negotiation context
- Only 9 days on market — expect competitive offers; lowballing is unlikely to land.
- 2 sale attempts since 4y ago with the ask held roughly flat each time — persistent listings suggest the price (not the market) is what's stuck; bring a comps-based counter.
- Current owner paid $90k; list at $225k implies a 150% gain — meaningful room to come down on a strong offer.
Risks & watch-outs
- Watch-outs: built in 1919 — expect roof / HVAC / electrical / plumbing capex.
Questions for the listing agent
- What do current leases actually rent for vs. the listed asking? Can we see a recent rent roll and the last 12 months of T-12 income?
- Built in 1919 — when were the roof, HVAC, electrical panel, plumbing, and water heater last replaced?
- Is there a deadline driving the sale (1031 exchange, divorce, estate, relocation)? That informs how much negotiation room exists.
- Crime grade is F in this area — have there been break-ins, vandalism, or insurance claims at this property in the last 3 years? What carrier currently insures it and at what premium?
- The area grade is low — what's the realistic commute time and amenity access for the typical tenant pool here? Any planned neighborhood developments (good or bad) we should know about?
- What's the average days-on-market for RENTAL listings here right now (not sales)? A rising rental-DOM trend means longer vacancies and softer asking-rent achievability than the comps imply.
- What's the recent tenant-quality profile in this submarket — average credit score on applications, eviction rate, late-payment / NSF rate, and stable-employment percentage? A property-management company in the area should have these aggregated.
- How much new for-sale + rental construction is in the pipeline within 1–3 miles? Heavy new supply typically softens prices + rents 12–24 months out; constrained supply supports both.
Investment metrics
- 1% rule
- 0.48% ✗
- Cap rate
- 3.01%
- Cash-on-cash
- -11.71%
- DSCR
- 0.48
- GRM
- 17.5
CMA / ARV
- ARV (on-the-fly)
- $133,950
- Comps found
- 12
Show comp detail 12 sales within ~0.75 mi
| Address | Dist | Beds/Ba | Sqft | Sold | Price | $/sf | Match |
|---|---|---|---|---|---|---|---|
| 1016 Hawthorne Ave | 0.27mi | 3/1.0 | 1,470 (+3%) | 1mo | $127,500 | $87 | 78 |
| 524 Vermont St | 0.30mi | 4/1.5 (+1) | 1,477 (+4%) | 0mo | $72,000 | $49 | 72 |
| 150 Hawthorne Ave | 0.41mi | 3/1.0 | 1,363 (-4%) | 3mo | $187,000 | $137 | 68 |
| 1141 E Mitchell Ave | 0.56mi | 3/1.0 | 1,460 (+2%) | 1mo | $184,000 | $126 | 65 |
| 610 Baltimore St | 0.22mi | 3/1.0 | 1,248 (-12%) | 2mo | $98,400 | $79 | 63 |
| 207 Denver St | 0.63mi | 2/1.5 (-1) | 1,420 (-0%) | 1mo | $92,500 | $65 | 62 |
| 1120 Bourland Ave | 0.61mi | 4/1.0 (+1) | 1,466 (+3%) | 1mo | $138,000 | $94 | 57 |
| 209 Kingsley Avenue Ave | 0.52mi | 3/1.0 | 1,294 (-9%) | 0mo | $90,000 | $70 | 56 |
| 1181 E Mitchell Ave | 0.61mi | 2/1.0 (-1) | 1,348 (-5%) | 1mo | $160,000 | $119 | 52 |
| 1116 W Mullan Ave | 0.75mi | 3/1.0 | 1,518 (+6%) | 2mo | $35,000 | $23 | 48 |
| 701 Lorraine Ave | 0.62mi | 3/1.5 | 1,224 (-14%) | 0mo | $152,500 | $125 | 45 |
| 108 Carolina Ave | 0.74mi | 2/1.0 (-1) | 1,226 (-14%) | 1mo | $150,000 | $122 | 32 |
Match score weights: distance 35% · size 25% · config 20% · recency 20%. Top-matched comps best support the ARV.
Projected returns pro-forma
-3.0% appreciation · 2.7% rent growth · sell at horizon
- IRR
- -38.1%
- Equity multiple
- -0.21×
- Total profit
- $-75,961
- Equity at exit
- $33,533
- IRR
- -59.3%
- Equity multiple
- -0.87×
- Total profit
- $-118,046
- Equity at exit
- $19,445
Cash invested: $62,972 (down + closing). Projections, not guarantees.
Landlord ↔ Tenant lean methodology
- Overall (STATE)
- 83 Strongly Landlord-Friendly
- State Iowa
- 83 Strongly Landlord-Friendly · R+6
- County
- — inherits STATE
- City
- — inherits STATE
ZIP-level market 50702
- Rents YoY
- 2.7%
- Active inventory
- 126
- Price-to-rent
- 17.5×
Monthly cashflow live
- Estimated rent
- $1,069 high interval (Pro) →
- Mortgage (P&I)
- −$1,179
- Tax from tax record
- −$186 /mo · $2,230/yr
- Insurance
- −$94
- HOA
- −$0
- Vacancy / Maint / Mgmt
- −$224
- Net cashflow
- $-615
Break-even live
Sensitivity live
| Price | -10% $-487 | -5% $-551 | +0% $-615 | +5% $-678 | +10% $-742 |
|---|---|---|---|---|---|
| Rent | -10% $-699 | -5% $-657 | +0% $-615 | +5% $-573 | +10% $-530 |
| Rate | -1.0pp $-501 | -0.5pp $-558 | base $-615 | +0.5pp $-673 | +1.0pp $-732 |
UW: 25.0% down · 7.5% · 30yr · 1.5% tax · 5.0% vac · 8.0% maint · 8.0% mgmt
Financing live
Cash to close
- Down payment
- $56,225
- Closing costs
- $6,747
- Reserves months
- —
- Total cash needed
- —
Loan-product check · same deal, 3 products live
Conventional
25% down · 7.5% · 30yr
- Down + closing
- —
- Monthly P&I
- —
- Monthly cashflow
- —
- DSCR
- —
- Eligible?
- —
Personal DTI + credit; lowest rate.
DSCR
20% down · 8.5% · 30yr
- Down + closing
- —
- Monthly P&I
- —
- Monthly cashflow
- —
- DSCR
- —
- Eligible?
- —
No personal income docs; deal must DSCR.
Hard money
10% down · 12.0% · 12mo
- Down + closing
- —
- Monthly P&I
- —
- Monthly cashflow
- —
- DSCR
- —
- Eligible?
- —
Short-term bridge; refi at stabilization.
Rent comps 32 comps
| Address | Beds | Baths | Sqft | Rent | $/sqft | DOM | Units | Dist |
|---|---|---|---|---|---|---|---|---|
| 905 Baltimore St Waterloo, IA | 3.0 | 1.5 | 1392 | $1,025 | $0.74 | 45d | 1 | 0.09mi |
| 702 Western Ave Waterloo, IA | 2.0 | 1.5 | 1500 | $1,100 | $0.73 | 23d | 1 | 0.21mi |
| 1524 1/2 W 5th St Unit 1524 1/2 Waterloo, IA | 2.0 | 1.0 | 981 | $850 | $0.87 | 23d | 1 | 0.30mi |
| 1112 Byron Ave Unit 1114 Waterloo, IA | 2.0 | 1.0 | 896 | $930 | $1.04 | 23d | 1 | 0.37mi |
| 313 Denver St Unit Downstairs Waterloo, IA | 2.0 | 1.5 | 950 | $695 | $0.73 | 23d | 1 | 0.49mi |
| 616 Kimball Ave Waterloo, IA | 3.0 | 1.0 | 1302 | $1,100 | $0.84 | 45d | 1 | 0.51mi |
| 719 Marsh St Waterloo, IA | 3.0 | 1.0 | 1224 | $1,100 | $0.90 | 23d | 1 | 0.54mi |
| 1427 W 2nd St Waterloo, IA | 3.0 | 1.0 | 1248 | $1,250 | $1.00 | 45d | 1 | 0.58mi |
| 820 W 2nd St Apt 2 Waterloo, IA | 2.0 | 1.5 | 1100 | $695 | $0.63 | 45d | 1 | 0.63mi |
| 418 Sunnyside Ave Waterloo, IA | 3.0 | 1.0 | 1200 | $675 | $0.56 | 45d | 1 | 0.73mi |
| 416 Sunnyside Ave Waterloo, IA | 3.0 | 1.0 | 1200 | $825 | $0.69 | 45d | 1 | 0.74mi |
| 1840 W 3rd St Waterloo, IA | 2.0 | 1.0 | 1770 | $700 | $0.40 | 46d | 1 | 0.74mi |
| 223 W 4th St Ste 203 Waterloo, IA | 2.0 | 1.5 | 1466 | $1,250 | $0.85 | 45d | 1 | 0.88mi |
| W Mullan Ave Waterloo, IA | 2.0 | 1.0 | 918 | $710 | $0.77 | 45d | 2 | 0.91mi |
| 154 Acadia St Unit 2 Waterloo, IA | 2.0 | 1.0 | 995 | $1,200 | $1.21 | 45d | 1 | 0.93mi |
| 105 Bellaire Rd Waterloo, IA | 2.0 | 2.0 | 1088 | $1,100 | $1.01 | 23d | 1 | 0.95mi |
| 1702 Hammond Ave Waterloo, IA | 3.0 | 2.0 | 1337 | $1,500 | $1.12 | 45d | 1 | 1.03mi |
| 45 W Jefferson St Waterloo, IA | 1.0–2.0 | 1.0–2.0 | 1062 | $1,750 | $1.65 | 23d | 9 | 1.06mi |
| 924 Sycamore St #1 Waterloo, IA | 2.0 | 2.0 | 1054 | $1,250 | $1.19 | 45d | 1 | 1.14mi |
| 824 Sycamore St Unit 824-09 Waterloo, IA | 2.0 | 2.0 | 1054 | $1,250 | $1.19 | 45d | 1 | 1.14mi |
| 920-928 Sycamore St Unit 920-07 Waterloo, IA | 2.0 | 2.0 | 1054 | $1,250 | $1.19 | 45d | 1 | 1.17mi |
| 1047 Langley Rd Waterloo, IA | 2.0 | 1.0 | 951 | $795 | $0.84 | 23d | 1 | 1.28mi |
| 910 Mulberry St Apt 3 Waterloo, IA | 2.0 | 1.0 | 1064 | $695 | $0.65 | 23d | 1 | 1.33mi |
| 2539 W 3rd St Waterloo, IA | 3.0 | 2.5 | 1200 | $1,695 | $1.41 | 23d | 1 | 1.33mi |
| 311 E 3rd St Waterloo, IA | 2.0 | 2.0 | 1154 | $1,500 | $1.30 | 23d | 1 | 1.36mi |
| 1211 Langley Rd Waterloo, IA | 2.0 | 1.0 | 951 | $825 | $0.87 | 23d | 1 | 1.36mi |
| 1107 Mulberry St Waterloo, IA | 3.0 | 1.0 | 1248 | $950 | $0.76 | 23d | 1 | 1.36mi |
| 136 Janney Ave Waterloo, IA | 2.0 | 2.0 | 901 | $1,325 | $1.47 | 45d | 1 | 1.36mi |
| 1225 Langley Rd Waterloo, IA | 2.0 | 1.0 | 989 | $795 | $0.80 | 23d | 1 | 1.37mi |
| 1127 Ravenwood Rd #12 Waterloo, IA | 2.0 | 1.0 | 990 | $800 | $0.81 | 45d | 1 | 1.40mi |
| 1229 Ravenwood Rd Unit 1237-1 Waterloo, IA | 2.0 | 1.0 | 960 | $900 | $0.94 | 45d | 1 | 1.42mi |
| 216 Courtland St Apt 1 Waterloo, IA | 4.0 | 1.0 | 1150 | $825 | $0.72 | 23d | 1 | 1.50mi |
Listing history 9 events
-
2026-05-31status $224,900 Pending 9 DOM
-
2026-05-30days on market $224,900 Active 9 DOM
-
2026-05-21$224,900 Active
-
2023-02-09soldstatus $90,000
-
2023-02-03soldstatus $90,000 Closed 279-char remark
Show marketing remark (279 chars)
Check out this 2 bed, 1 bath home in central Waterloo. Some updates have been made including flooring and paint. Has a 2 stall garage connected to the house with a breezeway. Ready to move in today! Contact your Realtor for a showing! Listing agent is part owner of the property.
-
2023-01-20status Pending 279-char remark
Show marketing remark (279 chars)
Check out this 2 bed, 1 bath home in central Waterloo. Some updates have been made including flooring and paint. Has a 2 stall garage connected to the house with a breezeway. Ready to move in today! Contact your Realtor for a showing! Listing agent is part owner of the property.
-
2022-12-14price $109,000 279-char remark
Show marketing remark (279 chars)
Check out this 2 bed, 1 bath home in central Waterloo. Some updates have been made including flooring and paint. Has a 2 stall garage connected to the house with a breezeway. Ready to move in today! Contact your Realtor for a showing! Listing agent is part owner of the property.
-
2022-12-02$120,000 Active 279-char remark
Show marketing remark (279 chars)
Check out this 2 bed, 1 bath home in central Waterloo. Some updates have been made including flooring and paint. Has a 2 stall garage connected to the house with a breezeway. Ready to move in today! Contact your Realtor for a showing! Listing agent is part owner of the property.
-
2019-05-20soldstatus $62,500
ⓘ Source: listings_history table (triggers on properties + properties_extension) + one-shot
backfill from property_details.listing_events for pre-trigger history.
Tax reassessment forecast IA · Partial reset (capped growth)
- Current annual tax
- $2,230 · $186/mo
- Projected year-2 tax
- $2,880 · $240/mo
- Expected delta
- +$650/yr (+$54/mo · 29.2%)
ⓘ Screening estimate from a state-policy table — verify with the county assessor before closing.
Climate risk First Street
- Flood 3/10 Moderate FEMA zone X (unshaded) · 20% chance over 30 yrs
- Wildfire 1/10 Low
- Heat 3/10 Moderate 7 d/yr ≥101°F today · 16 d/yr by 30 yrs out
- Wind 2/10 Low
- Air quality 1/10 Low 0 unhealthy d/yr today · 0 by 30 yrs out
Nearby sold comps map
Loading sold comps map…
Walkable amenities ~0.75 mi
Loading nearby amenities…
Taxation est. · year 1
- Rental income
- $12,823
- − Mortgage interest
- −$12,598
- − Property taxes
- −$2,230
- − Insurance
- −$1,124
- − Repairs & maintenance
- −$1,026
- − Management
- −$1,026
- − Depreciation
- −$6,543
- Taxable loss
- −$11,723
- Est. tax savings @ 24.0%
- +$2,814
- After-tax cash flow
- $-4,563/yr
For passive investors: Depreciation is non-cash, so a rental often shows a tax loss while cash-flowing — sheltering income. Rental losses are passive: they offset passive income freely, and up to $25,000/yr can offset ordinary (W-2) income if you actively participate and your MAGI is under $100k (phasing out to $0 by $150k); unused losses carry forward. On sale, claimed depreciation is recaptured at up to 25%, and gains may owe capital-gains tax (a 1031 exchange can defer both). Figures are a year-1 estimate at your 24.0% rate — not tax advice; consult a CPA.
Schools (NCES district)
- District
- Waterloo Community School District
- NCES district ID
- 1930480
- Math proficiency
- 50% ▼ -4.00%
- Reading proficiency
- 54% ▲ 1.00%
- Median HH income
- $42,545
- Composite
- 43.72/100
- National rank
- #2950
- State rank
- #276 of 289 in IA
Livability — Waterloo
- Score
- 81/100
- State rank
- #74
- US rank
- #1589
Category grades
Schools grade is shown separately in the Schools card above.
Census & demographics
- Census place
- Waterloo, IA
- County
- Black Hawk County · 112,933 people
- City population
- 69,066
- Metro
- Waterloo-Cedar Falls, IA
- Population (ZIP)
- 20,882
- Household income
- $62,021
- Rent vs Own
- Severe rent burden
- 479.0
Population outlook (Black Hawk County) Hauer SSP2
- Today (2025)
- 139,716 people
- By 2030
- 142,853 · +2.2%
- By 2040
- 147,843 · +5.8%
- By 2050
- 153,247 · +9.7%
- By 2075
- 167,977 · +20.2%
- By 2100
- 177,320 · +26.9%
Race, ethnicity, and origin ACS 2023
- Neighborhood character
- Predominantly White (68%)
- Race & ethnicity
- White 68% Black 14% Hispanic / Latino 9% Two or more races 5% Asian 3% Pacific Islander 3% Native American 1%
- Hispanic origin (detail)
- Mexican 6% Puerto Rican 1%
- Common ancestry
- American 5% Portuguese 3% Lithuanian 2%
- Foreign-born
- 15% · Canada, Philippines
- Languages at home
- 79% English-only · Spanish 7% Russian/Polish/Slavic 6% Other Asian/Pacific 4%
Political lean MEDSL · Black Hawk
- 2024 margin
- Toss-up / Even · D 50.0% · R 48.8% · Other 1.2%
- 2008→2024 swing
- -21.3pp toward R · 2008: 22.4pp · 2024: 1.2pp
- All cycles
- 2024: D+1.2 2020: D+9.0 2016: D+7.3 2012: D+20.0 2008: D+22.4
Not yet ingested
- Civics
- —
Market trends
- HPI YoY
- ▼ -110.86%
- Current HPI
- 155.4447
- Rent YoY
- ▲ 2.70%
- Metro
- Waterloo-Cedar Falls, IA
- State GDP YoY
- ▲ 2.48%
- F500 in state
- 4
Industry mix (Fortune 500 HQ in IA)
| Industry | F500 HQs | Revenue |
|---|---|---|
| Financial Services | 1 | $16B |
|
||
| Retail / Convenience | 1 | $15B |
|
||
Price history
+259.8% since first listed8 events — show timeline
- 2026-05-31 Pending — NEIRBR as distributed by MLS GRID
- 2026-05-21 Listed $224,900 NEIRBR as distributed by MLS GRID
- 2023-02-09 Sold (Public Records) $90,000 Public Records
- 2023-02-03 Sold (MLS) $90,000 NEIRBR as distributed by MLS GRID
- 2023-01-20 Pending — NEIRBR as distributed by MLS GRID
- 2022-12-14 Price Changed $109,000 NEIRBR as distributed by MLS GRID
- 2022-12-02 Listed $120,000 NEIRBR as distributed by MLS GRID
- 2019-05-20 Sold (Public Records) $62,500 Public Records
Property tax history
+1.5%/yrLatest (2025): $2,230 · +6.7% YoY. Source: county tax records.
Cash-flow waterfall
monthlySold comps — $/sqft
last 12 mo · ≤1 miLoading sold comps…