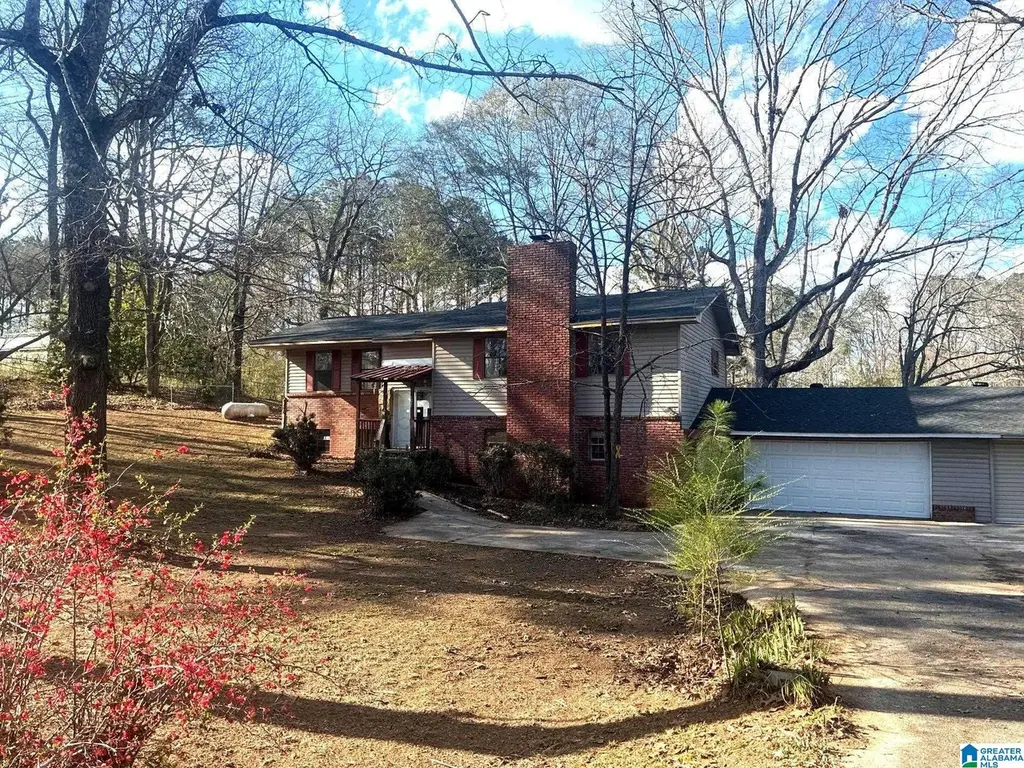
1006 Shady Ln · Jasper, AL
Flood risk 8/10 · Major
- FEMA flood zone
- X (unshaded)
- Chance of flooding over 30 yrs
- 0.99%
- Est. flood insurance / yr
- $473 – $860
Fire risk 3/10 · Minor
- Est. fire insurance / yr
- $916 – $1,700
Heat risk 5/10 · Moderate
- Hot days now (above 106°F)
- 7 days/yr
- Hot days in 30 yrs
- 19 days/yr
Wind risk 6/10 · Moderate
- Chance of severe wind over 30 yrs
- 27.0%
Air-quality risk 3/10 · Minor
- Unhealthy air days now
- 3 days/yr
- Unhealthy air days in 30 yrs
- 3 days/yr
Risk factors via First Street. Map © Google.
Why this score? — see what drove the B- grade
The composite is a weighted blend of 9 inputs, each scored 0–100. Each bar is that input's sub-score; the figure is the points it added to the 100-point composite (weight × sub-score).
- Cash flow +30.0/30.0
- 1% rule +10.0/10.0
- DSCR +10.0/10.0
- ARV discount +7.5/15.0
- Schools +3.4/10.0
- Livability +3.1/5.0
- Rent growth +2.5/5.0
- Condition / age +2.5/5.0
- Appreciation +0.0/10.0
$108,800
🖨 Deal sheet 📄 Offer letter ✓ Due diligence
Listing remarks MLS
Great opportunity to own a home with solid potential! This property offers a spacious layout and is ready for your personal touches. Amazing view of pond in back yard. The property is owned by the US Dept. Of HUD. Case Number 011-949523 It is listed as IE (Insured Escrow) subject to Appraisal. Seller makes no representation or warranties as to property condition. HUD homes are ''as is''.
Key facts
- View of pond
- 1.5 acre lot
- 3 garage spots
Tags
Neighborhood map
What this means for you Summary
Snapshot
- This is a 3-bed/1.0-bath single-family listed at $109k.
Deal economics
- At list price, monthly cash flow is $865 ($10k/yr) — positive.
- The deal already cash-flows at list — no discount required.
- Meets the 1% rule at list price ($2k rent vs $109k).
- Recommended offer: $102k (6.0% below list) — sets the bar for market timing.
- Cap rate 16.4% vs local median 3.8% in Jasper — top-decile yield for the area; either an underpriced asset or a hidden risk that comps aren't pricing in. Stress-test before assuming the spread holds.
Location & tenants
- Location reads 62/100 on livability (#228 in AL) — a middle-class / working-renter tenant base. Strengths: cost of living A+, housing A+; Watch: employment D+, schools D, crime F.
- Jasper City (town): math 27% / reading 55% proficiency, ranked #23 of 129 in AL (top 18%) — families likely to look elsewhere, expect single-tenant / working-renter base with shorter leases.
- Market conditions: 109 active listings in the ZIP; 36 units permitted in Walker County in 2024 (0 in 5+ unit buildings).
Forward outlook
- Local home prices are declining (-3.0%/yr); year-one equity from $752 of loan paydown is wiped out by about $3k of value loss. Plan a longer hold.
- Walker County population projected at -21% by 2050 — secular population decline; favor cash flow + early exit over multi-decade hold.
- At projected returns (-3.0% appreciation + 3.0% rent growth), your $30k cash investment doubles in ~4 years — after that, you're playing with house money.
Negotiation context
- It's been on market 76 days — a 6% lower offer ($102k) is reasonable based on typical stale-listing flexibility.
Risks & watch-outs
- Watch-outs: flood insurance adds $56/mo.
- Climate carrying-cost: severe flood risk; major wind risk, 27% chance of damaging wind over 30y; extreme-heat days projected 7→19/yr by 2055 (HVAC capex compounding) — expect insurance premiums to compound above CPI over the hold.
Questions for the listing agent
- It's been on market 76 days. Have you received any prior offers? Is the seller open to a 6% concession, seller financing, or rate buy-down credit?
- Built in 1978 — when were the roof, HVAC, electrical panel, plumbing, and water heater last replaced?
- What's the actual annual flood-insurance premium (NFIP or private), and is the property in a SFHA with mandatory coverage?
- Why hasn't it sold? Are there any deal-killer items the seller is aware of (foundation, flood, title, zoning, code violations)?
- Is there a deadline driving the sale (1031 exchange, divorce, estate, relocation)? That informs how much negotiation room exists.
- Schools are D-rated, which usually means shorter tenancies and higher turnover. Who's the typical renter profile here, and what's been the actual vacancy rate?
- Crime grade is F in this area — have there been break-ins, vandalism, or insurance claims at this property in the last 3 years? What carrier currently insures it and at what premium?
- What's the average days-on-market for RENTAL listings here right now (not sales)? A rising rental-DOM trend means longer vacancies and softer asking-rent achievability than the comps imply.
- What's the recent tenant-quality profile in this submarket — average credit score on applications, eviction rate, late-payment / NSF rate, and stable-employment percentage? A property-management company in the area should have these aggregated.
- How much new for-sale + rental construction is in the pipeline within 1–3 miles? Heavy new supply typically softens prices + rents 12–24 months out; constrained supply supports both.
Investment metrics
- 1% rule
- 1.95% ✓
- Cap rate
- 16.45%
- Cash-on-cash
- 36.27%
- DSCR
- 2.61
- GRM
- 4.3
CMA / ARV
- ARV (median comp)
- $224,158
- List price
- $108,800
- Delta
- -45.35%
- Verdict
- UNDERPRICED
- Comps
- 20 within 1.0 mi
Show comp detail 10 sales within ~0.75 mi
| Address | Dist | Beds/Ba | Sqft | Sold | Price | $/sf | Match |
|---|---|---|---|---|---|---|---|
| 1003 Shady Ln | 0.05mi | 3/3.0 | 2,405 (+4%) | 24mo | $255,000 | $106 | 63 |
| 1108 Shady Ln | 0.15mi | 3/3.0 | 2,025 (-12%) | 10mo | $292,000 | $144 | 56 |
| 2801 Pecan Pl | 0.66mi | 3/3.0 | 2,385 (+3%) | 4mo | $360,000 | $151 | 53 |
| 1401 Rutledge Ln | 0.66mi | 3/2.0 | 2,474 (+7%) | 4mo | $200,000 | $81 | 50 |
| 511 Curry Hwy | 0.67mi | 3/2.0 | 2,277 (-2%) | 15mo | $220,000 | $97 | 50 |
| 1010 Quail Hollow Rd | 0.22mi | 4/3.0 (+1) | 2,620 (+13%) | 6mo | $260,000 | $99 | 49 |
| 1010 Quail Rd | 0.26mi | 4/3.0 (+1) | 2,620 (+13%) | 6mo | $260,000 | $99 | 47 |
| 2685 Rolling Dr | 0.66mi | 3/2.0 | 2,054 (-11%) | 5mo | $305,000 | $148 | 43 |
| 1301 Brakefield Dairy Rd | 0.29mi | 3/2.5 | 2,024 (-12%) | 24mo | $250,000 | $124 | 40 |
| 300 W Ridgewood Rd | 0.64mi | 4/3.0 (+1) | 2,412 (+4%) | 17mo | $224,100 | $93 | 36 |
Match score weights: distance 35% · size 25% · config 20% · recency 20%. Top-matched comps best support the ARV.
Projected returns pro-forma
-3.0% appreciation · 3.0% rent growth · sell at horizon
- IRR
- 29.5%
- Equity multiple
- 2.23×
- Total profit
- $37,544
- Equity at exit
- $16,222
- IRR
- 36.8%
- Equity multiple
- 4.41×
- Total profit
- $103,922
- Equity at exit
- $9,407
Cash invested: $30,464 (down + closing). Projections, not guarantees.
Landlord ↔ Tenant lean methodology
- Overall (STATE)
- 90 Strongly Landlord-Friendly
- State Alabama
- 90 Strongly Landlord-Friendly · R+15
- County
- — inherits STATE
- City
- — inherits STATE
ZIP-level market 35503
- Home prices YoY
- -26.8%
- Active inventory
- 109
- Price-to-rent
- 4.3×
Monthly cashflow live
- Estimated rent
- $2,117 medium interval (Pro) →
- Mortgage (P&I)
- −$571
- Tax est. 1.5%
- −$136 /mo · $1,632/yr
- Insurance
- −$45
- Flood insurance flood zone
- −$56 /mo · $666/yr
- HOA
- −$0
- Vacancy / Maint / Mgmt
- −$445
- Net cashflow
- $865
Break-even live
UW: 25.0% down · 7.5% · 30yr · 1.5% tax · 5.0% vac · 8.0% maint · 8.0% mgmt
Financing live
Cash to close
- Down payment
- $27,200
- Closing costs
- $3,264
- Reserves months
- —
- Total cash needed
- —
Loan-product check · same deal, 3 products live
Conventional
25% down · 7.5% · 30yr
- Down + closing
- —
- Monthly P&I
- —
- Monthly cashflow
- —
- DSCR
- —
- Eligible?
- —
Personal DTI + credit; lowest rate.
DSCR
20% down · 8.5% · 30yr
- Down + closing
- —
- Monthly P&I
- —
- Monthly cashflow
- —
- DSCR
- —
- Eligible?
- —
No personal income docs; deal must DSCR.
Hard money
10% down · 12.0% · 12mo
- Down + closing
- —
- Monthly P&I
- —
- Monthly cashflow
- —
- DSCR
- —
- Eligible?
- —
Short-term bridge; refi at stabilization.
Listing history 17 events
-
2026-06-19pricedays on market $108,800 Active 76 DOM
-
2026-06-18days on market $122,500 Active 75 DOM
-
2026-06-17days on market $122,500 Active 74 DOM
-
2026-06-16days on market $122,500 Active 73 DOM
-
2026-06-15days on market $122,500 Active 72 DOM
-
2026-06-14days on market $122,500 Active 70 DOM
-
2026-06-12days on market $122,500 Active 69 DOM
-
2026-06-09days on market $122,500 Active 66 DOM
-
2026-06-08days on market $122,500 Active 65 DOM
-
2026-06-07days on market $122,500 Active 64 DOM
-
2026-06-07days on market $122,500 Active 63 DOM
-
2026-06-04days on market $122,500 Active 60 DOM
-
2026-06-02days on market $122,500 Active 59 DOM
-
2026-06-01days on market $122,500 Active 58 DOM
-
2026-05-31days on market $122,500 Active 57 DOM
-
2026-05-31days on market $122,500 Active 56 DOM
-
2026-04-02$136,000 Active 390-char remark
Show marketing remark (390 chars)
Great opportunity to own a home with solid potential! This property offers a spacious layout and is ready for your personal touches. Amazing view of pond in back yard. The property is owned by the US Dept. Of HUD. Case Number 011-949523 It is listed as IE (Insured Escrow) subject to Appraisal. Seller makes no representation or warranties as to property condition. HUD homes are ''as is''.
ⓘ Source: listings_history table (triggers on properties + properties_extension) + one-shot
backfill from property_details.listing_events for pre-trigger history.
Climate risk First Street
- Flood 8/10 Severe FEMA zone X (unshaded) · 99% chance over 30 yrs
- Wildfire 3/10 Moderate
- Heat 5/10 Major 7 d/yr ≥106°F today · 19 d/yr by 30 yrs out
- Wind 6/10 Major 27% chance of damaging wind over 30 yrs
- Air quality 3/10 Moderate 3 unhealthy d/yr today · 3 by 30 yrs out
Nearby sold comps map
Loading sold comps map…
Walkable amenities ~0.75 mi
Loading nearby amenities…
Taxation est. · year 1
- Rental income
- $25,408
- − Mortgage interest
- −$6,094
- − Property taxes
- −$1,632
- − Insurance
- −$1,210
- − Repairs & maintenance
- −$2,033
- − Management
- −$2,033
- − Depreciation
- −$3,165
- Taxable income
- $9,241
- Est. tax owed @ 24.0%
- −$2,218
- After-tax cash flow
- $8,165/yr
For passive investors: Depreciation is non-cash, so a rental often shows a tax loss while cash-flowing — sheltering income. Rental losses are passive: they offset passive income freely, and up to $25,000/yr can offset ordinary (W-2) income if you actively participate and your MAGI is under $100k (phasing out to $0 by $150k); unused losses carry forward. On sale, claimed depreciation is recaptured at up to 25%, and gains may owe capital-gains tax (a 1031 exchange can defer both). Figures are a year-1 estimate at your 24.0% rate — not tax advice; consult a CPA.
Schools (NCES district)
- District
- Jasper City
- NCES district ID
- 0101890
- Math proficiency
- 27% ▼ -23.00%
- Reading proficiency
- 55% ▲ 3.00%
- Median HH income
- $41,476
- Composite
- 34.4/100
- National rank
- #5204
- State rank
- #23 of 129 in AL
Livability — Jasper
- Score
- 62/100
- State rank
- #228
- US rank
- #17152
Category grades
Schools grade is shown separately in the Schools card above.
Census & demographics
- Census place
- Jasper, AL
- City population
- 9,927
- Population (ZIP)
- 9,601
Population outlook (Walker County) Hauer SSP2
- Today (2025)
- 61,037 people
- By 2030
- 58,391 · -4.3%
- By 2040
- 53,080 · -13.0%
- By 2050
- 48,031 · -21.3%
- By 2075
- 37,799 · -38.1%
- By 2100
- 29,001 · -52.5%
Race, ethnicity, and origin ACS 2023
- Neighborhood character
- Predominantly White (94%)
- Race & ethnicity
- White 94% Two or more races 2% Black 1% Hispanic / Latino 1%
- Common ancestry
- Slovak 2% Iranian 1% Scotch-Irish 1%
- Foreign-born
- 0%
- Languages at home
- 99% English-only · Spanish 1%
Political lean MEDSL · Walker
- 2024 margin
- Solid R (+71.8) · D 13.8% · R 85.6%
- 2008→2024 swing
- -25.4pp toward R · 2008: -46.4pp · 2024: -71.8pp
- All cycles
- 2024: R+71.8 2020: R+67.9 2016: R+67.4 2012: R+52.9 2008: R+46.4
Not yet ingested
- Civics
- —
Market trends
- HPI YoY
- ▼ -63.26%
- Current HPI
- 172.9286
- Rent YoY
- —
- Metro
- —
- State GDP YoY
- ▲ 2.94%
- F500 in state
- 4
Industry mix (Fortune 500 HQ in AL)
| Industry | F500 HQs | Revenue |
|---|---|---|
| Financial Services | 1 | $8B |
|
||
| Healthcare | 1 | $5B |
|
||
Price history
1 event — show timeline
- 2026-04-02 Listed $136,000 Greater Alabama MLS
Cash-flow waterfall
monthlySold comps — $/sqft
last 12 mo · ≤1 miLoading sold comps…