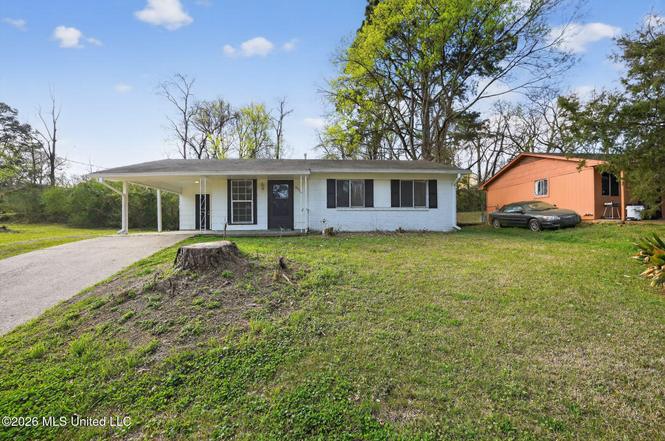
5770 Queen Mary Ln · Jackson, MS
Flood risk 1/10 · Minimal
- FEMA flood zone
- X (unshaded)
- Chance of flooding over 30 yrs
- 0.0%
- Est. flood insurance / yr
- $507 – $1,088
Fire risk 1/10 · Minimal
- Est. fire insurance / yr
- $1,241 – $2,305
Heat risk 7/10 · Major
- Hot days now (above 109°F)
- 7 days/yr
- Hot days in 30 yrs
- 20 days/yr
Wind risk 8/10 · Major
- Chance of severe wind over 30 yrs
- 80.0%
Air-quality risk 1/10 · Minimal
- Unhealthy air days now
- 0 days/yr
- Unhealthy air days in 30 yrs
- 0 days/yr
Risk factors via First Street. Map © Google.
Why this score? — see what drove the B grade
The composite is a weighted blend of 9 inputs, each scored 0–100. Each bar is that input's sub-score; the figure is the points it added to the 100-point composite (weight × sub-score).
- Cash flow +30.0/30.0
- 1% rule +10.0/10.0
- DSCR +10.0/10.0
- Appreciation +10.0/10.0
- ARV discount +3.4/15.0
- Livability +3.4/5.0
- Rent growth +2.5/5.0
- Condition / age +2.5/5.0
- Schools +1.1/10.0
$74,900
🖨 Deal sheet (PDF) 📄 Offer letter ✓ Due diligence
Listing remarks
Welcome to 5770 Queen Mary Ln in Jackson! This charming ranch-style single-family home offers inviting curb appeal and the convenience of a 1-car carport along with a covered front entry. Inside, the home features neutral colors and abundant natural light, creating a bright and welcoming atmosphere. Laminate flooring adds both style and durability throughout the main living areas. The home includes a comfortable living room and a formal dining area, providing great spaces for both everyday living and entertaining. The kitchen is equipped with a refrigerator, range, and a double sink, offering plenty of functionality for meal preparation. The home features three bedrooms and one and a half b
Key facts
- Laminate flooring
- Double sink
- Two bonus rooms
Tags
Neighborhood map
What this means for you Summary
Snapshot
- This is a 3-bed/1.5-bath single-family listed at $75k.
Deal economics
- At list price, monthly cash flow is $518 ($6k/yr) — positive.
- The deal already cash-flows at list — no discount required.
- Meets the 1% rule at list price ($1k rent vs $75k).
- Recommended offer: $74k (1.5% below list) — sets the bar for market timing.
- Cap rate 14.6% vs local median 9.9% in Jackson — top-decile yield for the area; either an underpriced asset or a hidden risk that comps aren't pricing in. Stress-test before assuming the spread holds.
Location & tenants
- Location reads 68/100 on livability (#66 in MS) — a middle-class / working-renter tenant base. Strengths: commute A+, cost of living A+, housing A+; Watch: amenities F, employment F, health & safety F.
- Jackson Public School District (urban): math 9% / reading 18% proficiency, ranked #112 of 130 in MS (top 86%) — low school quality limits family demand, transient renter base, plan for 1-2y turnover; 88% free/reduced lunch — lower-income household profile, screen leases tightly.
- Zoned schools: John Hopkins Elementary School (math 2% / reading 12%, grade F, #337 of 375 statewide, top 94%, 280 students, 100% FRL); Northwest Middle School (math 31% / reading 52%, grade F, #53 of 179 statewide, top 30%, 206 students, 100% FRL); Provine High School (math 4% / reading 15%, grade F, #179 of 197 statewide, top 92%, 774 students, 100% FRL).
- Market conditions: 165 active listings in the ZIP; 2 comparable units currently listed for rent nearby; lower-income renter base — watch delinquency; 167 units permitted in Hinds County in 2024 (0 in 5+ unit buildings).
- This rent runs 43% of the median local income ($36k/yr) — at the standard rent-burdened threshold; future hikes will face affordability resistance.
Forward outlook
- In year one you build about $8k of equity ($518 loan paydown + $7k appreciation (10.0% local appreciation)).
- Hinds County population projected to shrink 6% by 2050 — rents likely to lag national; underwrite the cash flow, not the appreciation.
- At projected returns (10.0% appreciation + 3.0% rent growth), your $21k cash investment doubles in ~2 years — after that, you're playing with house money.
- By year 5, paydown + projected appreciation supports a ~$37k cash-out refi (75% LTV) — recoverable capital for the next deal without selling this one.
Negotiation context
- It's been on market 19 days — a 2% lower offer ($74k) is reasonable based on typical stale-listing flexibility.
- 4 sale attempts since 27y ago with the ask held roughly flat each time — persistent listings suggest the price (not the market) is what's stuck; bring a comps-based counter.
Risks & watch-outs
- Climate carrying-cost: severe wind risk, 80% chance of damaging wind over 30y; extreme-heat days projected 7→20/yr by 2055 (HVAC capex compounding) — expect insurance premiums to compound above CPI over the hold.
Questions for the listing agent
- Built in 1972 — when were the roof, HVAC, electrical panel, plumbing, and water heater last replaced?
- Is there a deadline driving the sale (1031 exchange, divorce, estate, relocation)? That informs how much negotiation room exists.
- Schools are F-rated, which usually means shorter tenancies and higher turnover. Who's the typical renter profile here, and what's been the actual vacancy rate?
- What's the average days-on-market for RENTAL listings here right now (not sales)? A rising rental-DOM trend means longer vacancies and softer asking-rent achievability than the comps imply.
- What's the recent tenant-quality profile in this submarket — average credit score on applications, eviction rate, late-payment / NSF rate, and stable-employment percentage? A property-management company in the area should have these aggregated.
- How much new for-sale + rental construction is in the pipeline within 1–3 miles? Heavy new supply typically softens prices + rents 12–24 months out; constrained supply supports both.
Investment metrics
- 1% rule
- 1.75% ✓
- Cap rate
- 14.60%
- Cash-on-cash
- 29.65%
- DSCR
- 2.32
- GRM
- 4.8
CMA / ARV
- ARV (on-the-fly)
- $68,672
- Comps found
- 12
Show comp detail 12 sales within ~0.75 mi
| Address | Dist | Beds/Ba | Sqft | Sold | Price | $/sf | Match |
|---|---|---|---|---|---|---|---|
| 5770 Queen Mary Ln | 0.00mi | 3/1.5 | 1,184 (0%) | 1mo | $74,900 | $63 | 100 |
| 667 Queen Cir | 0.32mi | 3/1.5 | 1,170 (-1%) | 1mo | $124,900 | $107 | 82 |
| 506 Lowder Dr | 0.13mi | 3/1.5 | 1,318 (+11%) | 4mo | $62,500 | $47 | 72 |
| 344 Queen Margaret Ln | 0.22mi | 3/2.0 | 1,300 (+10%) | 1mo | $74,900 | $58 | 71 |
| 5629 Queen Mary Ln | 0.17mi | 4/2.0 (+1) | 1,272 (+7%) | 6mo | $90,000 | $71 | 68 |
| 663 Queen Julianna Ln | 0.28mi | 3/1.5 | 1,042 (-12%) | 2mo | $42,000 | $40 | 65 |
| 664 Queen Julianna Ln | 0.28mi | 4/1.5 (+1) | 1,300 (+10%) | 2mo | $65,000 | $50 | 64 |
| 346 Queen Theresa Ln | 0.29mi | 3/1.0 | 1,056 (-11%) | 4mo | $64,600 | $61 | 63 |
| 331 Queen Margaret Ln | 0.26mi | 3/1.5 | 1,027 (-13%) | 7mo | $59,900 | $58 | 60 |
| 135 Queen Anne Ln | 0.56mi | 3/2.0 | 1,248 (+5%) | 5mo | $64,900 | $52 | 59 |
| 151 Queen Joanna Ln | 0.54mi | 3/2.0 | 1,248 (+5%) | 6mo | $52,900 | $42 | 58 |
| 5201 Andover Dr | 0.64mi | 3/1.0 | 1,082 (-9%) | 6mo | $100,000 | $92 | 49 |
Match score weights: distance 35% · size 25% · config 20% · recency 20%. Top-matched comps best support the ARV.
Projected returns pro-forma
10.0% appreciation · 3.0% rent growth · sell at horizon
- IRR
- 46.8%
- Equity multiple
- 4.52×
- Total profit
- $73,818
- Equity at exit
- $67,476
- IRR
- 40.7%
- Equity multiple
- 10.13×
- Total profit
- $191,469
- Equity at exit
- $145,514
Cash invested: $20,972 (down + closing). Projections, not guarantees.
Landlord ↔ Tenant lean methodology
- Overall (STATE)
- 90 Strongly Landlord-Friendly
- State Mississippi
- 90 Strongly Landlord-Friendly · R+11
- County
- — inherits STATE
- City
- — inherits STATE
ZIP-level market 39209
- Home prices YoY
- 7.7%
- Active inventory
- 165
- Price-to-rent
- 4.8×
Monthly cashflow live
- Estimated rent
- $1,314 medium interval (Pro) →
- Mortgage (P&I)
- −$393
- Tax from tax record
- −$96 /mo · $1,149/yr
- Insurance
- −$31
- HOA
- −$0
- Vacancy / Maint / Mgmt
- −$276
- Net cashflow
- $518
Break-even live
Sensitivity live
| Price | -10% $561 | -5% $539 | +0% $518 | +5% $497 | +10% $476 |
|---|---|---|---|---|---|
| Rent | -10% $414 | -5% $466 | +0% $518 | +5% $570 | +10% $622 |
| Rate | -1.0pp $556 | -0.5pp $537 | base $518 | +0.5pp $499 | +1.0pp $479 |
UW: 25.0% down · 7.5% · 30yr · 1.5% tax · 5.0% vac · 8.0% maint · 8.0% mgmt
Financing live
Cash to close
- Down payment
- $18,725
- Closing costs
- $2,247
- Reserves months
- —
- Total cash needed
- —
Loan-product check · same deal, 3 products live
Conventional
25% down · 7.5% · 30yr
- Down + closing
- —
- Monthly P&I
- —
- Monthly cashflow
- —
- DSCR
- —
- Eligible?
- —
Personal DTI + credit; lowest rate.
DSCR
20% down · 8.5% · 30yr
- Down + closing
- —
- Monthly P&I
- —
- Monthly cashflow
- —
- DSCR
- —
- Eligible?
- —
No personal income docs; deal must DSCR.
Hard money
10% down · 12.0% · 12mo
- Down + closing
- —
- Monthly P&I
- —
- Monthly cashflow
- —
- DSCR
- —
- Eligible?
- —
Short-term bridge; refi at stabilization.
Rent comps 2 comps
| Address | Beds | Baths | Sqft | Rent | $/sqft | DOM | Units | Dist |
|---|---|---|---|---|---|---|---|---|
| 5629 Queen Mary Ln Jackson, MS | 3.0 | 2.0 | 1272 | $1,395 | $1.10 | 14d | 1 | 0.17mi |
| 5301 Queen Mary Ln Jackson, MS | 4.0 | 2.0 | 1100 | $1,338 | $1.22 | 14d | 1 | 0.48mi |
Listing history 17 events
-
2026-04-02status Pending
-
2026-03-13$74,900 Active
-
2021-10-04historical
-
2021-10-02historical
-
2017-04-26soldstatus
-
2016-10-19soldstatus
-
2015-11-04$26,000
-
2009-05-13soldstatus
-
2007-04-03soldstatus
-
2006-11-29soldstatus
-
2006-11-16soldstatus
-
2006-11-03$39,900
-
2000-02-17soldstatus
-
1999-04-19$29,700
-
1998-11-09soldstatus
-
1986-09-11soldstatus
-
1972-09-01soldstatus
ⓘ Source: listings_history table (triggers on properties + properties_extension) + one-shot
backfill from property_details.listing_events for pre-trigger history.
Tax reassessment forecast MS · Resets to sale price
- Current annual tax
- $1,149 · $96/mo
- Projected year-2 tax
- $1,149 · $96/mo
- Expected delta
- $0/yr ($0/mo · 0.0%)
ⓘ Screening estimate from a state-policy table — verify with the county assessor before closing.
Climate risk First Street
- Flood 1/10 Low FEMA zone X (unshaded) · 0% chance over 30 yrs
- Wildfire 1/10 Low
- Heat 7/10 Severe 7 d/yr ≥109°F today · 20 d/yr by 30 yrs out
- Wind 8/10 Severe 80% chance of damaging wind over 30 yrs
- Air quality 1/10 Low 0 unhealthy d/yr today · 0 by 30 yrs out
Nearby sold comps map
Loading sold comps map…
Walkable amenities ~0.75 mi
Loading nearby amenities…
Taxation est. · year 1
- Rental income
- $15,767
- − Mortgage interest
- −$4,196
- − Property taxes
- −$1,149
- − Insurance
- −$374
- − Repairs & maintenance
- −$1,261
- − Management
- −$1,261
- − Depreciation
- −$2,179
- Taxable income
- $5,346
- Est. tax owed @ 24.0%
- −$1,283
- After-tax cash flow
- $4,935/yr
For passive investors: Depreciation is non-cash, so a rental often shows a tax loss while cash-flowing — sheltering income. Rental losses are passive: they offset passive income freely, and up to $25,000/yr can offset ordinary (W-2) income if you actively participate and your MAGI is under $100k (phasing out to $0 by $150k); unused losses carry forward. On sale, claimed depreciation is recaptured at up to 25%, and gains may owe capital-gains tax (a 1031 exchange can defer both). Figures are a year-1 estimate at your 24.0% rate — not tax advice; consult a CPA.
Schools (NCES district)
- District
- Jackson Public School District
- NCES district ID
- 2802190
- Math proficiency
- 9% ▼ -14.00%
- Reading proficiency
- 18% ▼ -7.00%
- Median HH income
- $33,234
- Composite
- 10.89/100
- National rank
- #9755
- State rank
- #112 of 130 in MS
Livability — Jackson
- Score
- 68/100
- State rank
- #66
- US rank
- #9695
Category grades
Schools grade is shown separately in the Schools card above.
Census & demographics
- Census place
- Jackson, MS
- County
- Hinds County · 167,040 people
- City population
- 140,204
- Metro
- Jackson, MS
- Population (ZIP)
- 25,776
- Household income
- $36,344
- Rent vs Own
- Severe rent burden
- 1627.0
Population outlook (Hinds County) Hauer SSP2
- Today (2025)
- 242,528 people
- By 2030
- 241,113 · -0.6%
- By 2040
- 235,557 · -2.9%
- By 2050
- 226,946 · -6.4%
- By 2075
- 199,995 · -17.5%
- By 2100
- 164,165 · -32.3%
Race, ethnicity, and origin ACS 2023
- Neighborhood character
- Predominantly Black (90%)
- Race & ethnicity
- Black 90% White 7% Two or more races 2% Hispanic / Latino 1%
- Foreign-born
- 1% · Canada
- Languages at home
- 98% English-only · Spanish 2%
Political lean MEDSL · Hinds
- 2024 margin
- Solid D (+46.1) · D 72.4% · R 26.3% · Other 1.4%
- 2008→2024 swing
- +7.1pp toward D · 2008: 39.0pp · 2024: 46.1pp
- All cycles
- 2024: D+46.1 2020: D+48.3 2016: D+43.7 2012: D+45.1 2008: D+39.0
Not yet ingested
- Civics
- —
Market trends
- HPI YoY
- ▲ 22.28%
- Current HPI
- 312.6754
- Rent YoY
- —
- Metro
- Jackson, MS
- State GDP YoY
- —
- F500 in state
- 0
Price history
+152.2% since first listed17 events — show timeline
- 2026-04-02 Pending — MLSU
- 2026-03-13 Listed $74,900 MLSU
- 2021-10-04 Listing Removed — MLSU
- 2021-10-02 Listing Removed — MLSU
- 2017-04-26 Sold (Public Records) — Public Records
- 2016-10-19 Sold (Public Records) — Public Records
- 2015-11-04 Listed $26,000 MLSU
- 2009-05-13 Sold (Public Records) — Public Records
- 2007-04-03 Sold (Public Records) — Public Records
- 2006-11-29 Sold (MLS) — MLSU
- 2006-11-16 Sold (Public Records) — Public Records
- 2006-11-03 Listed $39,900 MLSU
- 2000-02-17 Sold (Public Records) — Public Records
- 1999-04-19 Listed $29,700 MLSU
- 1998-11-09 Sold (Public Records) — Public Records
- 1986-09-11 Sold (Public Records) — Public Records
- 1972-09-01 Sold (Public Records) — Public Records
Property tax history
+1.3%/yrLatest (2025): $1,149 · +3.7% YoY. Source: county tax records.
Cash-flow waterfall
monthlySold comps — $/sqft
last 12 mo · ≤1 miLoading sold comps…