2100 Wilcrest Dr · Houston, TX
Flood risk 4/10 · Minor
- FEMA flood zone
- X (unshaded)
- Chance of flooding over 30 yrs
- 0.23%
- Est. flood insurance / yr
- $507 – $1,088
Fire risk 1/10 · Minimal
- Est. fire insurance / yr
- $1,222 – $2,270
Heat risk 9/10 · Severe
- Hot days now (above 110°F)
- 7 days/yr
- Hot days in 30 yrs
- 23 days/yr
Wind risk 9/10 · Severe
- Chance of severe wind over 30 yrs
- 99.0%
Air-quality risk 2/10 · Minimal
- Unhealthy air days now
- 2 days/yr
- Unhealthy air days in 30 yrs
- 2 days/yr
Risk factors via First Street. Map © Google.
Why this score? — see what drove the C+ grade
The composite is a weighted blend of 9 inputs, each scored 0–100. Each bar is that input's sub-score; the figure is the points it added to the 100-point composite (weight × sub-score).
- Cash flow +27.9/30.0
- DSCR +9.9/10.0
- 1% rule +7.7/10.0
- ARV discount +7.5/15.0
- Livability +3.7/5.0
- Schools +2.7/10.0
- Condition / age +2.2/5.0
- Rent growth +1.9/5.0
- Appreciation +0.0/10.0
$85,000
🖨 Deal sheet 📄 Offer letter ✓ Due diligence
Listing remarks
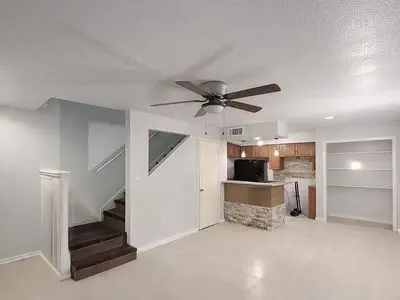
NEW AC/HEAT SYSTEM, FRESH PAINT, NEW ELECTRICAL FUSE BOX, NEW TOILET/WATER SYSTEM INSTALL NICE WESTCHASE AREA, EASY ACCES TO HIGHWAYS 1 BEDROOMS 1 BATHS ON 2N FLOOR. LARGE LIVING AND DINING . RECENT FLOORING IN BEDROOMS/STAIRS . NO CARPET, WASHER AND DRYER CONNECTIONS. SWIMMING POOL. . GATED COMMUNITY . SECURITY ON SITE . ASSIGNED COVER PARKING .
Key facts
- Gated community
- New ac/heat system
- Swimming pool
Tags
Property features AI
Exterior
- Home design: Built in 1978
- Construction: Living area approximately 1200
- Exterior features: Located in the Briar Forest subdivision
Neighborhood map
What this means for you Summary
Snapshot
- This is a 1-bed/1.0-bath single-family listed at $85k. Condition is rated fair.
Deal economics
- At list price, monthly cash flow is $262 ($3k/yr) — positive.
- The deal already cash-flows at list — no discount required.
- Meets the 1% rule at list price ($1k rent vs $85k).
- Recommended offer: $82k (3.0% below list) — sets the bar for market timing.
- Cap rate 10.0% vs local median 3.2% in Houston — top-decile yield for the area; either an underpriced asset or a hidden risk that comps aren't pricing in. Stress-test before assuming the spread holds.
Location & tenants
- Location reads 74/100 on livability (#184 in TX, #4,771 nationally) — a middle-class / working-renter tenant base. Strengths: amenities A+, cost of living A+, housing A+; Watch: schools D, crime F.
- Houston ISD (urban): math 27% / reading 35% proficiency, ranked #593 of 826 in TX (top 72%) — families likely to look elsewhere, expect single-tenant / working-renter base with shorter leases; 71% free/reduced lunch — lower-income household profile, screen leases tightly.
- Market conditions: Rents soft (-2.3%/yr); 243 active listings in the ZIP; 40 comparable units currently listed for rent nearby; rentals leasing fast (median 13d on market — plan ~1-2 weeks tenant-placement turnaround); 29,883 units permitted in Harris County in 2024 (8,621 in 5+ unit buildings).
Forward outlook
- Local home prices are declining (-3.0%/yr); year-one equity from $588 of loan paydown is wiped out by about $3k of value loss. Plan a longer hold.
- Harris County population projected at +47% by 2050 — long-run rental-demand tailwind backs the buy-and-hold thesis.
Negotiation context
- It's been on market 37 days — a 3% lower offer ($82k) is reasonable based on typical stale-listing flexibility.
- 8 sale attempts; this cycle's ask is 7291% above the opening price — seller raised mid-cycle; expect resistance to lowballs.
Risks & watch-outs
- Climate carrying-cost: severe wind risk, 99% chance of damaging wind over 30y; extreme-heat days projected 7→23/yr by 2055 (HVAC capex compounding) — expect insurance premiums to compound above CPI over the hold.
Questions for the listing agent
- It's been on market 37 days. Have you received any prior offers? Is the seller open to a 3% concession, seller financing, or rate buy-down credit?
- Have any recent inspections been done? Can we get a copy of the seller's disclosures and any deferred-maintenance estimates?
- Built in 1978 — when were the roof, HVAC, electrical panel, plumbing, and water heater last replaced?
- Is there a deadline driving the sale (1031 exchange, divorce, estate, relocation)? That informs how much negotiation room exists.
- Schools are D-rated, which usually means shorter tenancies and higher turnover. Who's the typical renter profile here, and what's been the actual vacancy rate?
- Crime grade is F in this area — have there been break-ins, vandalism, or insurance claims at this property in the last 3 years? What carrier currently insures it and at what premium?
- What's the average days-on-market for RENTAL listings here right now (not sales)? A rising rental-DOM trend means longer vacancies and softer asking-rent achievability than the comps imply.
- What's the recent tenant-quality profile in this submarket — average credit score on applications, eviction rate, late-payment / NSF rate, and stable-employment percentage? A property-management company in the area should have these aggregated.
- How much new for-sale + rental construction is in the pipeline within 1–3 miles? Heavy new supply typically softens prices + rents 12–24 months out; constrained supply supports both.
Investment metrics
- 1% rule
- 1.27% ✓
- Cap rate
- 9.99%
- Cash-on-cash
- 13.22%
- DSCR
- 1.59
- GRM
- 6.6
CMA / ARV
- ARV (on-the-fly)
- $279,600
- Comps found
- 2
Show comp detail 2 sales within ~0.75 mi
| Address | Dist | Beds/Ba | Sqft | Sold | Price | $/sf | Match |
|---|---|---|---|---|---|---|---|
| 10739 Boardwalk St | 0.35mi | 2/1.5 (+1) | 1,200 (0%) | 13mo | $279,000 | $233 | 66 |
| 1908 Trixie Ln | 0.17mi | 2/2.0 (+1) | 1,334 (+11%) | 22mo | $269,000 | $202 | 46 |
Match score weights: distance 35% · size 25% · config 20% · recency 20%. Top-matched comps best support the ARV.
Projected returns pro-forma
-3.0% appreciation · 0.0% rent growth · sell at horizon
- IRR
- -0.2%
- Equity multiple
- 0.99×
- Total profit
- $-214
- Equity at exit
- $12,674
- IRR
- 6.0%
- Equity multiple
- 1.39×
- Total profit
- $9,197
- Equity at exit
- $7,349
Cash invested: $23,800 (down + closing). Projections, not guarantees.
Landlord ↔ Tenant lean methodology
- Overall (STATE)
- 87 Strongly Landlord-Friendly
- State Texas
- 87 Strongly Landlord-Friendly · R+5
- County
- — inherits STATE
- City
- — inherits STATE
ZIP-level market 77042
- Rents YoY
- -2.3%
- Active inventory
- 243
- Price-to-rent
- 6.6×
Monthly cashflow live
- Estimated rent
- $1,075 high interval (Pro) →
- Mortgage (P&I)
- −$446
- Tax est. 1.5%
- −$106 /mo · $1,275/yr
- Insurance
- −$35
- HOA
- −$0
- Vacancy / Maint / Mgmt
- −$226
- Net cashflow
- $262
Break-even live
UW: 25.0% down · 7.5% · 30yr · 1.5% tax · 5.0% vac · 8.0% maint · 8.0% mgmt
Financing live
Cash to close
- Down payment
- $21,250
- Closing costs
- $2,550
- Reserves months
- —
- Total cash needed
- —
Loan-product check · same deal, 3 products live
Conventional
25% down · 7.5% · 30yr
- Down + closing
- —
- Monthly P&I
- —
- Monthly cashflow
- —
- DSCR
- —
- Eligible?
- —
Personal DTI + credit; lowest rate.
DSCR
20% down · 8.5% · 30yr
- Down + closing
- —
- Monthly P&I
- —
- Monthly cashflow
- —
- DSCR
- —
- Eligible?
- —
No personal income docs; deal must DSCR.
Hard money
10% down · 12.0% · 12mo
- Down + closing
- —
- Monthly P&I
- —
- Monthly cashflow
- —
- DSCR
- —
- Eligible?
- —
Short-term bridge; refi at stabilization.
Rent comps 40 comps
| Address | Beds | Baths | Sqft | Rent | $/sqft | DOM | Units | Dist |
|---|---|---|---|---|---|---|---|---|
| 2100 Wilcrest Dr Houston, TX | 2.0 | 1.5–2.0 | 925 | $1,025 | $1.11 | 43d | 3 | 0.08mi |
| 11201 Olympia Dr Houston, TX | 2.0 | 2.0 | 1040 | $1,109 | $1.07 | 43d | 1 | 0.09mi |
| 2300 Wilcrest Dr Houston, TX | 1.0–2.0 | 1.0–2.0 | 714 | $809 | $1.13 | 8d | 12 | 0.22mi |
| 2300 Wilcrest Dr Houston, TX | 2.0 | 1.0–2.0 | 732 | $1,004 | $1.37 | 43d | 1 | 0.22mi |
| 2306 Wilcrest Dr Houston, TX | 2.0 | 2.0 | 950 | $1,095 | $1.15 | 43d | 1 | 0.30mi |
| 2306 Wilcrest Dr Houston, TX | 2.0 | 2.0 | 950 | $1,095 | $1.15 | 14d | 1 | 0.30mi |
| 10950 Briar Forest Dr Houston, TX | 1.0–4.0 | 1.0–2.0 | 1019 | $650 | $0.64 | 8d | 1 | 0.31mi |
| 10956 Briar Forest Dr Houston, TX | 2.0 | 1.0 | 951 | $975 | $1.03 | 24d | 1 | 0.31mi |
| 2301 Hayes Rd Houston, TX | 1.0 | 1.0 | 730 | $910 | $1.25 | 14d | 1 | 0.31mi |
| 2301 Hayes Rd Unit 2322 Houston, TX | 1.0 | 1.0 | 730 | $915 | $1.25 | 14d | 1 | 0.31mi |
| 10950 Briar Forest Dr Unit 2047 Houston, TX | 2.0 | 2.0 | 951 | $932 | $0.98 | 3d | 1 | 0.33mi |
| 10925 Briar Forest Dr Houston, TX | 1.0–3.0 | 1.0–2.0 | 917 | $799 | $0.87 | 1d | 16 | 0.33mi |
| 10950 Briar Forest Dr Unit 2162 Houston, TX | 2.0 | 2.0 | 951 | $940 | $0.99 | 8d | 1 | 0.38mi |
| 1307 Wilcrest Dr Unit 2174 Houston, TX | 2.0 | 2.0 | 924 | $1,123 | $1.22 | 11d | 1 | 0.40mi |
| 1307 Wilcrest Dr Unit 1364 Houston, TX | 2.0 | 2.0 | 924 | $1,134 | $1.23 | 12d | 1 | 0.40mi |
| 1307 Wilcrest Dr Unit 3305 Houston, TX | 2.0 | 2.0 | 924 | $1,129 | $1.22 | 24d | 1 | 0.40mi |
| 1307 Wilcrest Dr Unit 2165 Houston, TX | 2.0 | 2.0 | 924 | $1,091 | $1.18 | 3d | 1 | 0.41mi |
| 1251 Wilcrest Dr Unit F Houston, TX | 2.0 | 2.0 | 1240 | $1,125 | $0.91 | 24d | 1 | 0.48mi |
| 1251 Wilcrest Dr Unit G Houston, TX | 2.0 | 2.0 | 1360 | $1,200 | $0.88 | 24d | 1 | 0.48mi |
| 1251 Wilcrest Dr Unit 424 Houston, TX | 2.0 | 2.0 | 1240 | $1,215 | $0.98 | 8d | 1 | 0.48mi |
| 1251 Wilcrest Dr Unit 1308 Houston, TX | 2.0 | 2.0 | 1240 | $1,207 | $0.97 | 3d | 1 | 0.48mi |
| 10698 Briar Forest Dr Houston, TX | 2.0 | 2.0 | 1224 | $1,300 | $1.06 | 19d | 1 | 0.51mi |
| 1201 Wilcrest Dr Houston, TX | 1.0–4.0 | 1.0–2.0 | 1209 | $1,169 | $0.97 | 4d | 21 | 0.59mi |
| 11661 Briar Forest Dr Unit 8 Houston, TX | 2.0 | 2.0 | 813 | $930 | $1.14 | 24d | 1 | 0.67mi |
| 2500 Woodland Park Dr Houston, TX | 1.0–3.0 | 1.0–2.0 | 1054 | $979 | $0.93 | 1d | 35 | 0.69mi |
| 2828 Hayes Rd Unit 2885 Houston, TX | 2.0 | 2.0 | 1004 | $1,214 | $1.21 | 43d | 1 | 0.71mi |
| 111609 Village Place Dr Houston, TX | 2.0 | 3.0 | 1444 | $1,698 | $1.18 | 43d | 1 | 0.73mi |
| 2601 Woodland Park Dr Houston, TX | 1.0–2.0 | 1.0–2.0 | 911 | $1,151 | $1.26 | 1d | 20 | 0.75mi |
| 11710 Briar Forest Dr Houston, TX | 1.0–2.0 | 1.0–2.0 | 668 | $699 | $1.05 | 3d | 11 | 0.78mi |
| 10940 Meadowglen Ln Houston, TX | 2.0 | 2.0 | 1081 | $1,315 | $1.22 | 43d | 1 | 0.78mi |
| 11655 Briar Forest Dr Unit 422 Houston, TX | 2.0 | 2.0 | 813 | $789 | $0.97 | 8d | 1 | 0.78mi |
| 11655 Briar Forest Dr Unit 423 Houston, TX | 2.0 | 2.0 | 813 | $813 | $1.00 | 11d | 1 | 0.78mi |
| 11655 Briar Forest Dr Unit 2187 Houston, TX | 2.0 | 2.0 | 813 | $781 | $0.96 | 3d | 1 | 0.78mi |
| 2828 Hayes Rd Houston, TX | 1.0 | 1.0 | 770 | $1,165 | $1.51 | 44d | 1 | 0.79mi |
| 2828 Hayes Rd Houston, TX | 1.0–2.0 | 1.0–2.0 | 1064 | $969 | $0.91 | 7d | 24 | 0.79mi |
| 2607 Woodland Park Dr Houston, TX | 2.0 | 2.0 | 1099 | $1,497 | $1.36 | 24d | 1 | 0.81mi |
| 2800 Wilcrest Dr Houston, TX | 1.0 | 1.0 | 723 | $1,045 | $1.45 | 24d | 1 | 0.82mi |
| 10500 Valley Forge Dr Houston, TX | 3.0 | 1.0–2.0 | 1109 | $1,032 | $0.93 | 2d | 15 | 0.83mi |
| 2777 Woodland Park Dr Unit 2834 Houston, TX | 2.0 | 2.0 | 1038 | $1,605 | $1.55 | 13d | 1 | 0.83mi |
| 2777 Woodland Park Dr Unit 2800 Houston, TX | 2.0 | 2.0 | 1038 | $1,594 | $1.54 | 3d | 1 | 0.83mi |
Listing history 26 events
-
2026-06-18days on market $85,000 Active 37 DOM
-
2026-06-17days on market $85,000 Active 36 DOM
-
2026-06-16days on market $85,000 Active 35 DOM
-
2026-06-15days on market $85,000 Active 34 DOM
-
2026-06-13days on market $85,000 Active 32 DOM
-
2026-06-10days on market $85,000 Active 28 DOM
-
2026-06-08days on market $85,000 Active 27 DOM
-
2026-06-07days on market $85,000 Active 26 DOM
-
2026-06-04days on market $85,000 Active 23 DOM
-
2026-06-01days on market $85,000 Active 20 DOM
-
2026-05-31days on market $85,000 Active 19 DOM
-
2026-05-13$85,000 Active 348-char remark
-
2026-04-04price $1,150
-
2026-03-19$1,190
-
2026-03-09historical $1,190
-
2026-02-13$1,190
-
2025-12-17historical $1,200
-
2025-10-30price $1,200
-
2025-10-09$1,250
-
2025-10-03historical $1,250
-
2025-10-01price $1,250
-
2025-09-08$1,300
-
2025-09-03historical $1,300
-
2025-08-25$1,300
-
2025-06-29historical $690
-
2025-05-13$690
ⓘ Source: listings_history table (triggers on properties + properties_extension) + one-shot
backfill from property_details.listing_events for pre-trigger history.
Climate risk First Street
- Flood 4/10 Moderate FEMA zone X (unshaded) · 23% chance over 30 yrs
- Wildfire 1/10 Low
- Heat 9/10 Extreme 7 d/yr ≥110°F today · 23 d/yr by 30 yrs out
- Wind 9/10 Extreme 99% chance of damaging wind over 30 yrs
- Air quality 2/10 Low 2 unhealthy d/yr today · 2 by 30 yrs out
Nearby sold comps map
Loading sold comps map…
Walkable amenities ~0.75 mi
Loading nearby amenities…
Taxation est. · year 1
- Rental income
- $12,904
- − Mortgage interest
- −$4,761
- − Property taxes
- −$1,275
- − Insurance
- −$425
- − Repairs & maintenance
- −$1,032
- − Management
- −$1,032
- − Depreciation
- −$2,473
- Taxable income
- $1,906
- Est. tax owed @ 24.0%
- −$457
- After-tax cash flow
- $2,688/yr
For passive investors: Depreciation is non-cash, so a rental often shows a tax loss while cash-flowing — sheltering income. Rental losses are passive: they offset passive income freely, and up to $25,000/yr can offset ordinary (W-2) income if you actively participate and your MAGI is under $100k (phasing out to $0 by $150k); unused losses carry forward. On sale, claimed depreciation is recaptured at up to 25%, and gains may owe capital-gains tax (a 1031 exchange can defer both). Figures are a year-1 estimate at your 24.0% rate — not tax advice; consult a CPA.
Condition & rehab AI · 2 photos
The home presents a fair condition with cosmetic updates needed, particularly in painting and landscaping. Fresh paint and landscaping improvements can significantly enhance its value.
Repairs flagged
- Minor Painting — Interior and exterior walls and ceilings appear dull and could benefit from a fresh coat of paint.
Value-add opportunities
- Both Painting interior and exterior — Fresh paint can improve the home's curb appeal and interior aesthetics, enhancing both resale and rental value.
- Both Landscaping improvements — Aesthetic landscaping can significantly boost the home's curb appeal and attract more potential buyers or renters.
- Both HVAC system maintenance — A clean and functioning HVAC system is crucial for comfort and can positively impact both resale and rental value.
Renovation cost estimate screening
| Repair item | Severity | Est. cost |
|---|---|---|
| Painting · Interior and exterior walls and ceilings appear dull and could benefit from a fresh coat of paint. | Minor | $500–3,000 |
| Total estimated repair cost · 1 items | $500–3,000 |
Value-add ROI direction
- Both Painting interior and exterior — Fresh paint can improve the home's curb appeal and interior aesthetics, enhancing both resale and rental value. ↑
- Both Landscaping improvements — Aesthetic landscaping can significantly boost the home's curb appeal and attract more potential buyers or renters. ↑
- Both HVAC system maintenance — A clean and functioning HVAC system is crucial for comfort and can positively impact both resale and rental value. ↑
ⓘ Cost ranges are severity-bucket heuristics (US national rule-of-thumb). Get contractor quotes + a written scope before underwriting a rehab budget.
Schools (NCES district)
- District
- Houston ISD
- NCES district ID
- 4823640
- Math proficiency
- 27% ▼ -18.00%
- Reading proficiency
- 35% ▼ -6.00%
- Median HH income
- $46,054
- Composite
- 26.63/100
- National rank
- #7173
- State rank
- #593 of 826 in TX
Livability — Houston
- Score
- 74/100
- State rank
- #184
- US rank
- #4771
Category grades
Schools grade is shown separately in the Schools card above.
Census & demographics
- Census place
- Houston, TX
- County
- Harris County · 4,702,590 people
- City population
- 3,226,434
- Metro
- Houston-The Woodlands-Sugar Land, TX
- Population (ZIP)
- 38,721
- Household income
- $59,097
- Rent vs Own
- Severe rent burden
- 3994.0
Population outlook (Harris County) Hauer SSP2
- Today (2025)
- 5,571,493 people
- By 2030
- 6,089,821 · +9.3%
- By 2040
- 7,142,806 · +28.2%
- By 2050
- 8,185,864 · +46.9%
- By 2075
- 10,574,329 · +89.8%
- By 2100
- 12,109,958 · +117.4%
Race, ethnicity, and origin ACS 2023
- Neighborhood character
- Highly diverse neighborhood (Simpson 0.72)
- Race & ethnicity
- Hispanic / Latino 36% White 31% Black 24% Two or more races 18% Asian 6% Native American 1%
- Hispanic origin (detail)
- Mexican 14% Cuban 4%
- Common ancestry
- Romanian 1% Serbian 1% Italian 1%
- Foreign-born
- 35% · Canada, Jamaica, China
- Languages at home
- 55% English-only · Spanish 31% Other Indo-European 2% Russian/Polish/Slavic 2%
Political lean MEDSL · Harris
- 2024 margin
- Lean D (+5.5) · D 52.0% · R 46.4% · Other 1.6%
- 2008→2024 swing
- +3.9pp toward D · 2008: 1.6pp · 2024: 5.5pp
- All cycles
- 2024: D+5.5 2020: D+13.3 2016: D+12.4 2012: D+0.1 2008: D+1.6
Not yet ingested
- Civics
- —
Market trends
- HPI YoY
- ▼ -234.36%
- Current HPI
- 215.9671
- Rent YoY
- ▼ -2.30%
- Metro
- Houston-The Woodlands-Sugar Land, TX
- State GDP YoY
- ▲ 3.95%
- F500 in state
- 110
Industry mix (Fortune 500 HQ in TX)
| Industry | F500 HQs | Revenue |
|---|---|---|
| Energy | 16 | $1,198B |
|
||
| Technology | 5 | $198B |
|
||
| Engineering / Construction | 4 | $72B |
|
||
| Energy Services | 3 | $60B |
|
||
| Utilities | 3 | $41B |
|
||
| Healthcare | 2 | $330B |
|
||
Price history
-11.5% since first listed17 events — show timeline
- 2026-06-09 Listed for Rent $1,150 APPFOLIO
- 2026-06-03 Rental Removed $1,150 APPFOLIO
- 2026-05-13 Listed $85,000 FSBO.com
- 2026-04-04 Price Changed $1,150 APPFOLIO
- 2026-03-19 Listed for Rent $1,190 APPFOLIO
- 2026-03-09 Rental Removed $1,190 APPFOLIO
- 2026-02-13 Listed for Rent $1,190 APPFOLIO
- 2025-12-17 Rental Removed $1,200 APPFOLIO
- 2025-10-30 Price Changed $1,200 APPFOLIO
- 2025-10-09 Listed for Rent $1,250 APPFOLIO
- 2025-10-03 Rental Removed $1,250 APPFOLIO
- 2025-10-01 Price Changed $1,250 APPFOLIO
- 2025-09-08 Listed for Rent $1,300 APPFOLIO
- 2025-09-03 Rental Removed $1,300 APPFOLIO
- 2025-08-25 Listed for Rent $1,300 APPFOLIO
- 2025-06-29 Rental Removed $690 SHOWMOJO
- 2025-05-13 Listed for Rent $690 SHOWMOJO
Cash-flow waterfall
monthlySold comps — $/sqft
last 12 mo · ≤1 miLoading sold comps…