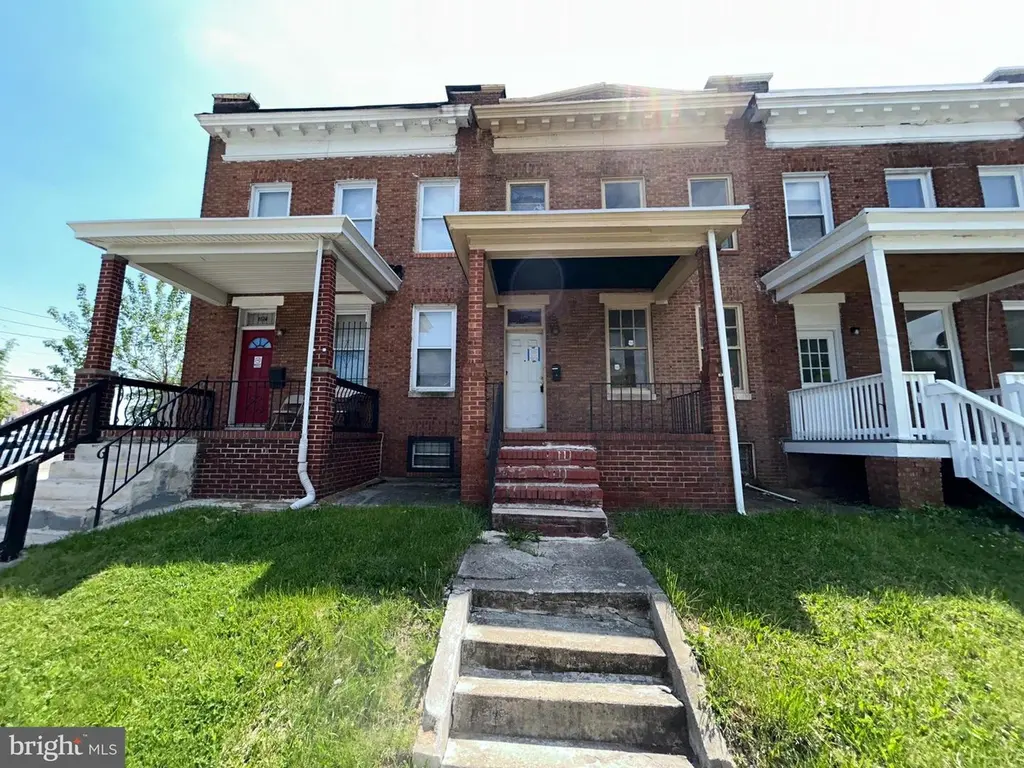
2215 Belair Rd · Baltimore, MD
Flood risk 1/10 · Minimal
- FEMA flood zone
- X (unshaded)
- Chance of flooding over 30 yrs
- 0.0%
- Est. flood insurance / yr
- $473 – $860
Fire risk 1/10 · Minimal
- Est. fire insurance / yr
- $755 – $1,403
Heat risk 7/10 · Major
- Hot days now (above 103°F)
- 7 days/yr
- Hot days in 30 yrs
- 15 days/yr
Wind risk 6/10 · Moderate
- Chance of severe wind over 30 yrs
- 27.0%
Air-quality risk 4/10 · Minor
- Unhealthy air days now
- 6 days/yr
- Unhealthy air days in 30 yrs
- 7 days/yr
Risk factors via First Street. Map © Google.
Why this score? — see what drove the A- grade
The composite is a weighted blend of 9 inputs, each scored 0–100. Each bar is that input's sub-score; the figure is the points it added to the 100-point composite (weight × sub-score).
- Cash flow +30.0/30.0
- ARV discount +15.0/15.0
- 1% rule +10.0/10.0
- DSCR +10.0/10.0
- Appreciation +4.7/10.0
- Rent growth +3.8/5.0
- Livability +3.8/5.0
- Condition / age +2.5/5.0
- Schools +1.0/10.0
$80,000
🖨 Deal sheet 📄 Offer letter ✓ Due diligence
Listing remarks
Discover an exceptional investment opportunity in the heart of Belair-Edison! Built in 1924, this home blends classic architecture with modern living, offering 1,460 sq. ft. of versatile space. Venture inside to find a welcoming open floor plan that invites natural light to dance across the spacious living and dining areas, which is ideal for entertaining. The kitchen, which is adjacent to the dining area, features ample table space, white cabinetry and appliances, making it a delightful spot for casual meals. The full bathroom features a convenient tub shower, ensuring comfort. With four generous bedrooms, there's plenty of room for relaxation. The unfinished basement presents a blank canv
Key facts
- Open floor plan
- Ample table space
- Full bathroom
Tags
Property features AI
Finance
- Other: Ground rent amount applies
- Financial info: Ground rent exists and is payable semi-annually
Exterior
- Parking: On-street parking
- Utilities: Public water; Public sewer; Natural gas for heat and hot water
- Home design: Interior townhouse/rowhouse; Level entry to main level
- Construction: Brick and brick-front with combination vinyl siding; Concrete perimeter foundation; Above-grade living area and above-grade structures
- Exterior features: Front yard and rear yard; Rear yard fenced; Porch(es); Sidewalks and street lights
Interior
- Kitchen: Kitchen with table space
- Basement: Unfinished full basement with interior access, connecting stairway, outside/rear entrance, walkout stairs and windows
- Bedrooms: Four bedrooms on the first upper level; Rooms include Living Room, Dining Room, Bedroom 1, Bedroom 2, Bedroom 3, Bedroom 4, Kitchen, Full Bath
- Flooring: Carpet
- Bathrooms: One full bathroom on the upper level; One full bathroom total
- Heating & cooling: Forced air heating; Other heating type; Natural gas heating and hot water
- Interior features: Open floor plan; Dining area; Kitchen with table space; Tub with shower; Drywall walls and ceilings
Neighborhood map
What this means for you Summary
Snapshot
- This is a 4-bed/1.0-bath townhouse listed at $80k.
Deal economics
- At list price, monthly cash flow is $993 ($12k/yr) — positive.
- The deal already cash-flows at list — no discount required.
- Meets the 1% rule at list price ($2k rent vs $80k).
- Recommended offer: $78k (3.0% below list) — sets the bar for market timing.
- Cap rate 21.2% vs local median 6.0% in Baltimore — top-decile yield for the area; either an underpriced asset or a hidden risk that comps aren't pricing in. Stress-test before assuming the spread holds.
Location & tenants
- Location reads 76/100 on livability (#90 in MD, #3,396 nationally) — a middle-class / working-renter tenant base. Strengths: amenities A+, commute A+, housing A+; Watch: schools D, crime F.
- Baltimore City Public Schools (urban): math 7% / reading 16% proficiency, ranked #24 of 24 in MD (top 100%) — low school quality limits family demand, transient renter base, plan for 1-2y turnover; 79% free/reduced lunch — lower-income household profile, screen leases tightly.
- Market conditions: Rents rising fast (+5.2%/yr); 319 active listings in the ZIP; 40 comparable units currently listed for rent nearby; rentals lingering (median 44d on market — plan ~5-8 weeks vacancy on turnover, expect pricing pressure); 50% of comp listings sitting > 30 days — soft ceiling on asking rent; 1,273 units permitted in Baltimore city in 2024 (1,104 in 5+ unit buildings).
- At $1,942/mo this rent would consume 45% of the median local household income ($51k/yr) (locally 1868% of renters already pay >50% of income on rent) — very limited rent-growth headroom before tenants either downsize or default.
Forward outlook
- In year one you build about $99 of equity ($553 loan paydown + $-454 appreciation (-0.6% local appreciation)).
- Baltimore County population projected to shrink 4% by 2050 — rents likely to lag national; underwrite the cash flow, not the appreciation.
- At projected returns (-0.6% appreciation + 5.2% rent growth), your $22k cash investment doubles in ~2 years — after that, you're playing with house money.
Negotiation context
- It's been on market 53 days — a 3% lower offer ($78k) is reasonable based on typical stale-listing flexibility.
Risks & watch-outs
- Watch-outs: built in 1924 — expect roof / HVAC / electrical / plumbing capex.
- Climate carrying-cost: major wind risk, 27% chance of damaging wind over 30y; extreme-heat days projected 7→15/yr by 2055 (HVAC capex compounding) — expect insurance premiums to compound above CPI over the hold.
Questions for the listing agent
- It's been on market 53 days. Have you received any prior offers? Is the seller open to a 3% concession, seller financing, or rate buy-down credit?
- Built in 1924 — when were the roof, HVAC, electrical panel, plumbing, and water heater last replaced?
- Is there a deadline driving the sale (1031 exchange, divorce, estate, relocation)? That informs how much negotiation room exists.
- Schools are D-rated, which usually means shorter tenancies and higher turnover. Who's the typical renter profile here, and what's been the actual vacancy rate?
- Crime grade is F in this area — have there been break-ins, vandalism, or insurance claims at this property in the last 3 years? What carrier currently insures it and at what premium?
- What's the average days-on-market for RENTAL listings here right now (not sales)? A rising rental-DOM trend means longer vacancies and softer asking-rent achievability than the comps imply.
- What's the recent tenant-quality profile in this submarket — average credit score on applications, eviction rate, late-payment / NSF rate, and stable-employment percentage? A property-management company in the area should have these aggregated.
- How much new for-sale + rental construction is in the pipeline within 1–3 miles? Heavy new supply typically softens prices + rents 12–24 months out; constrained supply supports both.
Investment metrics
- 1% rule
- 2.43% ✓
- Cap rate
- 21.19%
- Cash-on-cash
- 53.20%
- DSCR
- 3.37
- GRM
- 3.4
CMA / ARV
- ARV (median comp)
- $112,128
- List price
- $80,000
- Delta
- -28.65%
- Verdict
- UNDERPRICED
- Comps
- 20 within 1.0 mi
Show comp detail 12 sales within ~0.75 mi
| Address | Dist | Beds/Ba | Sqft | Sold | Price | $/sf | Match |
|---|---|---|---|---|---|---|---|
| 3564 Elmora Ave | 0.48mi | 3/1.5 (-1) | 1,478 (+1%) | 1mo | $133,500 | $90 | 67 |
| 3114 Mareco Ave | 0.37mi | 3/2.0 (-1) | 1,410 (-3%) | 2mo | $125,000 | $89 | 67 |
| 2846 Lake Ave | 0.56mi | 4/2.5 | 1,455 (-0%) | 2mo | $235,000 | $162 | 66 |
| 2902 Clifton Park Ter | 0.40mi | 3/1.5 (-1) | 1,344 (-8%) | 1mo | $66,000 | $49 | 61 |
| 3533 Elmley Ave | 0.41mi | 3/1.5 (-1) | 1,344 (-8%) | 1mo | $70,000 | $52 | 60 |
| 3444 Belair Rd | 0.59mi | 3/2.0 (-1) | 1,428 (-2%) | 2mo | $131,000 | $92 | 58 |
| 2422 E Federal St | 0.58mi | 3/1.0 (-1) | 1,350 (-8%) | 1mo | $55,000 | $41 | 54 |
| 1411 Kenhill Ave | 0.65mi | 4/2.0 | 1,356 (-7%) | 1mo | $240,000 | $177 | 53 |
| 3017 Erdman Ave | 0.41mi | 3/1.0 (-1) | 1,288 (-12%) | 3mo | $129,250 | $100 | 53 |
| 1418 N Linwood Ave | 0.64mi | 3/1.0 (-1) | 1,356 (-7%) | 0mo | $90,000 | $66 | 53 |
| 3620 Erdman Ave | 0.51mi | 3/2.0 (-1) | 1,600 (+10%) | 2mo | $120,000 | $75 | 49 |
| 3733 Ravenwood Ave | 0.72mi | 3/2.0 (-1) | 1,350 (-8%) | 1mo | $135,000 | $100 | 44 |
Match score weights: distance 35% · size 25% · config 20% · recency 20%. Top-matched comps best support the ARV.
Projected returns pro-forma
-0.57% appreciation · 5.25% rent growth · sell at horizon
- IRR
- 56.4%
- Equity multiple
- 3.83×
- Total profit
- $63,317
- Equity at exit
- $20,983
- IRR
- 60.2%
- Equity multiple
- 8.33×
- Total profit
- $164,155
- Equity at exit
- $23,493
Cash invested: $22,400 (down + closing). Projections, not guarantees.
Landlord ↔ Tenant lean methodology
- Overall (CITY)
- 12 Strongly Tenant-Friendly
- State Maryland
- 27 Tenant-Leaning · D+14
- County
- — inherits STATE
- City Baltimore
- 12 Strongly Tenant-Friendly · D+58
ZIP-level market 21213
- Home prices YoY
- -0.1%
- Rents YoY
- 5.2%
- Active inventory
- 319
- Price-to-rent
- 3.4×
Monthly cashflow live
- Estimated rent
- $1,942 high interval (Pro) →
- Mortgage (P&I)
- −$420
- Tax from tax record
- −$88 /mo · $1,057/yr
- Insurance
- −$33
- HOA
- −$0
- Vacancy / Maint / Mgmt
- −$408
- Net cashflow
- $993
Break-even live
UW: 25.0% down · 7.5% · 30yr · 1.5% tax · 5.0% vac · 8.0% maint · 8.0% mgmt
Financing live
Cash to close
- Down payment
- $20,000
- Closing costs
- $2,400
- Reserves months
- —
- Total cash needed
- —
Loan-product check · same deal, 3 products live
Conventional
25% down · 7.5% · 30yr
- Down + closing
- —
- Monthly P&I
- —
- Monthly cashflow
- —
- DSCR
- —
- Eligible?
- —
Personal DTI + credit; lowest rate.
DSCR
20% down · 8.5% · 30yr
- Down + closing
- —
- Monthly P&I
- —
- Monthly cashflow
- —
- DSCR
- —
- Eligible?
- —
No personal income docs; deal must DSCR.
Hard money
10% down · 12.0% · 12mo
- Down + closing
- —
- Monthly P&I
- —
- Monthly cashflow
- —
- DSCR
- —
- Eligible?
- —
Short-term bridge; refi at stabilization.
Rent comps 40 comps
| Address | Beds | Baths | Sqft | Rent | $/sqft | DOM | Units | Dist |
|---|---|---|---|---|---|---|---|---|
| 2113 Belair Rd Baltimore, MD | 3.0 | 1.0 | 1344 | $1,795 | $1.34 | 43d | 1 | 0.06mi |
| 3218 Lyndale Ave Baltimore, MD | 3.0 | 1.5 | 1020 | $1,500 | $1.47 | 23d | 1 | 0.07mi |
| 3222 Lyndale Ave Unit 1 Baltimore, MD | 3.0 | 1.5 | 1500 | $2,200 | $1.47 | 12d | 1 | 0.08mi |
| 3317 Lyndale Ave Baltimore, MD | 3.0 | 1.0 | 900 | $1,300 | $1.44 | 43d | 1 | 0.14mi |
| 3326 Elmora Ave Baltimore, MD | 3.0 | 1.0 | 1200 | $1,450 | $1.21 | 23d | 1 | 0.16mi |
| 3322 Ravenwood Ave Baltimore, MD | 3.0 | 2.0 | 932 | $1,800 | $1.93 | 23d | 1 | 0.17mi |
| 3339 Elmora Ave Baltimore, MD | 3.0 | 2.0 | 896 | $1,600 | $1.79 | 43d | 1 | 0.18mi |
| 3512 Elmora Ave Baltimore, MD | 3.0 | 1.5 | 1472 | $1,900 | $1.29 | 20d | 1 | 0.39mi |
| 3203 Clarence Ave Baltimore, MD | 5.0 | 1.0 | 1388 | $1,865 | $1.34 | 43d | 1 | 0.40mi |
| 3551 Elmley Ave Baltimore, MD | 3.0 | 1.5 | 1872 | $2,095 | $1.12 | 23d | 1 | 0.44mi |
| 2311 E Lafayette Ave Baltimore, MD | 3.0 | 1.0 | 1000 | $1,400 | $1.40 | 43d | 1 | 0.53mi |
| 2828 Lake Ave Baltimore, MD | 3.0 | 2.0 | 1164 | $1,850 | $1.59 | 4d | 1 | 0.55mi |
| 3914 Erdman Ave #1 Baltimore, MD | 3.0 | 1.0 | 1200 | $1,319 | $1.10 | 17d | 1 | 0.61mi |
| 3603 Ravenwood Ave Unit 1 Baltimore, MD | 4.0 | 1.0 | 1566 | $1,600 | $1.02 | 43d | 1 | 0.62mi |
| 2621 E Oliver St Baltimore, MD | 3.0 | 2.0 | 1600 | $1,700 | $1.06 | 23d | 1 | 0.63mi |
| 3515 Parklawn Ave Baltimore, MD | 3.0 | 2.0 | 1240 | $1,700 | $1.37 | 2d | 1 | 0.65mi |
| 3519 Kentucky Ave Baltimore, MD | 3.0 | 2.0 | 1536 | $2,100 | $1.37 | 10d | 1 | 0.67mi |
| 3525 Kentucky Ave Baltimore, MD | 3.0 | 1.5 | 1536 | $1,950 | $1.27 | 43d | 1 | 0.67mi |
| 1403 N Linwood Ave Baltimore, MD | 3.0 | 2.0 | 1660 | $1,995 | $1.20 | 43d | 1 | 0.68mi |
| 2837 Pelham Ave Baltimore, MD | 4.0 | 2.0 | 1164 | $1,675 | $1.44 | 43d | 1 | 0.68mi |
| 2817 Pelham Ave Baltimore, MD | 3.0 | 2.0 | 1464 | $1,950 | $1.33 | 23d | 1 | 0.68mi |
| 2848 Pelham Ave Baltimore, MD | 3.0 | 2.0 | 1164 | $1,700 | $1.46 | 43d | 1 | 0.70mi |
| 2735 Chesterfield Ave Baltimore, MD | 3.0 | 2.5 | 1536 | $2,000 | $1.30 | 10d | 1 | 0.75mi |
| 1832 E 28th St Baltimore, MD | 3.0 | 1.0 | 1066 | $1,495 | $1.40 | 23d | 1 | 0.75mi |
| 2626 E Preston St Baltimore, MD | 3.0 | 1.0 | 1136 | $1,800 | $1.58 | 43d | 1 | 0.76mi |
| 1802 E 28th St Baltimore, MD | 3.0 | 1.0 | 1300 | $1,600 | $1.23 | 23d | 1 | 0.79mi |
| 2706 E Biddle St Baltimore, MD | 3.0 | 2.0 | 1577 | $1,395 | $0.88 | 43d | 1 | 0.83mi |
| 1814 E Lafayette Ave Baltimore, MD | 4.0 | 2.0 | 1200 | $1,995 | $1.66 | 23d | 1 | 0.84mi |
| 1215 N Ellwood Ave Baltimore, MD | 3.0 | 1.0 | 1128 | $1,795 | $1.59 | 23d | 1 | 0.84mi |
| 3544 Chesterfield Ave Baltimore, MD | 3.0 | 1.5 | 1200 | $1,635 | $1.36 | 43d | 1 | 0.84mi |
| 1629 N Wolfe St Baltimore, MD | 3.0 | 3.0 | 1561 | $1,800 | $1.15 | 23d | 1 | 0.85mi |
| 3305 Dudley Ave Baltimore, MD | 3.0 | 2.0 | 1413 | $1,950 | $1.38 | 43d | 1 | 0.86mi |
| 3300 Dudley Ave Baltimore, MD | 4.0 | 2.0 | 1724 | $2,200 | $1.28 | 43d | 1 | 0.88mi |
| 1627 Rutland Ave Unit 1 Baltimore, MD | 3.0 | 2.0 | 1200 | $2,350 | $1.96 | 43d | 1 | 0.90mi |
| 1627 Rutland Ave Baltimore, MD | 3.0 | 2.0 | 1100 | $1,950 | $1.77 | 23d | 1 | 0.90mi |
| 1607 Cliftview Ave Baltimore, MD | 3.0 | 1.0 | 1200 | $1,475 | $1.23 | 43d | 1 | 0.90mi |
| 1519 E 28th St Baltimore, MD | 3.0 | 2.0 | 1100 | $1,350 | $1.23 | 43d | 1 | 0.94mi |
| 1702 E 32nd St Baltimore, MD | 3.0 | 2.0 | 1344 | $2,300 | $1.71 | 43d | 1 | 0.97mi |
| 1539 Abbotston St Baltimore, MD | 3.0 | 2.0 | 1800 | $1,995 | $1.11 | 43d | 1 | 0.98mi |
| 3573 Shannon Dr Baltimore, MD | 4.0 | 2.0 | 1493 | $2,300 | $1.54 | 17d | 1 | 1.00mi |
Listing history 16 events
-
2026-06-18days on market $80,000 Active 53 DOM
-
2026-06-17days on market $80,000 Active 52 DOM
-
2026-06-16days on market $80,000 Active 51 DOM
-
2026-06-15days on market $80,000 Active 50 DOM
-
2026-06-13days on market $80,000 Active 48 DOM
-
2026-06-09days on market $80,000 Active 44 DOM
-
2026-06-08days on market $80,000 Active 43 DOM
-
2026-06-07days on market $80,000 Active 42 DOM
-
2026-06-04days on market $80,000 Active 39 DOM
-
2026-06-03days on market $80,000 Active 38 DOM
-
2026-06-02days on market $80,000 Active 37 DOM
-
2026-06-01days on market $80,000 Active 36 DOM
-
2026-05-31days on market $80,000 Active 35 DOM
-
2026-04-26$80,000 Active 1058-char remark
-
2023-09-27soldstatus $140,000
-
1986-12-22soldstatus $444,000
ⓘ Source: listings_history table (triggers on properties + properties_extension) + one-shot
backfill from property_details.listing_events for pre-trigger history.
Tax reassessment forecast MD · Partial reset (capped growth)
- Current annual tax
- $1,057 · $88/mo
- Projected year-2 tax
- $1,057 · $88/mo
- Expected delta
- $0/yr ($0/mo · 0.0%)
ⓘ Screening estimate from a state-policy table — verify with the county assessor before closing.
Climate risk First Street
- Flood 1/10 Low FEMA zone X (unshaded) · 0% chance over 30 yrs
- Wildfire 1/10 Low
- Heat 7/10 Severe 7 d/yr ≥103°F today · 15 d/yr by 30 yrs out
- Wind 6/10 Major 27% chance of damaging wind over 30 yrs
- Air quality 4/10 Moderate 6 unhealthy d/yr today · 7 by 30 yrs out
Nearby sold comps map
Loading sold comps map…
Walkable amenities ~0.75 mi
Loading nearby amenities…
Taxation est. · year 1
- Rental income
- $23,302
- − Mortgage interest
- −$4,481
- − Property taxes
- −$1,057
- − Insurance
- −$400
- − Repairs & maintenance
- −$1,864
- − Management
- −$1,864
- − Depreciation
- −$2,327
- Taxable income
- $11,308
- Est. tax owed @ 24.0%
- −$2,714
- After-tax cash flow
- $9,203/yr
For passive investors: Depreciation is non-cash, so a rental often shows a tax loss while cash-flowing — sheltering income. Rental losses are passive: they offset passive income freely, and up to $25,000/yr can offset ordinary (W-2) income if you actively participate and your MAGI is under $100k (phasing out to $0 by $150k); unused losses carry forward. On sale, claimed depreciation is recaptured at up to 25%, and gains may owe capital-gains tax (a 1031 exchange can defer both). Figures are a year-1 estimate at your 24.0% rate — not tax advice; consult a CPA.
Schools (NCES district)
- District
- Baltimore City Public Schools
- NCES district ID
- 2400090
- Math proficiency
- 7% ▼ -9.00%
- Reading proficiency
- 16% ▼ -5.00%
- Median HH income
- $42,108
- Composite
- 10.08/100
- National rank
- #9805
- State rank
- #24 of 24 in MD
Livability — Baltimore
- Score
- 76/100
- State rank
- #90
- US rank
- #3396
Category grades
Schools grade is shown separately in the Schools card above.
Census & demographics
- Census place
- Baltimore, MD
- County
- Baltimore City · 558,601 people
- City population
- 588,727
- Metro
- Baltimore-Columbia-Towson, MD
- Population (ZIP)
- 28,058
- Household income
- $51,344
- Rent vs Own
- Severe rent burden
- 1868.0
Population outlook (Baltimore County) Hauer SSP2
- Today (2025)
- 624,249 people
- By 2030
- 621,541 · -0.4%
- By 2040
- 609,756 · -2.3%
- By 2050
- 597,249 · -4.3%
- By 2075
- 552,236 · -11.5%
- By 2100
- 513,934 · -17.7%
Race, ethnicity, and origin ACS 2023
- Neighborhood character
- Predominantly Black (86%)
- Race & ethnicity
- Black 86% White 6% Hispanic / Latino 4% Two or more races 3%
- Foreign-born
- 3% · Canada
- Languages at home
- 96% English-only · Spanish 3%
Political lean MEDSL · Baltimore
- 2024 margin
- Solid D (+73.0) · D 85.2% · R 12.2% · Other 2.6%
- 2008→2024 swing
- -2.5pp toward R · 2008: 75.5pp · 2024: 73.0pp
- All cycles
- 2024: D+73.0 2020: D+76.6 2016: D+74.6 2012: D+76.4 2008: D+75.5
Not yet ingested
- Civics
- —
Market trends
- HPI YoY
- ▼ -0.57%
- Current HPI
- 427.4453
- Rent YoY
- ▲ 5.25%
- Metro
- Baltimore-Columbia-Towson, MD
- State GDP YoY
- ▲ 2.97%
- F500 in state
- 12
Industry mix (Fortune 500 HQ in MD)
| Industry | F500 HQs | Revenue |
|---|---|---|
| Aerospace / Defense | 1 | $71B |
|
||
| Utilities | 1 | $25B |
|
||
| Hotels | 1 | $24B |
|
||
| Consumer Goods | 1 | $7B |
|
||
| Real Estate | 1 | $6B |
|
||
| Chemicals | 1 | $2B |
|
||
Price history
-82.0% since first listed3 events — show timeline
- 2026-04-26 Listed $80,000 BRIGHT MLS
- 2023-09-27 Sold (Public Records) $140,000 Public Records
- 1986-12-22 Sold (Public Records) $444,000 Public Records
Property tax history
+1.6%/yrLatest (2025): $1,057 · +0.0% YoY. Source: county tax records.
Cash-flow waterfall
monthlySold comps — $/sqft
last 12 mo · ≤1 miLoading sold comps…