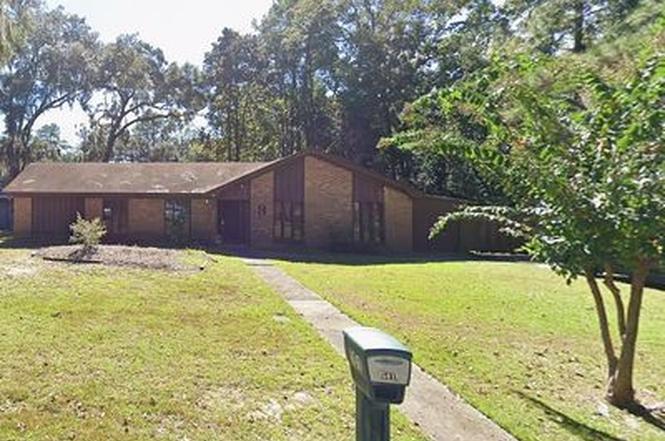
501 Beauregard St · Savannah, GA
Flood risk 1/10 · Minimal
- FEMA flood zone
- X (unshaded)
- Chance of flooding over 30 yrs
- 0.0%
- Est. flood insurance / yr
- $507 – $1,088
Fire risk 1/10 · Minimal
- Est. fire insurance / yr
- $963 – $1,789
Heat risk 10/10 · Severe
- Hot days now (above 106°F)
- 7 days/yr
- Hot days in 30 yrs
- 18 days/yr
Wind risk 9/10 · Severe
- Chance of severe wind over 30 yrs
- 99.0%
Air-quality risk 2/10 · Minimal
- Unhealthy air days now
- 2 days/yr
- Unhealthy air days in 30 yrs
- 2 days/yr
Risk factors via First Street. Map © Google.
Why this score? — see what drove the D+ grade
The composite is a weighted blend of 9 inputs, each scored 0–100. Each bar is that input's sub-score; the figure is the points it added to the 100-point composite (weight × sub-score).
- ARV discount +15.0/15.0
- Cash flow +12.7/30.0
- Livability +4.3/5.0
- DSCR +3.8/10.0
- 1% rule +2.7/10.0
- Condition / age +2.5/5.0
- Rent growth +2.3/5.0
- Schools +2.0/10.0
- Appreciation +0.0/10.0
$299,500
🖨 Deal sheet 📄 Offer letter ✓ Due diligence
Listing remarks
Project house and estate sale. Will need full gutting. Largest lot on the street and could be split into two lots. More pictures to come.
Key facts
- Built 1976
- Listed 8 days
Tags
Property features AI
Exterior
- Home design: Built in 1976
- Construction: Living area approximately 2317
- Exterior features: Located in the Oakdale subdivision
Neighborhood map
What this means for you Summary
Snapshot
- This is a 3-bed/2.0-bath single-family listed at $300k.
Deal economics
- At list price, monthly cash flow is $-35 ($-419/yr) — negative.
- To cash-flow at today's rent, offer at most $293k (2.1% below list).
- To meet the 1% rule (rent ≥ 1% of price), the offer needs to be $230k (23.3% below list).
- Recommended offer: $230k (23.3% below list) — sets the bar for 1% rule.
- Cap rate 6.2% vs local median 4.0% in Savannah — top-decile yield for the area; either an underpriced asset or a hidden risk that comps aren't pricing in. Stress-test before assuming the spread holds.
Location & tenants
- Location reads 86/100 on livability (#1 in GA, #397 nationally) — a professional / high-income tenant draw. Strengths: crime A+, amenities A+, commute A+; Watch: employment D, schools F.
- Savannah-Chatham County (urban): math 20% / reading 26% proficiency, ranked #134 of 174 in GA (top 77%) — low school quality limits family demand, transient renter base, plan for 1-2y turnover.
- Market conditions: Rents soft (-0.7%/yr); 268 active listings in the ZIP; 7 comparable units currently listed for rent nearby; rentals lingering (median 44d on market — plan ~5-8 weeks vacancy on turnover, expect pricing pressure); 71% of comp listings sitting > 30 days — soft ceiling on asking rent; 2,694 units permitted in Chatham County in 2024 (973 in 5+ unit buildings).
- This rent runs 42% of the median local income ($66k/yr) — at the standard rent-burdened threshold; future hikes will face affordability resistance.
Forward outlook
- Local home prices are declining (-3.0%/yr); year-one equity from $2k of loan paydown is wiped out by about $9k of value loss. Plan a longer hold.
- Chatham County population projected at +33% by 2050 — long-run rental-demand tailwind backs the buy-and-hold thesis.
Negotiation context
- Only 8 days on market — expect competitive offers; lowballing is unlikely to land.
- Current owner paid $46k; list at $300k implies a 558% gain — meaningful room to come down on a strong offer.
Risks & watch-outs
- Climate carrying-cost: severe wind risk, 99% chance of damaging wind over 30y; extreme-heat days projected 7→18/yr by 2055 (HVAC capex compounding) — expect insurance premiums to compound above CPI over the hold.
Questions for the listing agent
- What do current leases actually rent for vs. the listed asking? Can we see a recent rent roll and the last 12 months of T-12 income?
- Built in 1976 — when were the roof, HVAC, electrical panel, plumbing, and water heater last replaced?
- Is there a deadline driving the sale (1031 exchange, divorce, estate, relocation)? That informs how much negotiation room exists.
- Schools are F-rated, which usually means shorter tenancies and higher turnover. Who's the typical renter profile here, and what's been the actual vacancy rate?
- The area grade is low — what's the realistic commute time and amenity access for the typical tenant pool here? Any planned neighborhood developments (good or bad) we should know about?
- What's the average days-on-market for RENTAL listings here right now (not sales)? A rising rental-DOM trend means longer vacancies and softer asking-rent achievability than the comps imply.
- What's the recent tenant-quality profile in this submarket — average credit score on applications, eviction rate, late-payment / NSF rate, and stable-employment percentage? A property-management company in the area should have these aggregated.
- How much new for-sale + rental construction is in the pipeline within 1–3 miles? Heavy new supply typically softens prices + rents 12–24 months out; constrained supply supports both.
Investment metrics
- 1% rule
- 0.77% ✗
- Cap rate
- 6.15%
- Cash-on-cash
- -0.50%
- DSCR
- 0.98
- GRM
- 10.9
CMA / ARV
- ARV (on-the-fly)
- $569,982
- Comps found
- 12
Show comp detail 12 sales within ~0.75 mi
| Address | Dist | Beds/Ba | Sqft | Sold | Price | $/sf | Match |
|---|---|---|---|---|---|---|---|
| 515 Jackson Blvd | 0.06mi | 4/2.0 (+1) | 2,206 (-5%) | 13mo | $557,600 | $253 | 73 |
| 601 Jackson Blvd | 0.14mi | 3/2.0 | 2,087 (-10%) | 6mo | $489,900 | $235 | 72 |
| 1207 Bacon Park Dr | 0.59mi | 3/2.0 | 2,351 (+2%) | 4mo | $700,000 | $298 | 67 |
| 232 Groveland Cir | 0.65mi | 3/2.0 | 2,443 (+5%) | 4mo | $545,000 | $223 | 58 |
| 404 Mclaws St | 0.42mi | 3/2.5 | 2,128 (-8%) | 13mo | $620,700 | $292 | 54 |
| 516 Early St | 0.35mi | 3/2.0 | 1,989 (-14%) | 8mo | $475,000 | $239 | 53 |
| 1 Jackson Ct | 0.37mi | 4/2.5 (+1) | 2,048 (-12%) | 8mo | $450,000 | $220 | 50 |
| 1202 Brightwood Dr | 0.62mi | 3/2.5 | 2,179 (-6%) | 15mo | $535,000 | $246 | 47 |
| 7304 Van Buren Ave | 0.61mi | 4/3.0 (+1) | 2,454 (+6%) | 14mo | $265,000 | $108 | 41 |
| 306 Stuart St | 0.29mi | 4/3.5 (+1) | 2,603 (+12%) | 20mo | $800,000 | $307 | 38 |
| 1216 Brightwood Dr | 0.73mi | 4/2.0 (+1) | 2,216 (-4%) | 21mo | $660,000 | $298 | 36 |
| 7308 Van Buren Ave | 0.65mi | 3/3.0 | 1,994 (-14%) | 9mo | $250,000 | $125 | 34 |
Match score weights: distance 35% · size 25% · config 20% · recency 20%. Top-matched comps best support the ARV.
Projected returns pro-forma
-3.0% appreciation · 0.0% rent growth · sell at horizon
- IRR
- -20.2%
- Equity multiple
- 0.31×
- Total profit
- $-57,592
- Equity at exit
- $44,656
- IRR
- -20.6%
- Equity multiple
- 0.05×
- Total profit
- $-79,446
- Equity at exit
- $25,895
Cash invested: $83,860 (down + closing). Projections, not guarantees.
Landlord ↔ Tenant lean methodology
- Overall (STATE)
- 90 Strongly Landlord-Friendly
- State Georgia
- 90 Strongly Landlord-Friendly · R+3
- County
- — inherits STATE
- City
- — inherits STATE
ZIP-level market 31405
- Home prices YoY
- -32.4%
- Rents YoY
- -0.7%
- Active inventory
- 268
- Price-to-rent
- 10.9×
Monthly cashflow live
- Estimated rent
- $2,298 high interval (Pro) →
- Mortgage (P&I)
- −$1,571
- Tax from tax record
- −$155 /mo · $1,857/yr
- Insurance
- −$125
- HOA
- −$0
- Vacancy / Maint / Mgmt
- −$483
- Net cashflow
- $-35
Break-even live
UW: 25.0% down · 7.5% · 30yr · 1.5% tax · 5.0% vac · 8.0% maint · 8.0% mgmt
Financing live
Cash to close
- Down payment
- $74,875
- Closing costs
- $8,985
- Reserves months
- —
- Total cash needed
- —
Loan-product check · same deal, 3 products live
Conventional
25% down · 7.5% · 30yr
- Down + closing
- —
- Monthly P&I
- —
- Monthly cashflow
- —
- DSCR
- —
- Eligible?
- —
Personal DTI + credit; lowest rate.
DSCR
20% down · 8.5% · 30yr
- Down + closing
- —
- Monthly P&I
- —
- Monthly cashflow
- —
- DSCR
- —
- Eligible?
- —
No personal income docs; deal must DSCR.
Hard money
10% down · 12.0% · 12mo
- Down + closing
- —
- Monthly P&I
- —
- Monthly cashflow
- —
- DSCR
- —
- Eligible?
- —
Short-term bridge; refi at stabilization.
Rent comps 7 comps
| Address | Beds | Baths | Sqft | Rent | $/sqft | DOM | Units | Dist |
|---|---|---|---|---|---|---|---|---|
| 606 McLaws St Savannah, GA | 4.0 | 2.0 | 1997 | $2,595 | $1.30 | 43d | 1 | 0.40mi |
| 6803 Waters Ave Ph 05 Savannah, GA | 4.0 | 2.0 | 1680 | $2,150 | $1.28 | 43d | 1 | 0.41mi |
| 5525 Waters Dr Savannah, GA | 4.0 | 2.0 | 2543 | $2,295 | $0.90 | 43d | 1 | 0.58mi |
| 130 Andover Dr Savannah, GA | 3.0 | 2.0 | 1642 | $2,300 | $1.40 | 13d | 1 | 0.74mi |
| 5416 Waters Dr Savannah, GA | 3.0 | 1.0 | 1723 | $2,000 | $1.16 | 23d | 1 | 0.77mi |
| 206 Brandywine Rd Savannah, GA | 4.0 | 2.0 | 1691 | $3,100 | $1.83 | 43d | 1 | 1.16mi |
| 5 Berkley Pl Savannah, GA | 2.0 | 2.0 | 1706 | $2,175 | $1.27 | 43d | 1 | 1.23mi |
Listing history 7 events
-
2026-06-18days on market $299,500 Active 8 DOM
-
2026-06-17days on market $299,500 Active 7 DOM
-
2026-06-16days on market $299,500 Active 6 DOM
-
2026-06-15days on market $299,500 Active 5 DOM
-
2026-06-14days on market $299,500 Active 3 DOM
-
2026-06-13remarks 137-char remark
-
2026-06-13$299,500 Active 2 DOM
ⓘ Source: listings_history table (triggers on properties + properties_extension) + one-shot
backfill from property_details.listing_events for pre-trigger history.
Tax reassessment forecast GA · Resets to sale price
- Current annual tax
- $1,857 · $155/mo
- Projected year-2 tax
- $2,755 · $230/mo
- Expected delta
- +$899/yr (+$75/mo · 48.4%)
ⓘ Screening estimate from a state-policy table — verify with the county assessor before closing.
Climate risk First Street
- Flood 1/10 Low FEMA zone X (unshaded) · 0% chance over 30 yrs
- Wildfire 1/10 Low
- Heat 10/10 Extreme 7 d/yr ≥106°F today · 18 d/yr by 30 yrs out
- Wind 9/10 Extreme 99% chance of damaging wind over 30 yrs
- Air quality 2/10 Low 2 unhealthy d/yr today · 2 by 30 yrs out
Nearby sold comps map
Loading sold comps map…
Walkable amenities ~0.75 mi
Loading nearby amenities…
Taxation est. · year 1
- Rental income
- $27,573
- − Mortgage interest
- −$16,777
- − Property taxes
- −$1,857
- − Insurance
- −$1,498
- − Repairs & maintenance
- −$2,206
- − Management
- −$2,206
- − Depreciation
- −$8,713
- Taxable loss
- −$5,683
- Est. tax savings @ 24.0%
- +$1,364
- After-tax cash flow
- $945/yr
For passive investors: Depreciation is non-cash, so a rental often shows a tax loss while cash-flowing — sheltering income. Rental losses are passive: they offset passive income freely, and up to $25,000/yr can offset ordinary (W-2) income if you actively participate and your MAGI is under $100k (phasing out to $0 by $150k); unused losses carry forward. On sale, claimed depreciation is recaptured at up to 25%, and gains may owe capital-gains tax (a 1031 exchange can defer both). Figures are a year-1 estimate at your 24.0% rate — not tax advice; consult a CPA.
Schools (NCES district)
- District
- Savannah-Chatham County
- NCES district ID
- 1301020
- Math proficiency
- 20% ▼ -11.00%
- Reading proficiency
- 26% ▼ -5.00%
- Median HH income
- $47,443
- Composite
- 20.14/100
- National rank
- #8639
- State rank
- #134 of 174 in GA
Livability — Savannah
- Score
- 86/100
- State rank
- #1
- US rank
- #397
Category grades
Schools grade is shown separately in the Schools card above.
Census & demographics
- Census place
- Savannah, GA
- County
- Chatham County · 271,602 people
- City population
- 216,564
- Metro
- Savannah, GA
- Population (ZIP)
- 40,764
- Household income
- $65,710
- Rent vs Own
- Severe rent burden
- 1712.0
Population outlook (Chatham County) Hauer SSP2
- Today (2025)
- 332,584 people
- By 2030
- 355,508 · +6.9%
- By 2040
- 400,030 · +20.3%
- By 2050
- 443,019 · +33.2%
- By 2075
- 534,579 · +60.7%
- By 2100
- 583,863 · +75.6%
Race, ethnicity, and origin ACS 2023
- Neighborhood character
- Diverse neighborhood (Simpson 0.63)
- Race & ethnicity
- Black 47% White 38% Hispanic / Latino 8% Two or more races 6% Asian 3%
- Hispanic origin (detail)
- Mexican 3% Puerto Rican 1%
- Common ancestry
- Italian 1% Slovak 1% Romanian 1%
- Foreign-born
- 7% · Canada, China, Jamaica
- Languages at home
- 88% English-only · Spanish 6% Other Indo-European 2% Chinese 1%
Political lean MEDSL · Chatham
- 2024 margin
- D (+18.0) · D 58.6% · R 40.6%
- 2008→2024 swing
- +3.6pp toward D · 2008: 14.4pp · 2024: 18.0pp
- All cycles
- 2024: D+18.0 2020: D+18.8 2016: D+14.5 2012: D+12.0 2008: D+14.4
Not yet ingested
- Civics
- —
Market trends
- HPI YoY
- ▼ -147.33%
- Current HPI
- 307.4442
- Rent YoY
- ▼ -0.66%
- Metro
- Savannah, GA
- State GDP YoY
- ▲ 2.66%
- F500 in state
- 28
Industry mix (Fortune 500 HQ in GA)
| Industry | F500 HQs | Revenue |
|---|---|---|
| Paper / Packaging | 2 | $29B |
|
||
| Retail | 1 | $160B |
|
||
| Transportation / Logistics | 1 | $91B |
|
||
| Airlines | 1 | $62B |
|
||
| Consumer Goods | 1 | $47B |
|
||
| Utilities | 1 | $25B |
|
||
Price history
+558.2% since first listed2 events — show timeline
- 2026-06-11 Listed $299,500 FSBO.com
- 1976-12-01 Sold (Public Records) $45,500 Public Records
Property tax history
+3.3%/yrLatest (2025): $1,857 · -0.6% YoY. Source: county tax records.
Cash-flow waterfall
monthlySold comps — $/sqft
last 12 mo · ≤1 miLoading sold comps…