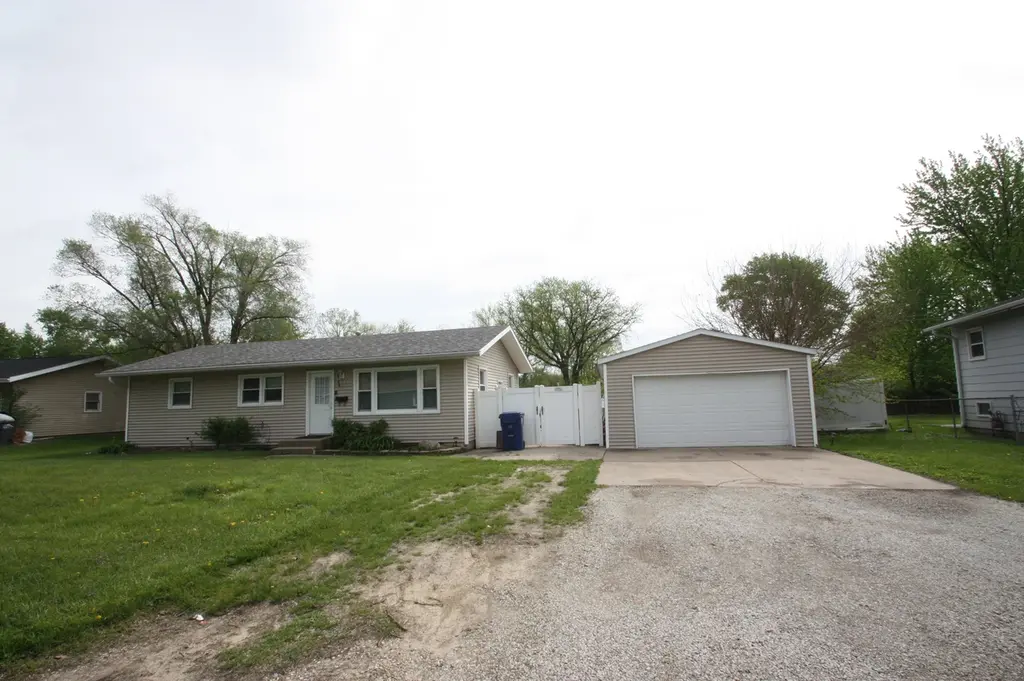
2607 Crestview Dr · Bettendorf, IA
Flood risk 8/10 · Major
- FEMA flood zone
- AE
- Chance of flooding over 30 yrs
- 0.99%
- Est. flood insurance / yr
- $2,026 – $9,024
Fire risk 1/10 · Minimal
- Est. fire insurance / yr
- $902 – $1,676
Heat risk 3/10 · Minor
- Hot days now (above 103°F)
- 7 days/yr
- Hot days in 30 yrs
- 16 days/yr
Wind risk 2/10 · Minimal
- Chance of severe wind over 30 yrs
- —
Air-quality risk 3/10 · Minor
- Unhealthy air days now
- 2 days/yr
- Unhealthy air days in 30 yrs
- 3 days/yr
Risk factors via First Street. Map © Google.
Why this score? — see what drove the B- grade
The composite is a weighted blend of 9 inputs, each scored 0–100. Each bar is that input's sub-score; the figure is the points it added to the 100-point composite (weight × sub-score).
- Cash flow +22.8/30.0
- ARV discount +15.0/15.0
- DSCR +7.3/10.0
- Schools +6.5/10.0
- 1% rule +6.1/10.0
- Livability +4.0/5.0
- Rent growth +3.2/5.0
- Condition / age +2.5/5.0
- Appreciation +0.0/10.0
$160,000
🖨 Deal sheet 📄 Offer letter ✓ Due diligence
Listing remarks
priced well below assessed value. 3 bedroom 1 bath with a detached 2 car garage. new roof in 2021. Fenced in privacy backyard with slider door to backyard. Nice patio. Hardwood floors. Additional utility room in basement. Seller is Licensed Real Estate Agent in IA/IL.
Key facts
- Patio
- New roof
- Hardwood floors
Tags
Property features AI
Finance
- HOA & community: No master association fees required
Exterior
- Parking: Detached garage (owned), concrete surfaces; Total of 2 parking spaces and 2 garage spaces
- Utilities: Public water; Public sewer
- Home design: Detached single-family home; One-story layout; Fee simple ownership; Property currently leased
- Construction: Built approximately 61–70 years ago; Vinyl siding; Asphalt roof; Block foundation
- Exterior features: Patio; Fenced yard; Level lot
Interior
- Kitchen: Range; Dishwasher; Refrigerator; Ceramic tile flooring in kitchen
- Bedrooms: Master bedroom on main level (11 x 12) with carpet; Bedroom on main level (9 x 11) with carpet; Bedroom on main level (9 x 10) with carpet
- Flooring: Hardwood in living room; Carpet in bedrooms and master; Ceramic tile in dining room and kitchen
- Bathrooms: One full bathroom
- Heating & cooling: Natural gas forced-air heating; Central air conditioning
- Interior features: Six total rooms; Partially finished, full basement; School bus service available; Flood zone (partial)
- Laundry & utility: Basement laundry (8 x 6)
Neighborhood map
What this means for you Summary
Snapshot
- This is a 3-bed/1.5-bath single-family listed at $160k.
Deal economics
- At list price, monthly cash flow is $-183 ($-2k/yr) — negative.
- To cash-flow at today's rent, offer at most $128k (20.2% below list).
- Meets the 1% rule at list price ($2k rent vs $160k).
- Recommended offer: $128k (20.2% below list) — sets the bar for cash-flow.
- Cap rate 8.4% vs local median 3.0% in Bettendorf — top-decile yield for the area; either an underpriced asset or a hidden risk that comps aren't pricing in. Stress-test before assuming the spread holds.
Location & tenants
- Location reads 81/100 on livability (#73 in IA, #1,579 nationally) — a professional / high-income tenant draw. Strengths: crime A+, employment A+, housing A+; Watch: amenities F, commute F.
- Bettendorf Community School District (suburban): math 74% / reading 75% proficiency, ranked #57 of 289 in IA (top 20%) — strong family-tenant draw, lease renewals of 3-5y typical.
- Zoned schools: Bettendorf High School (math 71% / reading 77%, grade B+, #103 of 336 statewide, top 32%, 1,482 students, 31% FRL).
- Market conditions: Rents rising (+2.9%/yr); 426 active listings in the ZIP; 7 comparable units currently listed for rent nearby; rentals at typical pace (median 21d on market — plan ~3-4 weeks tenant-placement turnaround); solid renter incomes; 805 units permitted in Scott County in 2024 (479 in 5+ unit buildings).
Forward outlook
- Local home prices are declining (-3.0%/yr); year-one equity from $1k of loan paydown is wiped out by about $5k of value loss. Plan a longer hold.
- Scott County population projected at +19% by 2050 — long-run rental-demand tailwind backs the buy-and-hold thesis.
Negotiation context
- Only 11 days on market — expect competitive offers; lowballing is unlikely to land.
- 8 sale attempts since 18y ago; this cycle's ask has dropped $10k (6%) from the opening price — seller is motivated, your offer sets the floor, not the list.
- Current owner paid $120k; 34% above their basis — modest negotiation headroom, anchor on the comps not their cost.
Risks & watch-outs
- Watch-outs: flood insurance adds $460/mo.
- Climate carrying-cost: in FEMA flood zone AE (mandatory federal flood insurance) — expect insurance premiums to compound above CPI over the hold.
Questions for the listing agent
- What do current leases actually rent for vs. the listed asking? Can we see a recent rent roll and the last 12 months of T-12 income?
- Built in 1961 — when were the roof, HVAC, electrical panel, plumbing, and water heater last replaced?
- What's the actual annual flood-insurance premium (NFIP or private), and is the property in a SFHA with mandatory coverage?
- Is there a deadline driving the sale (1031 exchange, divorce, estate, relocation)? That informs how much negotiation room exists.
- Schools are A-rated — typically a magnet for longer-tenancy family renters. What's the average tenant stay here, and is there a school-zone premium baked into asking?
- What's the average days-on-market for RENTAL listings here right now (not sales)? A rising rental-DOM trend means longer vacancies and softer asking-rent achievability than the comps imply.
- What's the recent tenant-quality profile in this submarket — average credit score on applications, eviction rate, late-payment / NSF rate, and stable-employment percentage? A property-management company in the area should have these aggregated.
- How much new for-sale + rental construction is in the pipeline within 1–3 miles? Heavy new supply typically softens prices + rents 12–24 months out; constrained supply supports both.
Investment metrics
- 1% rule
- 1.11% ✓
- Cap rate
- 8.38%
- Cash-on-cash
- 7.44%
- DSCR
- 1.33
- GRM
- 7.5
CMA / ARV
- ARV (median comp)
- $197,358
- List price
- $160,000
- Delta
- -18.93%
- Verdict
- UNDERPRICED
- Comps
- 20 within 1.0 mi
Show comp detail 12 sales within ~0.75 mi
| Address | Dist | Beds/Ba | Sqft | Sold | Price | $/sf | Match |
|---|---|---|---|---|---|---|---|
| 2909 Linden Ln | 0.33mi | 3/1.5 | 1,554 (-0%) | 1mo | $310,000 | $199 | 83 |
| 3206 Magnolia Ct | 0.40mi | 3/1.5 | 1,603 (+3%) | 1mo | $224,000 | $140 | 76 |
| 1006 Hillside Dr | 0.12mi | 4/2.0 (+1) | 1,388 (-11%) | 1mo | $237,500 | $171 | 68 |
| 1325 Hillside Dr | 0.21mi | 3/2.0 | 1,355 (-13%) | 1mo | $235,000 | $173 | 66 |
| 3302 Greenbrier Dr | 0.64mi | 3/2.0 | 1,520 (-2%) | 1mo | $225,000 | $148 | 63 |
| 1520 Parklane Dr Dr | 0.70mi | 3/1.5 | 1,536 (-1%) | 3mo | $289,900 | $189 | 63 |
| 60 Parklane Cir | 0.60mi | 3/1.0 | 1,599 (+3%) | 6mo | $238,000 | $149 | 61 |
| 2822 S Hampton Dr | 0.62mi | 4/1.5 (+1) | 1,460 (-6%) | 4mo | $215,000 | $147 | 52 |
| 2328 Salem Ct | 0.42mi | 4/3.0 (+1) | 1,413 (-9%) | 4mo | $352,000 | $249 | 51 |
| 2620 Harmony Dr Dr | 0.40mi | 4/3.0 (+1) | 1,705 (+9%) | 6mo | $356,000 | $209 | 50 |
| 1446 Lakewood Dr | 0.74mi | 3/1.5 | 1,392 (-11%) | 2mo | $228,000 | $164 | 46 |
| 2408 Avalon Dr | 0.46mi | 4/2.0 (+1) | 1,790 (+15%) | 5mo | $202,000 | $113 | 42 |
Match score weights: distance 35% · size 25% · config 20% · recency 20%. Top-matched comps best support the ARV.
Projected returns pro-forma
-3.0% appreciation · 2.88% rent growth · sell at horizon
- IRR
- -24.5%
- Equity multiple
- 0.16×
- Total profit
- $-37,460
- Equity at exit
- $23,857
- IRR
- -19.8%
- Equity multiple
- -0.05×
- Total profit
- $-47,182
- Equity at exit
- $13,834
Cash invested: $44,800 (down + closing). Projections, not guarantees.
Landlord ↔ Tenant lean methodology
- Overall (STATE)
- 83 Strongly Landlord-Friendly
- State Iowa
- 83 Strongly Landlord-Friendly · R+6
- County
- — inherits STATE
- City
- — inherits STATE
ZIP-level market 52722
- Rents YoY
- 2.9%
- Active inventory
- 426
- Price-to-rent
- 7.5×
Monthly cashflow live
- Estimated rent
- $1,772 high interval (Pro) →
- Mortgage (P&I)
- −$839
- Tax from tax record
- −$217 /mo · $2,601/yr
- Insurance
- −$67
- Flood insurance flood zone
- −$460 /mo · $5,525/yr
- HOA
- −$0
- Vacancy / Maint / Mgmt
- −$372
- Net cashflow
- $-183
Break-even live
UW: 25.0% down · 7.5% · 30yr · 1.5% tax · 5.0% vac · 8.0% maint · 8.0% mgmt
Financing live
Cash to close
- Down payment
- $40,000
- Closing costs
- $4,800
- Reserves months
- —
- Total cash needed
- —
Loan-product check · same deal, 3 products live
Conventional
25% down · 7.5% · 30yr
- Down + closing
- —
- Monthly P&I
- —
- Monthly cashflow
- —
- DSCR
- —
- Eligible?
- —
Personal DTI + credit; lowest rate.
DSCR
20% down · 8.5% · 30yr
- Down + closing
- —
- Monthly P&I
- —
- Monthly cashflow
- —
- DSCR
- —
- Eligible?
- —
No personal income docs; deal must DSCR.
Hard money
10% down · 12.0% · 12mo
- Down + closing
- —
- Monthly P&I
- —
- Monthly cashflow
- —
- DSCR
- —
- Eligible?
- —
Short-term bridge; refi at stabilization.
Rent comps 7 comps
| Address | Beds | Baths | Sqft | Rent | $/sqft | DOM | Units | Dist |
|---|---|---|---|---|---|---|---|---|
| 2339 Hawthorne Ct Bettendorf, IA | 3.0 | 1.0 | 1375 | $1,695 | $1.23 | 43d | 1 | 0.23mi |
| 1410 Golden Valley Dr Bettendorf, IA | 3.0 | 1.0 | 1100 | $1,800 | $1.64 | 20d | 1 | 0.49mi |
| 3300 E Kimberly Rd Davenport, IA | 1.0–3.0 | 1.0–2.0 | 924 | $1,295 | $1.40 | 13d | 22 | 0.58mi |
| 3129 Windsor Dr Bettendorf, IA | 4.0 | 1.5 | 1440 | $2,500 | $1.74 | 20d | 1 | 0.69mi |
| 1414 Central Ave Bettendorf, IA | 3.0 | 2.0 | 1295 | $1,995 | $1.54 | 43d | 1 | 1.22mi |
| 2900 Middle Rd Bettendorf, IA | 1.0–3.0 | 1.0–2.0 | 996 | $1,741 | $1.75 | 13d | 27 | 1.38mi |
| 3816 Ridgewood Dr Davenport, IA | 3.0 | 2.0 | 1550 | $2,199 | $1.42 | 13d | 1 | 1.45mi |
Listing history 20 events
-
2026-05-15$170,000 Active 270-char remark
-
2026-05-08historical
-
2026-04-30Active
-
2021-08-06historical
-
2015-09-09soldstatus $119,500
-
2015-09-04soldstatus $119,500
-
2015-09-04soldstatus $119,500
-
2015-04-01$118,500
-
2015-04-01$118,500
-
2009-05-12soldstatus $105,500
-
2009-05-08soldstatus $105,500
-
2009-05-08soldstatus $105,500
-
2009-04-10$109,900
-
2009-04-10$109,900
-
2009-02-02soldstatus $56,559
-
2009-02-02soldstatus $56,559
-
2008-12-03$71,500
-
2008-12-03$71,500
-
2008-12-03historical
-
2005-10-06soldstatus $99,500
ⓘ Source: listings_history table (triggers on properties + properties_extension) + one-shot
backfill from property_details.listing_events for pre-trigger history.
Tax reassessment forecast IA · Partial reset (capped growth)
- Current annual tax
- $2,601 · $217/mo
- Projected year-2 tax
- $2,601 · $217/mo
- Expected delta
- $0/yr ($0/mo · 0.0%)
ⓘ Screening estimate from a state-policy table — verify with the county assessor before closing.
Climate risk First Street
- Flood 8/10 Severe FEMA zone AE · 99% chance over 30 yrs
- Wildfire 1/10 Low
- Heat 3/10 Moderate 7 d/yr ≥103°F today · 16 d/yr by 30 yrs out
- Wind 2/10 Low
- Air quality 3/10 Moderate 2 unhealthy d/yr today · 3 by 30 yrs out
Nearby sold comps map
Loading sold comps map…
Walkable amenities ~0.75 mi
Loading nearby amenities…
Taxation est. · year 1
- Rental income
- $21,268
- − Mortgage interest
- −$8,962
- − Property taxes
- −$2,601
- − Insurance
- −$6,325
- − Repairs & maintenance
- −$1,701
- − Management
- −$1,701
- − Depreciation
- −$4,655
- Taxable loss
- −$4,678
- Est. tax savings @ 24.0%
- +$1,123
- After-tax cash flow
- $-1,070/yr
For passive investors: Depreciation is non-cash, so a rental often shows a tax loss while cash-flowing — sheltering income. Rental losses are passive: they offset passive income freely, and up to $25,000/yr can offset ordinary (W-2) income if you actively participate and your MAGI is under $100k (phasing out to $0 by $150k); unused losses carry forward. On sale, claimed depreciation is recaptured at up to 25%, and gains may owe capital-gains tax (a 1031 exchange can defer both). Figures are a year-1 estimate at your 24.0% rate — not tax advice; consult a CPA.
Schools (NCES district)
- District
- Bettendorf Community School District
- NCES district ID
- 1904860
- Math proficiency
- 74% ▼ -6.00%
- Reading proficiency
- 75% ▼ -2.00%
- Median HH income
- $66,823
- Composite
- 64.71/100
- National rank
- #522
- State rank
- #57 of 289 in IA
Livability — Bettendorf
- Score
- 81/100
- State rank
- #73
- US rank
- #1579
Category grades
Schools grade is shown separately in the Schools card above.
Census & demographics
- Census place
- Bettendorf, IA
- County
- Scott County · 144,583 people
- City population
- 41,264
- Metro
- Davenport-Moline-Rock Island, IA-IL
- Population (ZIP)
- 41,264
- Household income
- $101,546
- Rent vs Own
- Severe rent burden
- 935.0
Population outlook (Scott County) Hauer SSP2
- Today (2025)
- 188,878 people
- By 2030
- 196,648 · +4.1%
- By 2040
- 210,860 · +11.6%
- By 2050
- 224,359 · +18.8%
- By 2075
- 258,884 · +37.1%
- By 2100
- 286,447 · +51.7%
Race, ethnicity, and origin ACS 2023
- Neighborhood character
- Predominantly White (82%)
- Race & ethnicity
- White 82% Asian 7% Two or more races 7% Hispanic / Latino 5% Black 2%
- Common ancestry
- Portuguese 3% Italian 3% Romanian 2%
- Foreign-born
- 7% · Canada, China, Vietnam
- Languages at home
- 92% English-only · Other Asian/Pacific 2% Spanish 2% Other Indo-European 1%
Political lean MEDSL · Scott
- 2024 margin
- Toss-up / Even · D 47.3% · R 51.2% · Other 1.4%
- 2008→2024 swing
- -18.4pp toward R · 2008: 14.6pp · 2024: -3.9pp
- All cycles
- 2024: R+3.9 2020: D+3.5 2016: D+1.4 2012: D+13.8 2008: D+14.6
Not yet ingested
- Civics
- —
Market trends
- HPI YoY
- ▼ -111.45%
- Current HPI
- 194.8355
- Rent YoY
- ▲ 2.88%
- Metro
- Davenport-Moline-Rock Island, IA-IL
- State GDP YoY
- ▲ 2.48%
- F500 in state
- 4
Industry mix (Fortune 500 HQ in IA)
| Industry | F500 HQs | Revenue |
|---|---|---|
| Financial Services | 1 | $16B |
|
||
| Retail / Convenience | 1 | $15B |
|
||
Price history
+60.8% since first listed22 events — show timeline
- 2026-05-26 Pending — MRED as Distributed by MLS Grid
- 2026-05-20 Price Changed $160,000 MRED as Distributed by MLS Grid
- 2026-05-15 Listed $170,000 MRED as Distributed by MLS Grid
- 2026-05-08 Listing Removed — MRED as Distributed by MLS Grid
- 2026-04-30 Listed — MRED as Distributed by MLS Grid
- 2021-08-06 Listing Removed — RMLSA as Distributed by MLS Grid
- 2015-09-09 Sold (Public Records) $119,500 Public Records
- 2015-09-04 Sold (MLS) $119,500 MRED as Distributed by MLS Grid
- 2015-09-04 Sold (MLS) $119,500 RMLSA as Distributed by MLS Grid
- 2015-04-01 Listed $118,500 MRED as Distributed by MLS Grid
- 2015-04-01 Listed $118,500 RMLSA as Distributed by MLS Grid
- 2009-05-12 Sold (Public Records) $105,500 Public Records
- 2009-05-08 Sold (MLS) $105,500 MRED as Distributed by MLS Grid
- 2009-05-08 Sold (MLS) $105,500 RMLSA as Distributed by MLS Grid
- 2009-04-10 Listed $109,900 MRED as Distributed by MLS Grid
- 2009-04-10 Listed $109,900 RMLSA as Distributed by MLS Grid
- 2009-02-02 Sold (MLS) $56,559 MRED as Distributed by MLS Grid
- 2009-02-02 Sold (MLS) $56,559 RMLSA as Distributed by MLS Grid
- 2008-12-03 Listing Removed — MRED as Distributed by MLS Grid
- 2008-12-03 Listed $71,500 MRED as Distributed by MLS Grid
- 2008-12-03 Listed $71,500 RMLSA as Distributed by MLS Grid
- 2005-10-06 Sold (Public Records) $99,500 Public Records
Property tax history
+3.5%/yrLatest (2025): $2,601 · -1.0% YoY. Source: county tax records.
Cash-flow waterfall
monthlySold comps — $/sqft
last 12 mo · ≤1 miLoading sold comps…