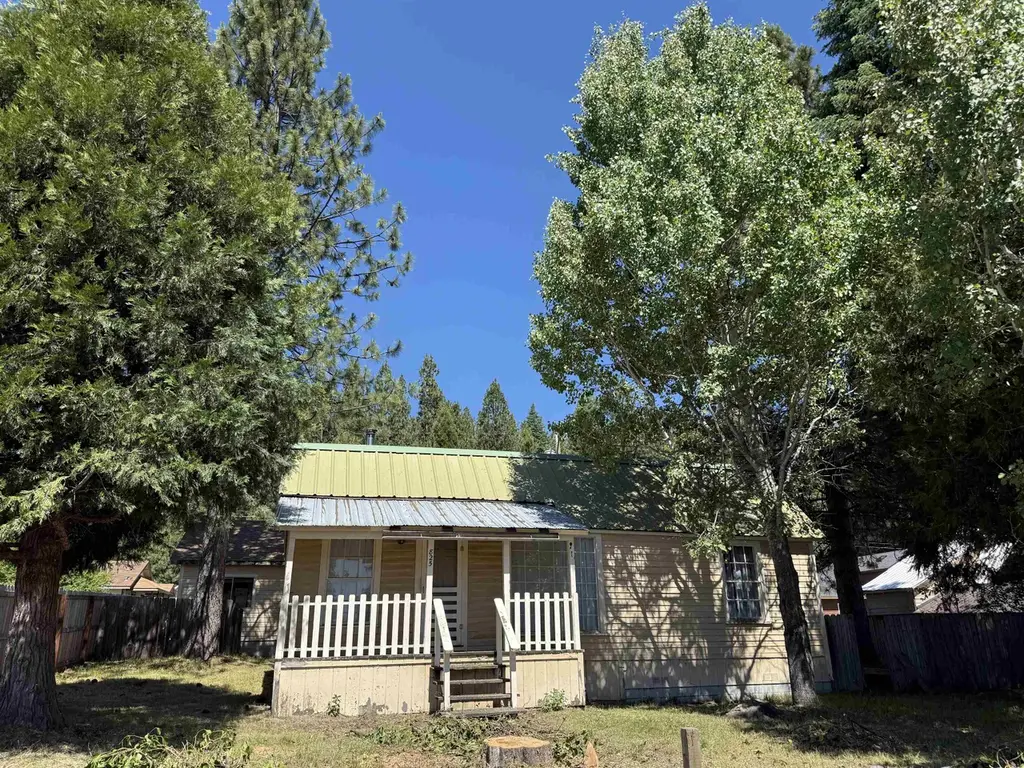
825 Oak St · McCloud, CA
Flood risk 6/10 · Moderate
- FEMA flood zone
- AO
- Chance of flooding over 30 yrs
- 0.71%
- Est. flood insurance / yr
- $848 – $2,087
Fire risk 7/10 · Major
- Est. fire insurance / yr
- $659 – $1,223
Heat risk 4/10 · Minor
- Hot days now (above 94°F)
- 8 days/yr
- Hot days in 30 yrs
- 21 days/yr
Wind risk 1/10 · Minimal
- Chance of severe wind over 30 yrs
- —
Air-quality risk 10/10 · Severe
- Unhealthy air days now
- 30 days/yr
- Unhealthy air days in 30 yrs
- 31 days/yr
Risk factors via First Street. Map © Google.
Why this score? — see what drove the B grade
The composite is a weighted blend of 9 inputs, each scored 0–100. Each bar is that input's sub-score; the figure is the points it added to the 100-point composite (weight × sub-score).
- Cash flow +25.9/30.0
- Appreciation +10.0/10.0
- DSCR +8.7/10.0
- ARV discount +7.5/15.0
- 1% rule +6.9/10.0
- Schools +3.6/10.0
- Livability +3.0/5.0
- Rent growth +2.5/5.0
- Condition / age +2.5/5.0
$165,000
🖨 Deal sheet 📄 Offer letter ✓ Due diligence
Listing remarks
Charming one-bedroom, one-bath cottage with a cozy loft nestled among mature trees on a lovely yard — a rare find in the historic logging town of McCloud, California! This character-filled home features a warm wood stove, perfect for those crisp mountain evenings in the shadow of Mt. Shasta. A detached newer garage adds convenience and extra storage or workspace. Bring your vision and your tools — this is a fantastic opportunity for investors or handy buyers looking to add instant equity. Steeped in history and surrounded by natural beauty, this fixer-upper won’t last long. Don’t miss your chance to own a piece of Northern California’s rich logging heritage!
Key facts
- Warm wood stove
- Cozy loft
- Natural beauty
Tags
Property features AI
Exterior
- Parking: Gravel parking; Detached garage with 1 space
- Utilities: Public water; Septic tank sewer; Propane available
- Home design: Single-family residence; One story; Residential zoning (R-1)
- Construction: Wood siding; Metal roof
- Exterior features: Level lot; Irregular lot dimensions; Workshop on property
Interior
- Kitchen: Electric range; Refrigerator
- Flooring: Carpet; Vinyl
- Heating & cooling: Wood stove heating
- Interior features: Living room fireplace
Neighborhood map
What this means for you Summary
Snapshot
- This is a 1-bed/1.0-bath single-family listed at $165k.
Deal economics
- At list price, monthly cash flow is $283 ($3k/yr) — positive.
- The deal already cash-flows at list — no discount required.
- Meets the 1% rule at list price ($2k rent vs $165k).
Location & tenants
- Location reads 59/100 on livability (#636 in CA) — a working-class tenant base; expect higher turnover. Strengths: health & safety A+, housing B+; Watch: crime F, amenities F, commute F.
- Siskiyou Union High (rural): math 25% / reading 55% proficiency, ranked #763 of 1,400 in CA (top 54%) — families likely to look elsewhere, expect single-tenant / working-renter base with shorter leases; only 12% free/reduced lunch — higher-income household profile.
- Market conditions: 135 active listings in the ZIP; 50 units permitted in Siskiyou County in 2024 (0 in 5+ unit buildings).
Forward outlook
- In year one you build about $18k of equity ($1k loan paydown + $16k appreciation (10.0% local appreciation)).
- Siskiyou County population projected at -26% by 2050 — secular population decline; favor cash flow + early exit over multi-decade hold.
- At projected returns (10.0% appreciation + 3.0% rent growth), your $46k cash investment doubles in ~3 years — after that, you're playing with house money.
- By year 3, paydown + projected appreciation supports a ~$45k cash-out refi (75% LTV) — recoverable capital for the next deal without selling this one.
Negotiation context
- Only 3 days on market — expect competitive offers; lowballing is unlikely to land.
Risks & watch-outs
- Watch-outs: flood insurance adds $122/mo; built in 1920 — expect roof / HVAC / electrical / plumbing capex.
- Climate carrying-cost: in FEMA flood zone AO (mandatory federal flood insurance); major wildfire risk — expect insurance premiums to compound above CPI over the hold.
Questions for the listing agent
- Built in 1920 — when were the roof, HVAC, electrical panel, plumbing, and water heater last replaced?
- What's the actual annual flood-insurance premium (NFIP or private), and is the property in a SFHA with mandatory coverage?
- Is there a deadline driving the sale (1031 exchange, divorce, estate, relocation)? That informs how much negotiation room exists.
- Crime grade is F in this area — have there been break-ins, vandalism, or insurance claims at this property in the last 3 years? What carrier currently insures it and at what premium?
- What's the average days-on-market for RENTAL listings here right now (not sales)? A rising rental-DOM trend means longer vacancies and softer asking-rent achievability than the comps imply.
- What's the recent tenant-quality profile in this submarket — average credit score on applications, eviction rate, late-payment / NSF rate, and stable-employment percentage? A property-management company in the area should have these aggregated.
- How much new for-sale + rental construction is in the pipeline within 1–3 miles? Heavy new supply typically softens prices + rents 12–24 months out; constrained supply supports both.
Investment metrics
- 1% rule
- 1.19% ✓
- Cap rate
- 9.24%
- Cash-on-cash
- 10.52%
- DSCR
- 1.47
- GRM
- 7.0
CMA / ARV
No comps found within radius.
Projected returns pro-forma
10.0% appreciation · 3.0% rent growth · sell at horizon
- IRR
- 29.6%
- Equity multiple
- 3.34×
- Total profit
- $107,982
- Equity at exit
- $148,645
- IRR
- 25.7%
- Equity multiple
- 7.58×
- Total profit
- $304,052
- Equity at exit
- $320,559
Cash invested: $46,200 (down + closing). Projections, not guarantees.
Landlord ↔ Tenant lean methodology
- Overall (STATE)
- 18 Strongly Tenant-Friendly
- State California
- 18 Strongly Tenant-Friendly · D+13
- County
- — inherits STATE
- City
- — inherits STATE
ZIP-level market 96057
- Active inventory
- 135
- Price-to-rent
- 7.0×
Monthly cashflow live
- Estimated rent
- $1,971 medium interval (Pro) →
- Mortgage (P&I)
- −$865
- Tax from tax record
- −$218 /mo · $2,619/yr
- Insurance
- −$69
- Flood insurance flood zone
- −$122 /mo · $1,468/yr
- HOA
- −$0
- Vacancy / Maint / Mgmt
- −$414
- Net cashflow
- $283
Break-even live
UW: 25.0% down · 7.5% · 30yr · 1.5% tax · 5.0% vac · 8.0% maint · 8.0% mgmt
Financing live
Cash to close
- Down payment
- $41,250
- Closing costs
- $4,950
- Reserves months
- —
- Total cash needed
- —
Loan-product check · same deal, 3 products live
Conventional
25% down · 7.5% · 30yr
- Down + closing
- —
- Monthly P&I
- —
- Monthly cashflow
- —
- DSCR
- —
- Eligible?
- —
Personal DTI + credit; lowest rate.
DSCR
20% down · 8.5% · 30yr
- Down + closing
- —
- Monthly P&I
- —
- Monthly cashflow
- —
- DSCR
- —
- Eligible?
- —
No personal income docs; deal must DSCR.
Hard money
10% down · 12.0% · 12mo
- Down + closing
- —
- Monthly P&I
- —
- Monthly cashflow
- —
- DSCR
- —
- Eligible?
- —
Short-term bridge; refi at stabilization.
Listing history 4 events
-
2026-06-16status $165,000 Pending 3 DOM
-
2026-06-15days on market $165,000 Active 3 DOM
-
2026-06-13remarks 666-char remark
-
2026-06-13$165,000 Active 1 DOM
ⓘ Source: listings_history table (triggers on properties + properties_extension) + one-shot
backfill from property_details.listing_events for pre-trigger history.
Tax reassessment forecast CA · Resets to sale price
- Current annual tax
- $2,619 · $218/mo
- Projected year-2 tax
- $2,619 · $218/mo
- Expected delta
- $0/yr ($0/mo · 0.0%)
ⓘ Screening estimate from a state-policy table — verify with the county assessor before closing.
Climate risk First Street
- Flood 6/10 Major FEMA zone AO · 71% chance over 30 yrs
- Wildfire 7/10 Severe
- Heat 4/10 Moderate 8 d/yr ≥94°F today · 21 d/yr by 30 yrs out
- Wind 1/10 Low
- Air quality 10/10 Extreme 30 unhealthy d/yr today · 31 by 30 yrs out
Nearby sold comps map
Loading sold comps map…
Walkable amenities ~0.75 mi
Loading nearby amenities…
Taxation est. · year 1
- Rental income
- $23,655
- − Mortgage interest
- −$9,243
- − Property taxes
- −$2,619
- − Insurance
- −$2,292
- − Repairs & maintenance
- −$1,892
- − Management
- −$1,892
- − Depreciation
- −$4,800
- Taxable income
- $916
- Est. tax owed @ 24.0%
- −$220
- After-tax cash flow
- $3,173/yr
For passive investors: Depreciation is non-cash, so a rental often shows a tax loss while cash-flowing — sheltering income. Rental losses are passive: they offset passive income freely, and up to $25,000/yr can offset ordinary (W-2) income if you actively participate and your MAGI is under $100k (phasing out to $0 by $150k); unused losses carry forward. On sale, claimed depreciation is recaptured at up to 25%, and gains may owe capital-gains tax (a 1031 exchange can defer both). Figures are a year-1 estimate at your 24.0% rate — not tax advice; consult a CPA.
Schools (NCES district)
- District
- Siskiyou Union High
- NCES district ID
- 0636940
- Math proficiency
- 25% ▲ 5.00%
- Reading proficiency
- 55% ▲ 5.00%
- Median HH income
- $39,293
- Composite
- 35.84/100
- National rank
- #9605
- State rank
- #763 of 1400 in CA
Livability — McCloud
- Score
- 59/100
- State rank
- #636
- US rank
- #20040
Category grades
Schools grade is shown separately in the Schools card above.
Census & demographics
- Census place
- McCloud, CA
- Population (ZIP)
- 1,076
Population outlook (Siskiyou County) Hauer SSP2
- Today (2025)
- 39,337 people
- By 2030
- 36,930 · -6.1%
- By 2040
- 32,367 · -17.7%
- By 2050
- 29,030 · -26.2%
- By 2075
- 23,534 · -40.2%
- By 2100
- 19,312 · -50.9%
Race, ethnicity, and origin ACS 2023
- Neighborhood character
- Predominantly White (79%)
- Race & ethnicity
- White 79% Two or more races 13% Hispanic / Latino 6% Native American 3% Asian 1%
- Hispanic origin (detail)
- Mexican 5%
- Common ancestry
- Russian 6% Slovak 5% Lithuanian 3%
- Foreign-born
- 5% · Canada
- Languages at home
- 96% English-only · German/W. Germanic 1% Other Asian/Pacific 1% Spanish 1%
Political lean MEDSL · Siskiyou
- 2024 margin
- R (+19.2) · D 38.8% · R 58.0% · Other 3.2%
- 2008→2024 swing
- -8.8pp toward R · 2008: -10.4pp · 2024: -19.2pp
- All cycles
- 2024: R+19.2 2020: R+15.8 2016: R+20.7 2012: R+15.6 2008: R+10.4
Not yet ingested
- Civics
- —
Market trends
- HPI YoY
- ▲ 147.64%
- Current HPI
- 490.68
- Rent YoY
- —
- Metro
- —
- State GDP YoY
- ▲ 3.21%
- F500 in state
- 116
Industry mix (Fortune 500 HQ in CA)
| Industry | F500 HQs | Revenue |
|---|---|---|
| Technology | 27 | $1,492B |
|
||
| Financial Services | 3 | $174B |
|
||
| Retail | 3 | $44B |
|
||
| Insurance | 3 | $26B |
|
||
| Media / Entertainment | 2 | $115B |
|
||
| Pharmaceuticals / Biotech | 2 | $62B |
|
||
Price history
+3.8% since first listed2 events — show timeline
- 2026-06-12 Listed $165,000 SMLS
- 2004-10-01 Sold (Public Records) $159,000 Public Records
Property tax history
+5.5%/yrLatest (2025): $2,619 · +1.5% YoY. Source: county tax records.
Cash-flow waterfall
monthlySold comps — $/sqft
last 12 mo · ≤1 miLoading sold comps…