197 Jens Dr · San Antonio, TX
Flood risk No data
- FEMA flood zone
- —
- Chance of flooding over 30 yrs
- —
- Est. flood insurance / yr
- —
Fire risk No data
- Est. fire insurance / yr
- —
Heat risk No data
- Hot days now (above threshold)
- —
- Hot days in 30 yrs
- —
Wind risk No data
- Chance of severe wind over 30 yrs
- —
Air-quality risk No data
- Unhealthy air days now
- —
- Unhealthy air days in 30 yrs
- —
Risk factors via First Street. Map © Google.
Why this score? — see what drove the D+ grade
The composite is a weighted blend of 9 inputs, each scored 0–100. Each bar is that input's sub-score; the figure is the points it added to the 100-point composite (weight × sub-score).
- ARV discount +12.7/15.0
- Cash flow +8.7/30.0
- Appreciation +5.0/10.0
- Schools +4.4/10.0
- Livability +4.0/5.0
- Condition / age +4.0/5.0
- 1% rule +2.7/10.0
- Rent growth +2.5/5.0
- DSCR +2.4/10.0
$369,305
🖨 Deal sheet (PDF) 📄 Offer letter ✓ Due diligence
Listing remarks
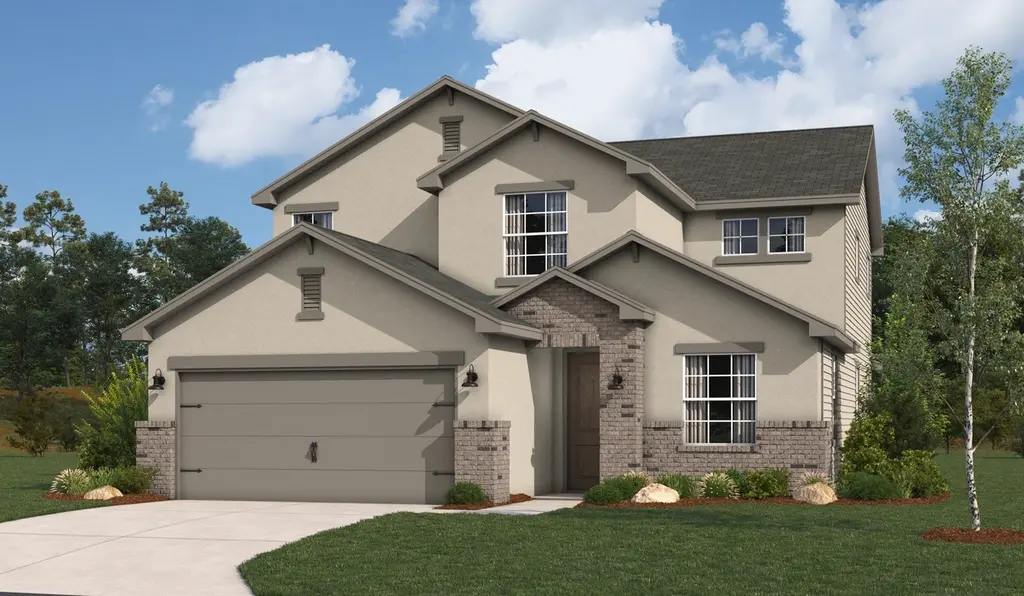
The Bandera is a thoughtfully designed two-story home offering 4 to 6 bedrooms, 2.5 to 3 bathrooms, and 2,440 square feet of well-balanced living space. An open-concept layout connects the kitchen, dining, and living areas, anchored by a gourmet kitchen that supports both everyday living and entertaining. The great room is enhanced by a dramatic 18' ceiling with an open-to-above design, creating a strong sense of space and natural light. The primary suite is conveniently located on the main level, offering added privacy and featuring a bathroom with dual vanities and a walk-in shower. Upstairs, additional bedrooms are complemented by a versatile loft space, while a flex room on the first fl
Key facts
- 2 garage spots
- Built 2026
- Listed 17 days
Property features AI
Finance
- Financial info: Listing price: $365,213
Exterior
- Parking: 2-car garage (2 total parking spaces)
- Home design: Single-family residence
- Exterior features: Living area approximately 2,440
Interior
- Bedrooms: 5 bedrooms
- Bathrooms: 3 full bathrooms
- Interior features: Spec home (new construction, Plan: Bandera)
Neighborhood map
What this means for you Summary
Snapshot
- This is a 5-bed/3.0-bath single-family listed at $369k. Condition is rated good.
Deal economics
- At list price, monthly cash flow is $-312 ($-4k/yr) — negative.
- To cash-flow at today's rent, offer at most $324k (12.2% below list).
- To meet the 1% rule (rent ≥ 1% of price), the offer needs to be $284k (23.2% below list).
- Recommended offer: $284k (23.2% below list) — sets the bar for 1% rule.
- Cap rate 5.3% vs local median 3.8% in San Antonio — top-decile yield for the area; either an underpriced asset or a hidden risk that comps aren't pricing in. Stress-test before assuming the spread holds.
Location & tenants
- Location reads 80/100 on livability (#31 in TX, #1,616 nationally) — a professional / high-income tenant draw. Strengths: amenities A+, commute A+, cost of living A+; Watch: crime F.
- Medina Valley ISD (rural): math 48% / reading 53% proficiency, ranked #148 of 826 in TX (top 18%) — acceptable for families but not a draw, mixed tenant base, ~2y average lease.
- Zoned schools: Potranco El (math 50% / reading 51%, grade D+, #833 of 4,322 statewide, top 20%, 847 students, 47% FRL); Medina Valley Middle (math 47% / reading 49%, grade C-, #400 of 1,662 statewide, top 24%, 1,029 students, 62% FRL); Medina Valley H S (math 34% / reading 55%, grade F, #652 of 1,632 statewide, top 43%, 2,147 students, 51% FRL) — zoned schools at 53% FRL track the district average.
- Market conditions: 141 active listings in the ZIP; 102 units permitted in Medina County in 2024 (0 in 5+ unit buildings).
Forward outlook
- In year one you build about $3k of equity ($3k loan paydown + $151 appreciation (0.0% local appreciation)).
- Medina County population projected at +24% by 2050 — long-run rental-demand tailwind backs the buy-and-hold thesis.
- By year 9, paydown + projected appreciation supports a ~$33k cash-out refi (75% LTV) — recoverable capital for the next deal without selling this one.
Negotiation context
- It's been on market 18 days — a 2% lower offer ($364k) is reasonable based on typical stale-listing flexibility.
Questions for the listing agent
- What do current leases actually rent for vs. the listed asking? Can we see a recent rent roll and the last 12 months of T-12 income?
- Is there a deadline driving the sale (1031 exchange, divorce, estate, relocation)? That informs how much negotiation room exists.
- Crime grade is F in this area — have there been break-ins, vandalism, or insurance claims at this property in the last 3 years? What carrier currently insures it and at what premium?
- The area grade is low — what's the realistic commute time and amenity access for the typical tenant pool here? Any planned neighborhood developments (good or bad) we should know about?
- What's the average days-on-market for RENTAL listings here right now (not sales)? A rising rental-DOM trend means longer vacancies and softer asking-rent achievability than the comps imply.
- What's the recent tenant-quality profile in this submarket — average credit score on applications, eviction rate, late-payment / NSF rate, and stable-employment percentage? A property-management company in the area should have these aggregated.
- How much new for-sale + rental construction is in the pipeline within 1–3 miles? Heavy new supply typically softens prices + rents 12–24 months out; constrained supply supports both.
Investment metrics
- 1% rule
- 0.77% ✗
- Cap rate
- 5.28%
- Cash-on-cash
- -3.63%
- DSCR
- 0.84
- GRM
- 10.9
CMA / ARV
- ARV (on-the-fly)
- $417,240
- Comps found
- 1
Show comp detail 1 sale within ~0.75 mi
| Address | Dist | Beds/Ba | Sqft | Sold | Price | $/sf | Match |
|---|---|---|---|---|---|---|---|
| 165 Hazel Way | 0.34mi | 4/3.0 (-1) | 2,575 (+6%) | 1mo | $439,990 | $171 | 69 |
Match score weights: distance 35% · size 25% · config 20% · recency 20%. Top-matched comps best support the ARV.
Projected returns pro-forma
0.04% appreciation · 3.0% rent growth · sell at horizon
- IRR
- -6.2%
- Equity multiple
- 0.71×
- Total profit
- $-29,946
- Equity at exit
- $107,993
- IRR
- -0.2%
- Equity multiple
- 0.98×
- Total profit
- $-2,268
- Equity at exit
- $130,418
Cash invested: $103,405 (down + closing). Projections, not guarantees.
Landlord ↔ Tenant lean methodology
- Overall (STATE)
- 87 Strongly Landlord-Friendly
- State Texas
- 87 Strongly Landlord-Friendly · R+5
- County
- — inherits STATE
- City
- — inherits STATE
ZIP-level market 78056
- Home prices YoY
- 0.0%
- Active inventory
- 141
- Price-to-rent
- 10.9×
Monthly cashflow live
- Estimated rent
- $2,835 medium interval (Pro) →
- Mortgage (P&I)
- −$1,937
- Tax est. 1.5%
- −$462 /mo · $5,540/yr
- Insurance
- −$154
- HOA
- −$0
- Vacancy / Maint / Mgmt
- −$595
- Net cashflow
- $-312
Break-even live
Sensitivity live
| Price | -10% $-57 | -5% $-185 | +0% $-312 | +5% $-440 | +10% $-568 |
|---|---|---|---|---|---|
| Rent | -10% $-536 | -5% $-424 | +0% $-312 | +5% $-200 | +10% $-88 |
| Rate | -1.0pp $-126 | -0.5pp $-218 | base $-312 | +0.5pp $-408 | +1.0pp $-505 |
UW: 25.0% down · 7.5% · 30yr · 1.5% tax · 5.0% vac · 8.0% maint · 8.0% mgmt
Financing live
Cash to close
- Down payment
- $92,326
- Closing costs
- $11,079
- Reserves months
- —
- Total cash needed
- —
Loan-product check · same deal, 3 products live
Conventional
25% down · 7.5% · 30yr
- Down + closing
- —
- Monthly P&I
- —
- Monthly cashflow
- —
- DSCR
- —
- Eligible?
- —
Personal DTI + credit; lowest rate.
DSCR
20% down · 8.5% · 30yr
- Down + closing
- —
- Monthly P&I
- —
- Monthly cashflow
- —
- DSCR
- —
- Eligible?
- —
No personal income docs; deal must DSCR.
Hard money
10% down · 12.0% · 12mo
- Down + closing
- —
- Monthly P&I
- —
- Monthly cashflow
- —
- DSCR
- —
- Eligible?
- —
Short-term bridge; refi at stabilization.
Listing history 11 events
-
2026-06-21days on market $369,305 Active 18 DOM
-
2026-06-18days on market $369,305 Active 15 DOM
-
2026-06-17days on market $369,305 Active 14 DOM
-
2026-06-16days on market $369,305 Active 13 DOM
-
2026-06-15days on market $369,305 Active 12 DOM
-
2026-06-13days on market $369,305 Active 10 DOM
-
2026-06-09days on market $369,305 Active 6 DOM
-
2026-06-08days on market $369,305 Active 5 DOM
-
2026-06-07days on market $369,305 Active 4 DOM
-
2026-06-04remarks 699-char remark
-
2026-06-04$369,305 Active 1 DOM
ⓘ Source: listings_history table (triggers on properties + properties_extension) + one-shot
backfill from property_details.listing_events for pre-trigger history.
Nearby sold comps map
Loading sold comps map…
Walkable amenities ~0.75 mi
Loading nearby amenities…
Taxation est. · year 1
- Rental income
- $34,022
- − Mortgage interest
- −$20,687
- − Property taxes
- −$5,540
- − Insurance
- −$1,847
- − Repairs & maintenance
- −$2,722
- − Management
- −$2,722
- − Depreciation
- −$10,743
- Taxable loss
- −$10,238
- Est. tax savings @ 24.0%
- +$2,457
- After-tax cash flow
- $-1,292/yr
For passive investors: Depreciation is non-cash, so a rental often shows a tax loss while cash-flowing — sheltering income. Rental losses are passive: they offset passive income freely, and up to $25,000/yr can offset ordinary (W-2) income if you actively participate and your MAGI is under $100k (phasing out to $0 by $150k); unused losses carry forward. On sale, claimed depreciation is recaptured at up to 25%, and gains may owe capital-gains tax (a 1031 exchange can defer both). Figures are a year-1 estimate at your 24.0% rate — not tax advice; consult a CPA.
Condition & rehab AI · 13 photos
This two-story home is in good condition with a modern design and well-maintained interior and exterior. It is ready for immediate occupancy and has potential for further value through cosmetic updates.
Value-add opportunities
- Resale Paint exterior siding — Fresh paint can enhance curb appeal and property value.
- Rental Clean gutters — Clean gutters improve drainage and reduce maintenance costs for tenants.
Renovation cost estimate screening
Value-add ROI direction
- Resale Paint exterior siding — Fresh paint can enhance curb appeal and property value. ↑
- Rental Clean gutters — Clean gutters improve drainage and reduce maintenance costs for tenants. ↑
ⓘ Cost ranges are severity-bucket heuristics (US national rule-of-thumb). Get contractor quotes + a written scope before underwriting a rehab budget.
Schools (NCES district)
- District
- Medina Valley ISD
- NCES district ID
- 4830060
- Math proficiency
- 48% ▼ -9.00%
- Reading proficiency
- 53% ▼ -2.00%
- Median HH income
- $60,596
- Composite
- 44.2/100
- National rank
- #2851
- State rank
- #148 of 826 in TX
Livability — San Antonio
- Score
- 80/100
- State rank
- #31
- US rank
- #1616
Category grades
Schools grade is shown separately in the Schools card above.
Census & demographics
- City population
- 1,806,925
- Population (ZIP)
- 2,431
Population outlook (Medina County) Hauer SSP2
- Today (2025)
- 54,332 people
- By 2030
- 57,250 · +5.4%
- By 2040
- 62,563 · +15.1%
- By 2050
- 67,386 · +24.0%
- By 2075
- 79,538 · +46.4%
- By 2100
- 84,624 · +55.8%
Race, ethnicity, and origin ACS 2023
- Neighborhood character
- Predominantly White (66%)
- Race & ethnicity
- White 66% Hispanic / Latino 27% Two or more races 15% Native American 1%
- Hispanic origin (detail)
- Mexican 24%
- Common ancestry
- Romanian 13% Lithuanian 7% Scottish 6%
- Foreign-born
- 8% · Canada
- Languages at home
- 86% English-only · Spanish 11% French/Haitian/Cajun 1%
Political lean MEDSL · Medina
- 2024 margin
- Solid R (+42.8) · D 28.2% · R 71.0%
- 2008→2024 swing
- -8.9pp toward R · 2008: -33.9pp · 2024: -42.8pp
- All cycles
- 2024: R+42.8 2020: R+39.2 2016: R+43.2 2012: R+39.2 2008: R+33.9
Not yet ingested
- Civics
- —
Market trends
- HPI YoY
- ▬ 0.04%
- Current HPI
- 219.5947
- Rent YoY
- —
- Metro
- —
- State GDP YoY
- ▲ 3.95%
- F500 in state
- 110
Industry mix (Fortune 500 HQ in TX)
| Industry | F500 HQs | Revenue |
|---|---|---|
| Energy | 16 | $1,198B |
|
||
| Technology | 5 | $198B |
|
||
| Engineering / Construction | 4 | $72B |
|
||
| Energy Services | 3 | $60B |
|
||
| Utilities | 3 | $41B |
|
||
| Healthcare | 2 | $330B |
|
||
Cash-flow waterfall
monthlySold comps — $/sqft
last 12 mo · ≤1 miLoading sold comps…