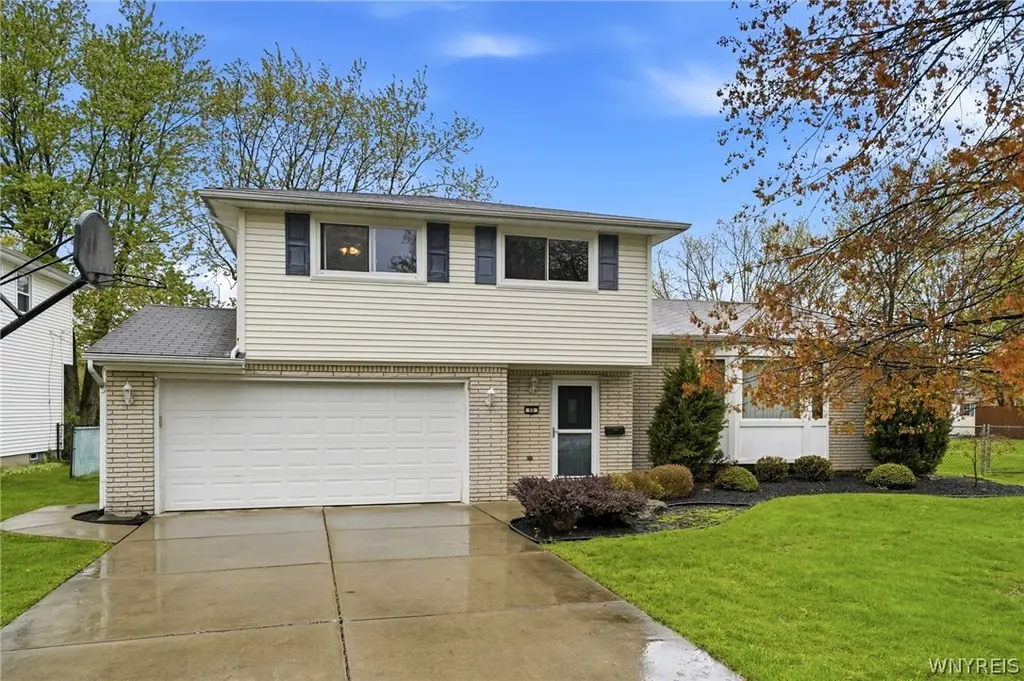
86 Tartan Ln · Williamsville, NY
Flood risk 1/10 · Minimal
- FEMA flood zone
- X (unshaded)
- Chance of flooding over 30 yrs
- 0.0%
- Est. flood insurance / yr
- $473 – $860
Fire risk 1/10 · Minimal
- Est. fire insurance / yr
- $691 – $1,283
Heat risk 2/10 · Minimal
- Hot days now (above 94°F)
- 7 days/yr
- Hot days in 30 yrs
- 15 days/yr
Wind risk 1/10 · Minimal
- Chance of severe wind over 30 yrs
- —
Air-quality risk 2/10 · Minimal
- Unhealthy air days now
- 2 days/yr
- Unhealthy air days in 30 yrs
- 2 days/yr
Risk factors via First Street. Map © Google.
Why this score? — see what drove the D grade
The composite is a weighted blend of 9 inputs, each scored 0–100. Each bar is that input's sub-score; the figure is the points it added to the 100-point composite (weight × sub-score).
- ARV discount +15.0/15.0
- Cash flow +7.0/30.0
- Schools +6.3/10.0
- Livability +4.2/5.0
- Rent growth +3.8/5.0
- Condition / age +2.5/5.0
- 1% rule +2.0/10.0
- DSCR +1.2/10.0
- Appreciation +0.0/10.0
$439,900
🖨 Deal sheet 📄 Offer letter ✓ Due diligence
Listing remarks
This clean and meticulously maintained home is nestled in a wonderful neighborhood, perfectly situated near top-rated schools and convenient shopping. Ideal for comfortable living and effortless entertaining, it offers low-maintenance features throughout. Step inside to beautiful hardwood flooring in the living room, dining room, and upper hallway, complemented by elegant white ceramic tile in the foyer. The modern kitchen is a standout, featuring stainless steel appliances, sleek granite countertops, and a convenient overlook into the oversized family room below. The spacious family room impresses with dramatic vaulted ceilings, a centrally located wood-burning fireplace, and abundant natu
Key facts
- Hardwood flooring
- Top rated schools
- Ceramic tile
Tags
Property features AI
Exterior
- Parking: Attached garage with garage door opener; 2 garage spaces
- Utilities: Electricity connected (circuit breakers); Public water connected; Sewer connected; High-speed internet available
- Home design: Two-story house; Existing (previously built) property; Rectangular residential lot; Road frontage on a city street
- Construction: Brick and frame construction with vinyl siding; Asphalt roof; Copper plumbing; Poured foundation; Below-grade finished area
- Exterior features: Concrete driveway; Deck; Fully fenced yard; Shed(s) / storage
Interior
- Kitchen: Free-standing range; Gas oven; Gas range; Oven; Range hood; Exhaust fan; Disposal; Granite countertops; Eat-in kitchen layout
- Bedrooms: Bedroom 1 (Second level) — approx. 15 x 13; Bedroom 2 (Second level) — approx. 11 x 14; Bedroom 3 (Second level) — approx. 11 x 10
- Flooring: Hardwood; Ceramic tile; Carpet; Vinyl; Varied flooring types
- Bathrooms: 1 full bathroom; 1 half bathroom; Main level has 1 bathroom
- Heating & cooling: Forced air heating (gas and electric); Central air conditioning
- Interior features: Ceiling fans; Cathedral ceilings; Formal dining room; Entrance foyer; Eat-in kitchen; Formal living room; Granite counters; Country-style kitchen; Partial finished basement with sump pump; Fireplace (1)
- Laundry & utility: Gas water heater
Neighborhood map
What this means for you Summary
Snapshot
- This is a 3-bed/1.5-bath single-family listed at $440k.
Deal economics
- At list price, monthly cash flow is $-654 ($-8k/yr) — negative.
- To cash-flow at today's rent, offer at most $324k (26.3% below list).
- To meet the 1% rule (rent ≥ 1% of price), the offer needs to be $308k (29.9% below list).
- Recommended offer: $308k (29.9% below list) — sets the bar for 1% rule.
- Cap rate 4.5% vs local median 3.5% in Williamsville — meaningfully above typical; check what's discounted (condition, days-on-market, listing class) to confirm the premium yield is real.
Location & tenants
- Location reads 84/100 on livability (#44 in NY, #693 nationally) — a professional / high-income tenant draw. Strengths: schools A+, commute A+, employment A+.
- Williamsville Central School District (suburban): math 64% / reading 77% proficiency, ranked #114 of 590 in NY (top 19%) — strong family-tenant draw, lease renewals of 3-5y typical; only 10% free/reduced lunch — higher-income household profile.
- Market conditions: Rents rising fast (+5.0%/yr); 329 active listings in the ZIP; 2 comparable units currently listed for rent nearby; solid renter incomes; 1,244 units permitted in Erie County in 2024 (563 in 5+ unit buildings).
- This rent runs 36% of the median local income ($102k/yr) — at the standard rent-burdened threshold; future hikes will face affordability resistance.
Forward outlook
- Local home prices are declining (-3.0%/yr); year-one equity from $3k of loan paydown is wiped out by about $13k of value loss. Plan a longer hold.
Negotiation context
- It's been on market 17 days — a 2% lower offer ($433k) is reasonable based on typical stale-listing flexibility.
Questions for the listing agent
- What do current leases actually rent for vs. the listed asking? Can we see a recent rent roll and the last 12 months of T-12 income?
- Built in 1966 — when were the roof, HVAC, electrical panel, plumbing, and water heater last replaced?
- Is there a deadline driving the sale (1031 exchange, divorce, estate, relocation)? That informs how much negotiation room exists.
- Schools are A-rated — typically a magnet for longer-tenancy family renters. What's the average tenant stay here, and is there a school-zone premium baked into asking?
- The area grade is low — what's the realistic commute time and amenity access for the typical tenant pool here? Any planned neighborhood developments (good or bad) we should know about?
- What's the average days-on-market for RENTAL listings here right now (not sales)? A rising rental-DOM trend means longer vacancies and softer asking-rent achievability than the comps imply.
- What's the recent tenant-quality profile in this submarket — average credit score on applications, eviction rate, late-payment / NSF rate, and stable-employment percentage? A property-management company in the area should have these aggregated.
- How much new for-sale + rental construction is in the pipeline within 1–3 miles? Heavy new supply typically softens prices + rents 12–24 months out; constrained supply supports both.
Investment metrics
- 1% rule
- 0.70% ✗
- Cap rate
- 4.51%
- Cash-on-cash
- -6.38%
- DSCR
- 0.72
- GRM
- 11.9
CMA / ARV
- ARV (median comp)
- $546,726
- List price
- $439,900
- Delta
- -19.54%
- Verdict
- UNDERPRICED
- Comps
- 20 within 1.0 mi
Show comp detail 12 sales within ~0.75 mi
| Address | Dist | Beds/Ba | Sqft | Sold | Price | $/sf | Match |
|---|---|---|---|---|---|---|---|
| 292 Oakbrook Dr | 0.30mi | 3/2.5 | 1,807 (-6%) | 8mo | $425,018 | $235 | 65 |
| 85 Mahogany Dr | 0.57mi | 3/1.5 | 1,993 (+3%) | 4mo | $420,000 | $211 | 64 |
| 145 Ponderosa Dr | 0.54mi | 4/1.5 (+1) | 1,887 (-2%) | 11mo | $392,000 | $208 | 57 |
| 118 Ponderosa Dr | 0.61mi | 4/1.5 (+1) | 1,919 (-0%) | 13mo | $425,000 | $221 | 55 |
| 41 Kings Trl | 0.10mi | 4/2.5 (+1) | 2,168 (+12%) | 13mo | $500,000 | $231 | 55 |
| 169 Chestnut Hill Ln S | 0.21mi | 4/2.5 (+1) | 2,208 (+14%) | 11mo | $565,000 | $256 | 48 |
| 217 Brush Creek Rd | 0.69mi | 4/2.5 (+1) | 2,020 (+5%) | 12mo | $475,000 | $235 | 41 |
| 287 Clearfield Dr | 0.56mi | 4/3.0 (+1) | 2,065 (+7%) | 12mo | $450,000 | $218 | 41 |
| 22 Plaza Dr | 0.56mi | 4/2.0 (+1) | 2,142 (+11%) | 10mo | $440,000 | $205 | 40 |
| 10 Macarthur Dr | 0.72mi | 4/2.5 (+1) | 2,035 (+6%) | 11mo | $454,000 | $223 | 39 |
| 73 Treebrooke Ct | 0.71mi | 4/2.5 (+1) | 2,116 (+10%) | 6mo | $350,000 | $165 | 37 |
| 130 Cottonwood Dr | 0.68mi | 4/2.5 (+1) | 2,123 (+10%) | 11mo | $411,000 | $194 | 33 |
Match score weights: distance 35% · size 25% · config 20% · recency 20%. Top-matched comps best support the ARV.
Projected returns pro-forma
-3.0% appreciation · 5.01% rent growth · sell at horizon
- IRR
- -25.0%
- Equity multiple
- 0.14×
- Total profit
- $-106,529
- Equity at exit
- $65,591
- IRR
- -15.8%
- Equity multiple
- 0.03×
- Total profit
- $-118,939
- Equity at exit
- $38,035
Cash invested: $123,172 (down + closing). Projections, not guarantees.
Landlord ↔ Tenant lean methodology
- Overall (STATE)
- 15 Strongly Tenant-Friendly
- State New York
- 15 Strongly Tenant-Friendly · D+10
- County
- — inherits STATE
- City
- — inherits STATE
ZIP-level market 14221
- Rents YoY
- 5.0%
- Active inventory
- 329
- Price-to-rent
- 11.9×
Monthly cashflow live
- Estimated rent
- $3,082 medium interval (Pro) →
- Mortgage (P&I)
- −$2,307
- Tax from tax record
- −$599 /mo · $7,188/yr
- Insurance
- −$183
- HOA
- −$0
- Vacancy / Maint / Mgmt
- −$647
- Net cashflow
- $-654
Break-even live
UW: 25.0% down · 7.5% · 30yr · 1.5% tax · 5.0% vac · 8.0% maint · 8.0% mgmt
Financing live
Cash to close
- Down payment
- $109,975
- Closing costs
- $13,197
- Reserves months
- —
- Total cash needed
- —
Loan-product check · same deal, 3 products live
Conventional
25% down · 7.5% · 30yr
- Down + closing
- —
- Monthly P&I
- —
- Monthly cashflow
- —
- DSCR
- —
- Eligible?
- —
Personal DTI + credit; lowest rate.
DSCR
20% down · 8.5% · 30yr
- Down + closing
- —
- Monthly P&I
- —
- Monthly cashflow
- —
- DSCR
- —
- Eligible?
- —
No personal income docs; deal must DSCR.
Hard money
10% down · 12.0% · 12mo
- Down + closing
- —
- Monthly P&I
- —
- Monthly cashflow
- —
- DSCR
- —
- Eligible?
- —
Short-term bridge; refi at stabilization.
Rent comps 2 comps
| Address | Beds | Baths | Sqft | Rent | $/sqft | DOM | Units | Dist |
|---|---|---|---|---|---|---|---|---|
| 15 Telfair Dr Buffalo, NY | 4.0 | 2.5 | 1976 | $4,250 | $2.15 | 3d | 1 | 0.94mi |
| 116 Segsbury Rd Buffalo, NY | 3.0 | 2.0 | 1488 | $2,950 | $1.98 | 23d | 1 | 0.97mi |
Listing history 4 events
-
2026-06-02status $439,900 Pending 17 DOM
-
2026-06-01days on market $439,900 Active 17 DOM
-
2026-05-31days on market $439,900 Active 16 DOM
-
2026-05-14$439,900 Active 1292-char remark
ⓘ Source: listings_history table (triggers on properties + properties_extension) + one-shot
backfill from property_details.listing_events for pre-trigger history.
Tax reassessment forecast NY · Partial reset (capped growth)
- Current annual tax
- $7,188 · $599/mo
- Projected year-2 tax
- $7,311 · $609/mo
- Expected delta
- +$123/yr (+$10/mo · 1.7%)
ⓘ Screening estimate from a state-policy table — verify with the county assessor before closing.
Climate risk First Street
- Flood 1/10 Low FEMA zone X (unshaded) · 0% chance over 30 yrs
- Wildfire 1/10 Low
- Heat 2/10 Low 7 d/yr ≥94°F today · 15 d/yr by 30 yrs out
- Wind 1/10 Low
- Air quality 2/10 Low 2 unhealthy d/yr today · 2 by 30 yrs out
Nearby sold comps map
Loading sold comps map…
Walkable amenities ~0.75 mi
Loading nearby amenities…
Taxation est. · year 1
- Rental income
- $36,983
- − Mortgage interest
- −$24,641
- − Property taxes
- −$7,188
- − Insurance
- −$2,200
- − Repairs & maintenance
- −$2,959
- − Management
- −$2,959
- − Depreciation
- −$12,797
- Taxable loss
- −$15,760
- Est. tax savings @ 24.0%
- +$3,782
- After-tax cash flow
- $-4,071/yr
For passive investors: Depreciation is non-cash, so a rental often shows a tax loss while cash-flowing — sheltering income. Rental losses are passive: they offset passive income freely, and up to $25,000/yr can offset ordinary (W-2) income if you actively participate and your MAGI is under $100k (phasing out to $0 by $150k); unused losses carry forward. On sale, claimed depreciation is recaptured at up to 25%, and gains may owe capital-gains tax (a 1031 exchange can defer both). Figures are a year-1 estimate at your 24.0% rate — not tax advice; consult a CPA.
Schools (NCES district)
- District
- Williamsville Central School District
- NCES district ID
- 3631470
- Math proficiency
- 64% ▼ -14.00%
- Reading proficiency
- 77% ▲ 6.00%
- Median HH income
- $79,907
- Composite
- 62.59/100
- National rank
- #678
- State rank
- #114 of 590 in NY
Livability — Williamsville
- Score
- 84/100
- State rank
- #44
- US rank
- #693
Category grades
Schools grade is shown separately in the Schools card above.
Census & demographics
- County
- Erie County · 714,559 people
- City population
- 55,255
- Metro
- Buffalo-Cheektowaga, NY
- Population (ZIP)
- 55,255
- Household income
- $101,615
- Rent vs Own
- Severe rent burden
- 1956.0
Population outlook (Erie County) Hauer SSP2
- Today (2025)
- 933,037 people
- By 2030
- 935,181 · +0.2%
- By 2040
- 928,531 · -0.5%
- By 2050
- 905,725 · -2.9%
- By 2075
- 834,037 · -10.6%
- By 2100
- 708,033 · -24.1%
Race, ethnicity, and origin ACS 2023
- Neighborhood character
- Predominantly White (84%)
- Race & ethnicity
- White 84% Asian 8% Two or more races 4% Hispanic / Latino 3% Black 2%
- Common ancestry
- Romanian 15% Lithuanian 2% Slovak 2%
- Foreign-born
- 10% · Canada, China, South Korea
- Languages at home
- 88% English-only · Other Indo-European 3% Other Asian/Pacific 2% Spanish 2%
Political lean MEDSL · Erie
- 2024 margin
- Lean D (+9.7) · D 54.8% · R 45.2%
- 2008→2024 swing
- -7.9pp toward R · 2008: 17.5pp · 2024: 9.7pp
- All cycles
- 2024: D+9.7 2020: D+14.7 2016: D+4.8 2012: D+15.6 2008: D+17.5
Not yet ingested
- Civics
- —
Market trends
- HPI YoY
- ▼ -301.37%
- Current HPI
- 322.6947
- Rent YoY
- ▲ 5.01%
- Metro
- Buffalo-Cheektowaga, NY
- State GDP YoY
- ▲ 2.60%
- F500 in state
- 92
Industry mix (Fortune 500 HQ in NY)
| Industry | F500 HQs | Revenue |
|---|---|---|
| Financial Services | 10 | $950B |
|
||
| Consumer Goods | 9 | $162B |
|
||
| Insurance | 4 | $225B |
|
||
| Telecommunications | 2 | $144B |
|
||
| Pharmaceuticals | 2 | $112B |
|
||
| Media / Entertainment | 2 | $69B |
|
||
Price history
2 events — show timeline
- 2026-06-01 Pending — WNYREIS
- 2026-05-14 Listed $439,900 WNYREIS
Property tax history
+4.9%/yrLatest (2025): $7,188 · +1.6% YoY. Source: county tax records.
Cash-flow waterfall
monthlySold comps — $/sqft
last 12 mo · ≤1 miLoading sold comps…