 Fourplex
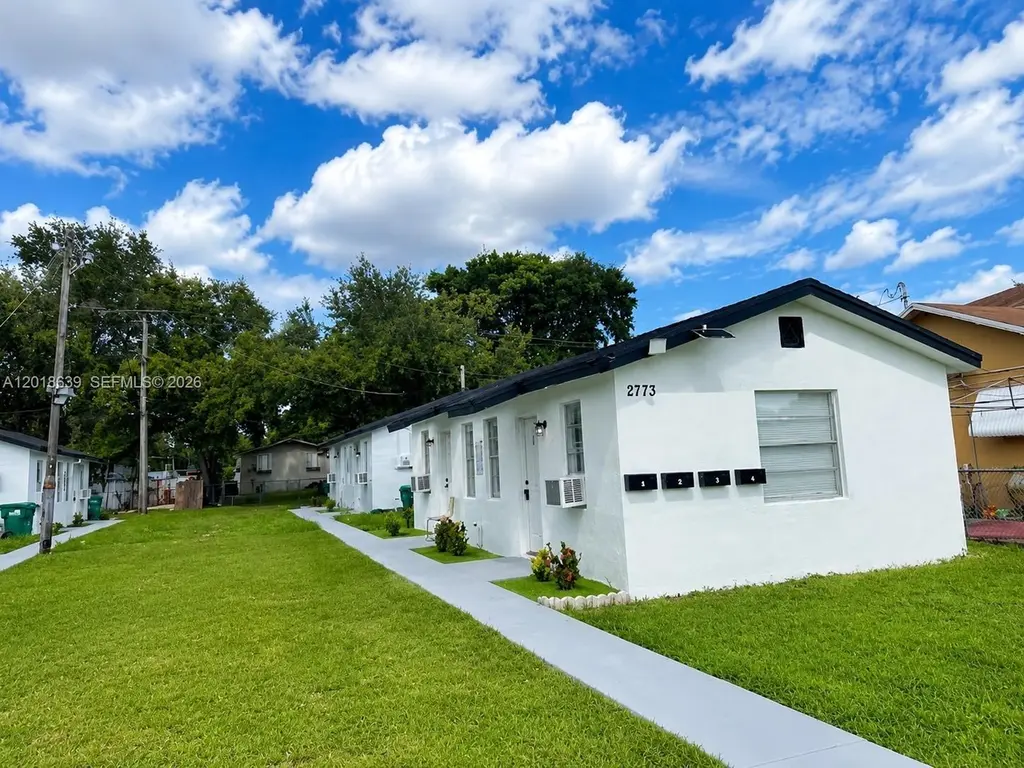
2775 NW 57th St · Brownsville, FL
Flood risk 4/10 · Minor
- FEMA flood zone
- X (unshaded)
- Chance of flooding over 30 yrs
- 0.22%
- Est. flood insurance / yr
- $507 – $1,088
Fire risk 1/10 · Minimal
- Est. fire insurance / yr
- $947 – $1,759
Heat risk 10/10 · Severe
- Hot days now (above 104°F)
- 7 days/yr
- Hot days in 30 yrs
- 29 days/yr
Wind risk 10/10 · Severe
- Chance of severe wind over 30 yrs
- 99.0%
Air-quality risk 2/10 · Minimal
- Unhealthy air days now
- 1 days/yr
- Unhealthy air days in 30 yrs
- 1 days/yr
Risk factors via First Street. Map © Google.
Why this score? — see what drove the D+ grade
The composite is a weighted blend of 9 inputs, each scored 0–100. Each bar is that input's sub-score; the figure is the points it added to the 100-point composite (weight × sub-score).
- Cash flow +18.3/30.0
- ARV discount +7.5/15.0
- DSCR +5.7/10.0
- Schools +4.2/10.0
- 1% rule +4.1/10.0
- Livability +3.8/5.0
- Condition / age +2.5/5.0
- Rent growth +2.4/5.0
- Appreciation +0.0/10.0
$749,900
🖨 Deal sheet (PDF) 📄 Offer letter ✓ Due diligence
Multi-family units
County records classify this as Multi-Family (2-4 Unit). Listing-text estimate: 4 units. confirmed
Listing remarks
Excellent investment opportunity in the heart of Miami! Completely remodeled fourplex featuring updated studio units with brand-new kitchens, renovated bathrooms, modern flooring throughout, and fresh interior/exterior paint. All units are currently rented, generating a total monthly income of $5,400, making this a turnkey cash-flow opportunity with immediate income potential. Well-maintained multifamily property located in a high-demand rental market, ideal for investors looking to expand their portfolio with a stabilized asset in Miami. Neighboring fourplex for sale! 2773 and 2775 can be sold TOGETHER as a bundle.
Key facts
- Modern flooring
- Renovated bathrooms
- Remodeled fourplex
Tags
Property features AI
Finance
- Financial info: Property configured as multiple efficiency units (total of 10 units: 4 + 3 + 2 + 1); Typical rents reported: $1,300 for most units; $1,500 for higher-rent units; Units listed as leased
Exterior
- Parking: Total of 4 parking spaces
- Utilities: Public water; Public sewer; Cable available
- Home design: Single-story property; Shingle roof; Block construction
- Construction: Block construction; Shingle roof; Resale property
- Exterior features: Property on less than a quarter acre lot
Interior
- Kitchen: Some units include a range; At least one unit includes a refrigerator
- Bedrooms: Multiple efficiency units with 1 bedroom each (units described below)
- Flooring: Tile
- Bathrooms: Each unit includes 1 full bathroom
- Heating & cooling: Central heating; Central air conditioning; Some units list individual air conditioning units
- Interior features: Tile flooring
- Laundry & utility: Water included in rent
Neighborhood map
What this means for you Summary
Snapshot
- This is a 4 × 2-bed/2.5-bath units multifamily listed at $750k.
Deal economics
- At list price, monthly cash flow is $687 ($8k/yr) — positive. Per door: $172/mo.
- The deal already cash-flows at list — no discount required.
- To meet the 1% rule (rent ≥ 1% of price), the offer needs to be $682k (9.0% below list).
- Recommended offer: $682k (9.0% below list) — sets the bar for 1% rule.
Location & tenants
- Location reads 75/100 on livability (#246 in FL, #3,900 nationally) — a middle-class / working-renter tenant base. Strengths: commute A+, cost of living A+, health & safety B+; Watch: amenities F, employment F.
- Miami-Dade (suburban): math 45% / reading 54% proficiency, ranked #40 of 73 in FL (top 55%) — families likely to look elsewhere, expect single-tenant / working-renter base with shorter leases; 64% free/reduced lunch — lower-income household profile, screen leases tightly.
- Zoned schools: Earlington Heights Elementary School (math 52% / reading 37%, grade F, #1,288 of 2,144 statewide, top 62%, 340 students, 76% FRL); Miami Springs Middle School (math 21% / reading 25%, grade F, #542 of 571 statewide, top 95%, 640 students, 74% FRL); Miami Springs Senior High School (math 17% / reading 37%, grade F, #478 of 667 statewide, top 73%, 998 students, 70% FRL).
- Zoned-school proficiency averages 32% at this address vs 50% district-wide (-18 pts) — the specific schools serving this property underperform the Miami-Dade average; the district grade overstates school quality for this exact location.
- Market conditions: Rents soft (-0.4%/yr); 271 active listings in the ZIP; lower-income renter base — watch delinquency; 10,051 units permitted in Miami-Dade County in 2024 (7,758 in 5+ unit buildings).
- At $6,822/mo this rent would consume 207% of the median local household income ($40k/yr) (locally 5748% of renters already pay >50% of income on rent) — very limited rent-growth headroom before tenants either downsize or default.
Forward outlook
- Local home prices are declining (-3.0%/yr); year-one equity from $5k of loan paydown is wiped out by about $22k of value loss. Plan a longer hold.
- Miami-Dade County population projected at +28% by 2050 — long-run rental-demand tailwind backs the buy-and-hold thesis.
Negotiation context
- It's been on market 38 days — a 3% lower offer ($727k) is reasonable based on typical stale-listing flexibility.
- Current owner paid $415k; list at $750k implies a 81% gain — meaningful room to come down on a strong offer.
Risks & watch-outs
- Watch-outs: built in 1947 — expect roof / HVAC / electrical / plumbing capex.
- Climate carrying-cost: severe wind risk, 99% chance of damaging wind over 30y; extreme-heat days projected 7→29/yr by 2055 (HVAC capex compounding) — expect insurance premiums to compound above CPI over the hold.
Questions for the listing agent
- It's been on market 38 days. Have you received any prior offers? Is the seller open to a 9% concession, seller financing, or rate buy-down credit?
- Can we see the unit-by-unit rent roll, current vacancy, and any below-market leases? What's the average tenancy length?
- What capital expenditures (roof, boiler, parking lot, exteriors) have been made in the last 5 years, and what's planned in the next 2?
- Built in 1947 — when were the roof, HVAC, electrical panel, plumbing, and water heater last replaced?
- Is there a deadline driving the sale (1031 exchange, divorce, estate, relocation)? That informs how much negotiation room exists.
- Schools are A-rated — typically a magnet for longer-tenancy family renters. What's the average tenant stay here, and is there a school-zone premium baked into asking?
- The area grade is low — what's the realistic commute time and amenity access for the typical tenant pool here? Any planned neighborhood developments (good or bad) we should know about?
- What's the average days-on-market for RENTAL listings here right now (not sales)? A rising rental-DOM trend means longer vacancies and softer asking-rent achievability than the comps imply.
- What's the recent tenant-quality profile in this submarket — average credit score on applications, eviction rate, late-payment / NSF rate, and stable-employment percentage? A property-management company in the area should have these aggregated.
- How much new apartment / multifamily construction is in the pipeline within 1–3 miles? Heavy new supply (>2% of stock underway) typically softens rents 12–24 months out; light construction supports rent growth.
Investment metrics
- 1% rule
- 0.91% ✗
- Cap rate
- 7.39%
- Cash-on-cash
- 3.93%
- DSCR
- 1.17
- GRM
- 9.2
CMA / ARV
No comps found within radius.
Projected returns pro-forma
-3.0% appreciation · 0.0% rent growth · sell at horizon
- IRR
- -13.3%
- Equity multiple
- 0.53×
- Total profit
- $-97,932
- Equity at exit
- $111,813
- IRR
- -9.5%
- Equity multiple
- 0.49×
- Total profit
- $-106,963
- Equity at exit
- $64,838
Cash invested: $209,972 (down + closing). Projections, not guarantees.
Landlord ↔ Tenant lean methodology
- Overall (STATE)
- 87 Strongly Landlord-Friendly
- State Florida
- 87 Strongly Landlord-Friendly · R+3
- County
- — inherits STATE
- City
- — inherits STATE
ZIP-level market 33142
- Home prices YoY
- -15.1%
- Rents YoY
- -0.4%
- Active inventory
- 271
- Price-to-rent
- 36.6×
Monthly cashflow live
- Estimated rent
- $6,822 medium interval (Pro) →
- Mortgage (P&I)
- −$3,933
- Tax from tax record
- −$457 /mo · $5,486/yr
- Insurance
- −$312
- HOA
- −$0
- Vacancy / Maint / Mgmt
- −$1,433
- Net cashflow
- $687
Break-even live
Sensitivity live
| Price | -10% $1,112 | -5% $899 | +0% $687 | +5% $475 | +10% $263 |
|---|---|---|---|---|---|
| Rent | -10% $148 | -5% $418 | +0% $687 | +5% $957 | +10% $1,226 |
| Rate | -1.0pp $1,065 | -0.5pp $878 | base $687 | +0.5pp $493 | +1.0pp $295 |
4-unit breakdown (identical units grouped — click to expand)
| Units | Beds | Baths | Est. rent |
|---|---|---|---|
| 4× units | 2 | 2.5 | $6,820 |
| #1 | 2 | 2.5 | $1,705 |
| #2 | 2 | 2.5 | $1,705 |
| #3 | 2 | 2.5 | $1,705 |
| #4 | 2 | 2.5 | $1,705 |
| Total (4 units) | $6,822 | ||
UW: 25.0% down · 7.5% · 30yr · 1.5% tax · 5.0% vac · 8.0% maint · 8.0% mgmt
Financing live
Cash to close
- Down payment
- $187,475
- Closing costs
- $22,497
- Reserves months
- —
- Total cash needed
- —
Loan-product check · same deal, 3 products live
Conventional
25% down · 7.5% · 30yr
- Down + closing
- —
- Monthly P&I
- —
- Monthly cashflow
- —
- DSCR
- —
- Eligible?
- —
Personal DTI + credit; lowest rate.
DSCR
20% down · 8.5% · 30yr
- Down + closing
- —
- Monthly P&I
- —
- Monthly cashflow
- —
- DSCR
- —
- Eligible?
- —
No personal income docs; deal must DSCR.
Hard money
10% down · 12.0% · 12mo
- Down + closing
- —
- Monthly P&I
- —
- Monthly cashflow
- —
- DSCR
- —
- Eligible?
- —
Short-term bridge; refi at stabilization.
Listing history 19 events
-
2026-06-21days on market $749,900 Active 38 DOM
-
2026-06-18days on market $749,900 Active 35 DOM
-
2026-06-17days on market $749,900 Active 34 DOM
-
2026-06-16days on market $749,900 Active 33 DOM
-
2026-06-15days on market $749,900 Active 32 DOM
-
2026-06-13days on market $749,900 Active 30 DOM
-
2026-06-09days on market $749,900 Active 26 DOM
-
2026-06-08days on market $749,900 Active 25 DOM
-
2026-06-07days on market $749,900 Active 24 DOM
-
2026-06-04days on market $749,900 Active 21 DOM
-
2026-06-03days on market $749,900 Active 20 DOM
-
2026-06-02days on market $749,900 Active 19 DOM
-
2026-06-01days on market $749,900 Active 18 DOM
-
2026-05-31days on market $749,900 Active 17 DOM
-
2026-05-14$749,900 Active
-
2025-03-04soldstatus $415,000
-
2005-06-29soldstatus $169,000
-
1981-05-01soldstatus $50,000
-
1977-12-01soldstatus $42,000
ⓘ Source: listings_history table (triggers on properties + properties_extension) + one-shot
backfill from property_details.listing_events for pre-trigger history.
Tax reassessment forecast FL · Resets to sale price
- Current annual tax
- $5,486 · $457/mo
- Projected year-2 tax
- $6,224 · $519/mo
- Expected delta
- +$738/yr (+$62/mo · 13.5%)
ⓘ Screening estimate from a state-policy table — verify with the county assessor before closing.
Climate risk First Street
- Flood 4/10 Moderate FEMA zone X (unshaded) · 22% chance over 30 yrs
- Wildfire 1/10 Low
- Heat 10/10 Extreme 7 d/yr ≥104°F today · 29 d/yr by 30 yrs out
- Wind 10/10 Extreme 99% chance of damaging wind over 30 yrs
- Air quality 2/10 Low 1 unhealthy d/yr today · 1 by 30 yrs out
Nearby sold comps map
Loading sold comps map…
Walkable amenities ~0.75 mi
Loading nearby amenities…
Taxation est. · year 1
- Rental income
- $81,864
- − Mortgage interest
- −$42,006
- − Property taxes
- −$5,486
- − Insurance
- −$3,750
- − Repairs & maintenance
- −$6,549
- − Management
- −$6,549
- − Depreciation
- −$21,815
- Taxable loss
- −$4,291
- Est. tax savings @ 24.0%
- +$1,030
- After-tax cash flow
- $9,276/yr
For passive investors: Depreciation is non-cash, so a rental often shows a tax loss while cash-flowing — sheltering income. Rental losses are passive: they offset passive income freely, and up to $25,000/yr can offset ordinary (W-2) income if you actively participate and your MAGI is under $100k (phasing out to $0 by $150k); unused losses carry forward. On sale, claimed depreciation is recaptured at up to 25%, and gains may owe capital-gains tax (a 1031 exchange can defer both). Figures are a year-1 estimate at your 24.0% rate — not tax advice; consult a CPA.
Schools (NCES district)
- District
- Miami-Dade
- NCES district ID
- 1200390
- Math proficiency
- 45% ▼ -16.00%
- Reading proficiency
- 54% ▼ -5.00%
- Median HH income
- $43,928
- Composite
- 41.76/100
- National rank
- #3397
- State rank
- #40 of 73 in FL
Livability — Brownsville
- Score
- 75/100
- State rank
- #246
- US rank
- #3900
Category grades
Schools grade is shown separately in the Schools card above.
Census & demographics
- Census place
- Brownsville, FL
- County
- Miami-Dade County · 2,697,751 people
- City population
- 827,308
- Metro
- Miami-Fort Lauderdale-Pompano Beach, FL
- Population (ZIP)
- 58,908
- Household income
- $39,608
- Rent vs Own
- Severe rent burden
- 5748.0
Population outlook (Miami-Dade County) Hauer SSP2
- Today (2025)
- 3,126,439 people
- By 2030
- 3,325,765 · +6.4%
- By 2040
- 3,697,561 · +18.3%
- By 2050
- 4,012,134 · +28.3%
- By 2075
- 4,605,612 · +47.3%
- By 2100
- 4,866,598 · +55.7%
Race, ethnicity, and origin ACS 2023
- Neighborhood character
- Predominantly Hispanic (68%)
- Race & ethnicity
- Hispanic / Latino 68% Two or more races 36% Black 28% White 3%
- Hispanic origin (detail)
- Mexican 2% Puerto Rican 3% Cuban 24% Dominican 7%
- Common ancestry
- Hispanic 2%
- Foreign-born
- 51% · Canada, Jamaica, Dominican Republic
- Languages at home
- 34% English-only · Spanish 64% French/Haitian/Cajun 1%
Political lean MEDSL · Miami-Dade
- 2024 margin
- R (+11.4) · D 43.9% · R 55.4%
- 2008→2024 swing
- -27.6pp toward R · 2008: 16.1pp · 2024: -11.4pp
- All cycles
- 2024: R+11.4 2020: D+7.3 2016: D+29.6 2012: D+23.7 2008: D+16.1
Not yet ingested
- Civics
- —
Market trends
- HPI YoY
- ▼ -102.31%
- Current HPI
- 574.9225
- Rent YoY
- ▼ -0.41%
- Metro
- Miami-Fort Lauderdale-Pompano Beach, FL
- State GDP YoY
- ▲ 3.28%
- F500 in state
- 36
Industry mix (Fortune 500 HQ in FL)
| Industry | F500 HQs | Revenue |
|---|---|---|
| Industrial Technology | 2 | $29B |
|
||
| Insurance | 2 | $17B |
|
||
| Retail | 1 | $60B |
|
||
| Technology Distribution | 1 | $58B |
|
||
| Homebuilding | 1 | $35B |
|
||
| Technology Manufacturing | 1 | $35B |
|
||
Price history
+1685.5% since first listed5 events — show timeline
- 2026-05-14 Listed $749,900 MARMLS
- 2025-03-04 Sold (Public Records) $415,000 Public Records
- 2005-06-29 Sold (Public Records) $169,000 Public Records
- 1981-05-01 Sold (Public Records) $50,000 Public Records
- 1977-12-01 Sold (Public Records) $42,000 Public Records
Property tax history
+7.6%/yrLatest (2025): $5,486 · +1.1% YoY. Source: county tax records.
Cash-flow waterfall
monthlySold comps — $/sqft
last 12 mo · ≤1 miLoading sold comps…