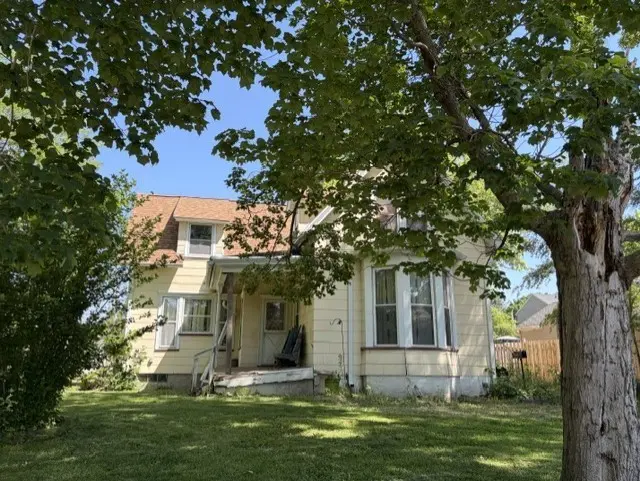
533 9th St · LaSalle, IL
Flood risk 1/10 · Minimal
- FEMA flood zone
- X (unshaded)
- Chance of flooding over 30 yrs
- 0.0%
- Est. flood insurance / yr
- $473 – $860
Fire risk 1/10 · Minimal
- Est. fire insurance / yr
- $804 – $1,492
Heat risk 3/10 · Minor
- Hot days now (above 104°F)
- 7 days/yr
- Hot days in 30 yrs
- 16 days/yr
Wind risk 2/10 · Minimal
- Chance of severe wind over 30 yrs
- 1.0%
Air-quality risk 2/10 · Minimal
- Unhealthy air days now
- 1 days/yr
- Unhealthy air days in 30 yrs
- 1 days/yr
Risk factors via First Street. Map © Google.
Why this score? — see what drove the B grade
The composite is a weighted blend of 9 inputs, each scored 0–100. Each bar is that input's sub-score; the figure is the points it added to the 100-point composite (weight × sub-score).
- Cash flow +30.0/30.0
- ARV discount +15.0/15.0
- 1% rule +10.0/10.0
- DSCR +10.0/10.0
- Livability +3.2/5.0
- Rent growth +2.5/5.0
- Condition / age +2.5/5.0
- Schools +1.7/10.0
- Appreciation +0.0/10.0
$62,500
🖨 Deal sheet 📄 Offer letter ✓ Due diligence
Listing remarks
Visit this spacious, 3 bed, 1 bath handyman home with 75x140 lot and 2 car garage. Features some hardwood flooring, eat-in kitchen, main level laundry and new roof in 2018. Lots of great potential for the right buyer.
Key facts
- Hardwood flooring
- Main level laundry
- Eat-in kitchen
Tags
Property features AI
Finance
- Other: Lot dimensions approximately 75 x 140 (less than 0.25 acre); Living area per assessor; Directions: Rt 6 east to Wright north, east on 9th
- HOA & community: No master association fee required
Exterior
- Parking: Detached garage (garage owned); Gravel driveway; Total of 4 parking spaces, including 2 garage spaces
- Utilities: Public water; Public sewer; Electrical service with circuit breakers
- Home design: Detached single-family home; 1.5-story design; Fee simple ownership; Over 100 years old; School bus service available
- Construction: Asphalt roof; Block foundation; Other construction materials; Built before 1978
- Exterior features: Front porch
Interior
- Kitchen: Eating area / table space; Range; Refrigerator
- Bedrooms: Three bedrooms (master and two additional bedrooms on the second floor)
- Flooring: Hardwood in several main living areas; Linoleum in kitchen; Vinyl in laundry
- Bathrooms: One full bathroom
- Heating & cooling: Natural gas forced-air heating; Central air conditioning
- Interior features: First-floor full bath; Walk-in closets; Unfinished full basement; Seven total rooms
- Laundry & utility: Main-level laundry; Washer; Dryer; Owned water softener
Neighborhood map
What this means for you Summary
Snapshot
- This is a 3-bed/1.0-bath single-family listed at $62k.
Deal economics
- At list price, monthly cash flow is $359 ($4k/yr) — positive.
- The deal already cash-flows at list — no discount required.
- Meets the 1% rule at list price ($1k rent vs $62k).
- Cap rate 13.2% vs local median 5.6% in LaSalle — top-decile yield for the area; either an underpriced asset or a hidden risk that comps aren't pricing in. Stress-test before assuming the spread holds.
Location & tenants
- Location reads 64/100 on livability (#718 in IL) — a middle-class / working-renter tenant base. Strengths: crime A+, cost of living A+, housing A+; Watch: health & safety C-, employment D+, schools F.
- La Salle-Peru Twp Hsd 120 (town): math 15% / reading 26% proficiency, ranked #427 of 620 in IL (top 69%) — low school quality limits family demand, transient renter base, plan for 1-2y turnover.
- Market conditions: 68 active listings in the ZIP; 82 units permitted in LaSalle County in 2024 (0 in 5+ unit buildings).
Forward outlook
- Local home prices are declining (-3.0%/yr); year-one equity from $432 of loan paydown is wiped out by about $2k of value loss. Plan a longer hold.
- LaSalle County population projected at -16% by 2050 — secular population decline; favor cash flow + early exit over multi-decade hold.
- At projected returns (-3.0% appreciation + 3.0% rent growth), your $18k cash investment doubles in ~5 years — after that, you're playing with house money.
Negotiation context
- Only 3 days on market — expect competitive offers; lowballing is unlikely to land.
Risks & watch-outs
- Watch-outs: property tax is 5.0% of price; built in 1898 — expect roof / HVAC / electrical / plumbing capex.
Questions for the listing agent
- Built in 1898 — when were the roof, HVAC, electrical panel, plumbing, and water heater last replaced?
- Property tax is high relative to price — has the assessment been appealed recently, and will the sale trigger a re-assessment?
- Is there a deadline driving the sale (1031 exchange, divorce, estate, relocation)? That informs how much negotiation room exists.
- Schools are F-rated, which usually means shorter tenancies and higher turnover. Who's the typical renter profile here, and what's been the actual vacancy rate?
- What's the average days-on-market for RENTAL listings here right now (not sales)? A rising rental-DOM trend means longer vacancies and softer asking-rent achievability than the comps imply.
- What's the recent tenant-quality profile in this submarket — average credit score on applications, eviction rate, late-payment / NSF rate, and stable-employment percentage? A property-management company in the area should have these aggregated.
- How much new for-sale + rental construction is in the pipeline within 1–3 miles? Heavy new supply typically softens prices + rents 12–24 months out; constrained supply supports both.
Investment metrics
- 1% rule
- 1.97% ✓
- Cap rate
- 13.19%
- Cash-on-cash
- 24.62%
- DSCR
- 2.10
- GRM
- 4.2
CMA / ARV
- ARV (on-the-fly)
- $119,200
- Comps found
- 12
Show comp detail 12 sales within ~0.75 mi
| Address | Dist | Beds/Ba | Sqft | Sold | Price | $/sf | Match |
|---|---|---|---|---|---|---|---|
| 605 Gooding St | 0.23mi | 4/1.0 (+1) | 1,585 (+6%) | 7mo | $65,000 | $41 | 68 |
| 236 10th St | 0.22mi | 3/1.0 | 1,664 (+12%) | 4mo | $123,000 | $74 | 67 |
| 1129 Creve Coeur St | 0.35mi | 2/1.0 (-1) | 1,442 (-3%) | 8mo | $61,000 | $42 | 66 |
| 1249 Creve Coeur St | 0.40mi | 3/1.0 | 1,636 (+10%) | 2mo | $105,000 | $64 | 63 |
| 1668 Chartres St | 0.70mi | 3/2.0 | 1,490 (0%) | 2mo | $170,000 | $114 | 62 |
| 1130 Lafayette St | 0.23mi | 3/2.0 | 1,695 (+14%) | 2mo | $200,000 | $118 | 61 |
| 1130 Lafayette St | 0.23mi | 3/2.0 | 1,695 (+14%) | 2mo | $200,000 | $118 | 61 |
| 1617 Illinois St | 0.54mi | 2/1.0 (-1) | 1,437 (-4%) | 8mo | $115,000 | $80 | 57 |
| 904 9th St | 0.26mi | 4/2.0 (+1) | 1,322 (-11%) | 6mo | $70,000 | $53 | 55 |
| 1345 Bucklin St | 0.33mi | 3/1.5 | 1,703 (+14%) | 7mo | $159,900 | $94 | 53 |
| 625 Oconor Ave | 0.65mi | 3/2.0 | 1,271 (-15%) | 1mo | $85,000 | $67 | 41 |
| 1526 Crosat St | 0.62mi | 2/1.0 (-1) | 1,276 (-14%) | 6mo | $127,500 | $100 | 37 |
Match score weights: distance 35% · size 25% · config 20% · recency 20%. Top-matched comps best support the ARV.
Projected returns pro-forma
-3.0% appreciation · 3.0% rent growth · sell at horizon
- IRR
- 18.1%
- Equity multiple
- 1.74×
- Total profit
- $12,869
- Equity at exit
- $9,319
- IRR
- 26.6%
- Equity multiple
- 3.35×
- Total profit
- $41,177
- Equity at exit
- $5,404
Cash invested: $17,500 (down + closing). Projections, not guarantees.
Landlord ↔ Tenant lean methodology
- Overall (STATE)
- 43 Moderately Tenant-Leaning
- State Illinois
- 43 Moderately Tenant-Leaning · D+7
- County
- — inherits STATE
- City
- — inherits STATE
ZIP-level market 61301
- Home prices YoY
- -24.3%
- Active inventory
- 68
- Price-to-rent
- 4.2×
Monthly cashflow live
- Estimated rent
- $1,230 medium interval (Pro) →
- Mortgage (P&I)
- −$328
- Tax from tax record
- −$259 /mo · $3,109/yr
- Insurance
- −$26
- HOA
- −$0
- Vacancy / Maint / Mgmt
- −$258
- Net cashflow
- $359
Break-even live
UW: 25.0% down · 7.5% · 30yr · 1.5% tax · 5.0% vac · 8.0% maint · 8.0% mgmt
Financing live
Cash to close
- Down payment
- $15,625
- Closing costs
- $1,875
- Reserves months
- —
- Total cash needed
- —
Loan-product check · same deal, 3 products live
Conventional
25% down · 7.5% · 30yr
- Down + closing
- —
- Monthly P&I
- —
- Monthly cashflow
- —
- DSCR
- —
- Eligible?
- —
Personal DTI + credit; lowest rate.
DSCR
20% down · 8.5% · 30yr
- Down + closing
- —
- Monthly P&I
- —
- Monthly cashflow
- —
- DSCR
- —
- Eligible?
- —
No personal income docs; deal must DSCR.
Hard money
10% down · 12.0% · 12mo
- Down + closing
- —
- Monthly P&I
- —
- Monthly cashflow
- —
- DSCR
- —
- Eligible?
- —
Short-term bridge; refi at stabilization.
Listing history 3 events
-
2026-05-31status $62,500 Pending 3 DOM
-
2026-05-30days on market $62,500 Active 3 DOM
-
2026-05-26$62,500 Active
ⓘ Source: listings_history table (triggers on properties + properties_extension) + one-shot
backfill from property_details.listing_events for pre-trigger history.
Tax reassessment forecast IL · Partial reset (capped growth)
- Current annual tax
- $3,109 · $259/mo
- Projected year-2 tax
- $3,109 · $259/mo
- Expected delta
- $0/yr ($0/mo · 0.0%)
ⓘ Screening estimate from a state-policy table — verify with the county assessor before closing.
Climate risk First Street
- Flood 1/10 Low FEMA zone X (unshaded) · 0% chance over 30 yrs
- Wildfire 1/10 Low
- Heat 3/10 Moderate 7 d/yr ≥104°F today · 16 d/yr by 30 yrs out
- Wind 2/10 Low 100% chance of damaging wind over 30 yrs
- Air quality 2/10 Low 1 unhealthy d/yr today · 1 by 30 yrs out
Nearby sold comps map
Loading sold comps map…
Walkable amenities ~0.75 mi
Loading nearby amenities…
Taxation est. · year 1
- Rental income
- $14,763
- − Mortgage interest
- −$3,501
- − Property taxes
- −$3,109
- − Insurance
- −$312
- − Repairs & maintenance
- −$1,181
- − Management
- −$1,181
- − Depreciation
- −$1,818
- Taxable income
- $3,660
- Est. tax owed @ 24.0%
- −$878
- After-tax cash flow
- $3,430/yr
For passive investors: Depreciation is non-cash, so a rental often shows a tax loss while cash-flowing — sheltering income. Rental losses are passive: they offset passive income freely, and up to $25,000/yr can offset ordinary (W-2) income if you actively participate and your MAGI is under $100k (phasing out to $0 by $150k); unused losses carry forward. On sale, claimed depreciation is recaptured at up to 25%, and gains may owe capital-gains tax (a 1031 exchange can defer both). Figures are a year-1 estimate at your 24.0% rate — not tax advice; consult a CPA.
Schools (NCES district)
- District
- La Salle-Peru Twp Hsd 120
- NCES district ID
- 1722110
- Math proficiency
- 15% ▼ -11.00%
- Reading proficiency
- 26% ▼ -11.00%
- Median HH income
- $40,449
- Composite
- 17.37/100
- National rank
- #9070
- State rank
- #427 of 620 in IL
Livability — LaSalle
- Score
- 64/100
- State rank
- #718
- US rank
- #14579
Category grades
Schools grade is shown separately in the Schools card above.
Census & demographics
- Census place
- LaSalle, IL
- Population (ZIP)
- 10,312
Population outlook (LaSalle County) Hauer SSP2
- Today (2025)
- 107,080 people
- By 2030
- 104,196 · -2.7%
- By 2040
- 97,413 · -9.0%
- By 2050
- 90,294 · -15.7%
- By 2075
- 76,252 · -28.8%
- By 2100
- 61,339 · -42.7%
Race, ethnicity, and origin ACS 2023
- Neighborhood character
- Predominantly White (74%)
- Race & ethnicity
- White 74% Hispanic / Latino 18% Two or more races 8% Black 5%
- Hispanic origin (detail)
- Mexican 18%
- Common ancestry
- Romanian 9% Lithuanian 3% Scotch-Irish 1%
- Foreign-born
- 6% · Canada
- Languages at home
- 87% English-only · Spanish 10% German/W. Germanic 1% Other Indo-European 1%
Political lean MEDSL · LaSalle
- 2024 margin
- R (+18.5) · D 40.1% · R 58.6% · Other 1.3%
- 2008→2024 swing
- -29.6pp toward R · 2008: 11.1pp · 2024: -18.5pp
- All cycles
- 2024: R+18.5 2020: R+14.3 2016: R+14.4 2012: R+0.4 2008: D+11.1
Not yet ingested
- Civics
- —
Market trends
- HPI YoY
- ▼ -52.46%
- Current HPI
- 163.091
- Rent YoY
- —
- Metro
- —
- State GDP YoY
- ▲ 1.59%
- F500 in state
- 60
Industry mix (Fortune 500 HQ in IL)
| Industry | F500 HQs | Revenue |
|---|---|---|
| Insurance | 4 | $201B |
|
||
| Consumer Goods | 4 | $87B |
|
||
| Industrial Machinery | 3 | $64B |
|
||
| Healthcare | 2 | $55B |
|
||
| Retail / Pharmacy | 1 | $148B |
|
||
| Agriculture / Food | 1 | $86B |
|
||
Price history
1 event — show timeline
- 2026-05-26 Listed $62,500 MRED as Distributed by MLS Grid
Property tax history
+11.0%/yrLatest (2024): $3,109 · +7.7% YoY. Source: county tax records.
Cash-flow waterfall
monthlySold comps — $/sqft
last 12 mo · ≤1 miLoading sold comps…