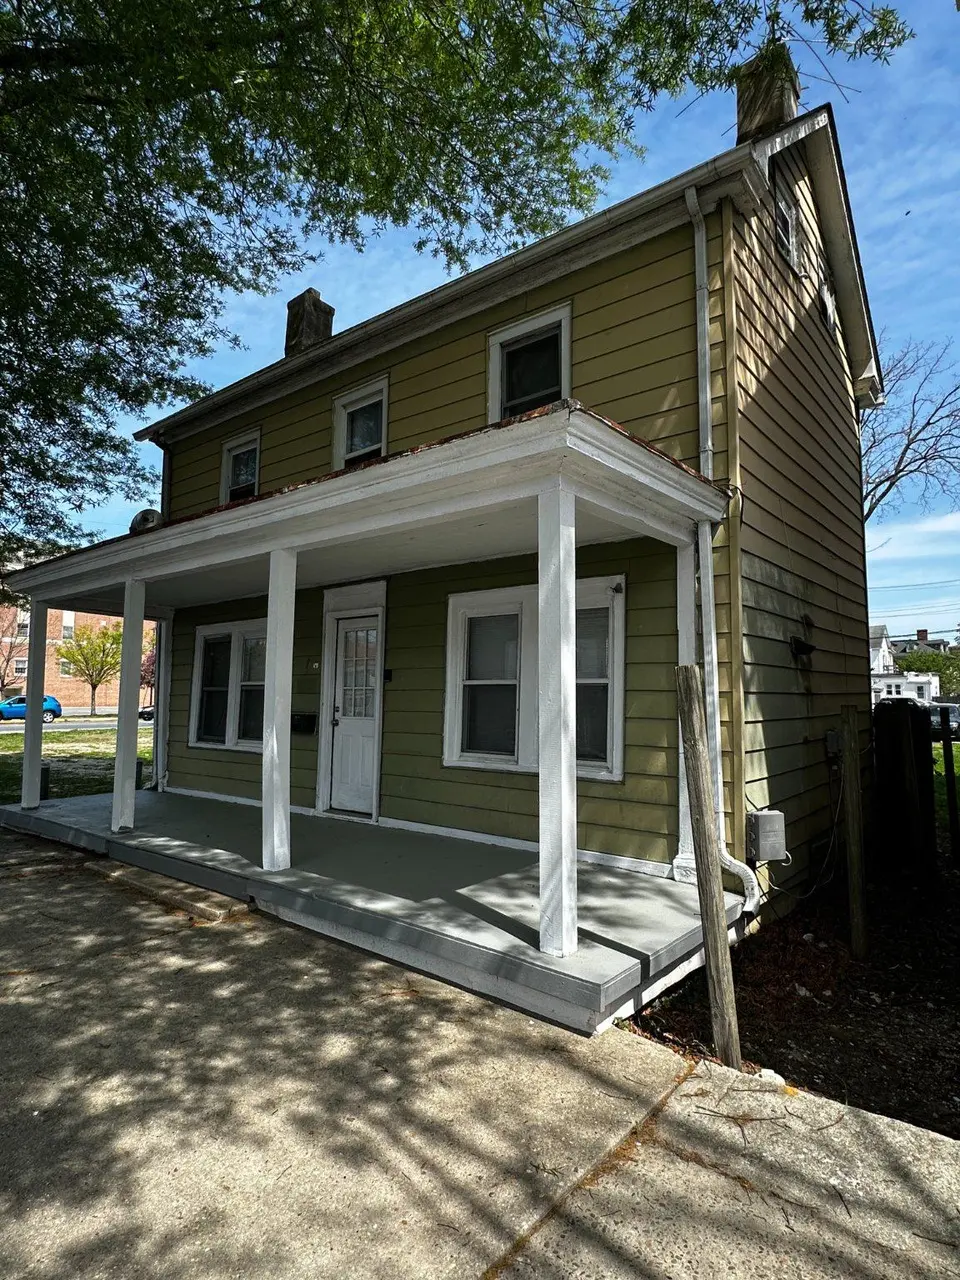
7 S Governors Ave · Dover, DE
Flood risk 3/10 · Minor
- FEMA flood zone
- X (unshaded)
- Chance of flooding over 30 yrs
- 0.12%
- Est. flood insurance / yr
- $507 – $1,088
Fire risk 1/10 · Minimal
- Est. fire insurance / yr
- $476 – $884
Heat risk 8/10 · Major
- Hot days now (above 101°F)
- 7 days/yr
- Hot days in 30 yrs
- 16 days/yr
Wind risk 6/10 · Moderate
- Chance of severe wind over 30 yrs
- 75.0%
Air-quality risk 2/10 · Minimal
- Unhealthy air days now
- 1 days/yr
- Unhealthy air days in 30 yrs
- 2 days/yr
Risk factors via First Street. Map © Google.
Why this score? — see what drove the C grade
The composite is a weighted blend of 9 inputs, each scored 0–100. Each bar is that input's sub-score; the figure is the points it added to the 100-point composite (weight × sub-score).
- Cash flow +27.2/30.0
- DSCR +9.5/10.0
- 1% rule +6.3/10.0
- ARV discount +5.7/15.0
- Livability +3.4/5.0
- Rent growth +3.3/5.0
- Condition / age +2.5/5.0
- Schools +2.0/10.0
- Appreciation +0.0/10.0
$199,000
🖨 Deal sheet (PDF) 📄 Offer letter ✓ Due diligence
Listing remarks MLS
2 story 3 bedroom 2 bath home would make a great investment. Off street parking, large back yard.
Key facts
- Off street parking
- Large back yard
- 4,661 sq ft lot
Tags
Neighborhood map
What this means for you Summary
Snapshot
- This is a 3-bed/1.0-bath single-family listed at $199k.
Deal economics
- At list price, monthly cash flow is $572 ($7k/yr) — positive.
- The deal already cash-flows at list — no discount required.
- Meets the 1% rule at list price ($2k rent vs $199k).
- Recommended offer: $187k (6.0% below list) — sets the bar for market timing.
- Cap rate 9.7% vs local median 5.2% in Dover — top-decile yield for the area; either an underpriced asset or a hidden risk that comps aren't pricing in. Stress-test before assuming the spread holds.
Location & tenants
- Location reads 67/100 on livability (#38 in DE) — a middle-class / working-renter tenant base. Strengths: amenities A+, cost of living A+, housing A+; Watch: schools C-, crime F, commute F.
- Capital School District (urban): math 14% / reading 31% proficiency, ranked #24 of 26 in DE (top 92%) — low school quality limits family demand, transient renter base, plan for 1-2y turnover.
- Market conditions: Rents rising (+3.3%/yr); 225 active listings in the ZIP; 21 comparable units currently listed for rent nearby; rentals lingering (median 45d on market — plan ~5-8 weeks vacancy on turnover, expect pricing pressure); 100% of comp listings sitting > 30 days — soft ceiling on asking rent; 1,201 units permitted in Kent County in 2024 (116 in 5+ unit buildings).
- This rent runs 40% of the median local income ($67k/yr) — at the standard rent-burdened threshold; future hikes will face affordability resistance.
Forward outlook
- Local home prices are declining (-3.0%/yr); year-one equity from $1k of loan paydown is wiped out by about $6k of value loss. Plan a longer hold.
- Kent County population projected at +22% by 2050 — long-run rental-demand tailwind backs the buy-and-hold thesis.
- At projected returns (-3.0% appreciation + 3.3% rent growth), your $56k cash investment doubles in ~9 years — after that, you're playing with house money.
Negotiation context
- It's been on market 65 days — a 6% lower offer ($187k) is reasonable based on typical stale-listing flexibility.
- 6 sale attempts since 30y ago; this cycle's ask has dropped $26k (12%) from the opening price — seller is motivated, your offer sets the floor, not the list.
- Current owner paid $63k; list at $199k implies a 216% gain — meaningful room to come down on a strong offer.
Risks & watch-outs
- Watch-outs: built in 1910 — expect roof / HVAC / electrical / plumbing capex.
- Climate carrying-cost: major wind risk, 75% chance of damaging wind over 30y; extreme-heat days projected 7→16/yr by 2055 (HVAC capex compounding) — expect insurance premiums to compound above CPI over the hold.
Questions for the listing agent
- It's been on market 65 days. Have you received any prior offers? Is the seller open to a 6% concession, seller financing, or rate buy-down credit?
- Built in 1910 — when were the roof, HVAC, electrical panel, plumbing, and water heater last replaced?
- Why hasn't it sold? Are there any deal-killer items the seller is aware of (foundation, flood, title, zoning, code violations)?
- Is there a deadline driving the sale (1031 exchange, divorce, estate, relocation)? That informs how much negotiation room exists.
- Crime grade is F in this area — have there been break-ins, vandalism, or insurance claims at this property in the last 3 years? What carrier currently insures it and at what premium?
- What's the average days-on-market for RENTAL listings here right now (not sales)? A rising rental-DOM trend means longer vacancies and softer asking-rent achievability than the comps imply.
- What's the recent tenant-quality profile in this submarket — average credit score on applications, eviction rate, late-payment / NSF rate, and stable-employment percentage? A property-management company in the area should have these aggregated.
- How much new for-sale + rental construction is in the pipeline within 1–3 miles? Heavy new supply typically softens prices + rents 12–24 months out; constrained supply supports both.
Investment metrics
- 1% rule
- 1.13% ✓
- Cap rate
- 9.74%
- Cash-on-cash
- 12.32%
- DSCR
- 1.55
- GRM
- 7.4
CMA / ARV
- ARV (median comp)
- $191,445
- List price
- $199,000
- Delta
- 3.95%
- Verdict
- FAIR
- Comps
- 20 within 1.0 mi
Show comp detail 12 sales within ~0.75 mi
| Address | Dist | Beds/Ba | Sqft | Sold | Price | $/sf | Match |
|---|---|---|---|---|---|---|---|
| 30 N Governors Ave | 0.08mi | 3/1.5 | 1,432 (-7%) | 2mo | $160,000 | $112 | 80 |
| 12 Clara St | 0.43mi | 3/2.0 | 1,524 (-1%) | 1mo | $280,000 | $184 | 73 |
| 24 S Queen St | 0.16mi | 3/2.5 | 1,700 (+10%) | 2mo | $285,000 | $168 | 68 |
| 120 N Kirkwood St | 0.28mi | 3/2.5 | 1,402 (-9%) | 1mo | $299,500 | $214 | 65 |
| 209 N New St | 0.23mi | 3/2.5 | 1,380 (-11%) | 2mo | $286,000 | $207 | 64 |
| 234 N Queen St | 0.31mi | 3/1.0 | 1,383 (-10%) | 9mo | $240,000 | $174 | 61 |
| 54 S Governors Ave | 0.09mi | 3/2.5 | 1,768 (+15%) | 7mo | $210,000 | $119 | 60 |
| 916 Forest St | 0.66mi | 4/2.0 (+1) | 1,568 (+2%) | 4mo | $290,000 | $185 | 54 |
| 749 W North St | 0.57mi | 3/2.5 | 1,456 (-6%) | 5mo | $280,000 | $192 | 54 |
| 128 W North St | 0.31mi | 3/2.0 | 1,336 (-13%) | 7mo | $274,000 | $205 | 53 |
| 46 Rodney Rd | 0.50mi | 3/1.5 | 1,701 (+10%) | 8mo | $290,000 | $170 | 51 |
| 604 Lakewood Pl | 0.68mi | 4/2.0 (+1) | 1,572 (+2%) | 9mo | $300,000 | $191 | 49 |
Match score weights: distance 35% · size 25% · config 20% · recency 20%. Top-matched comps best support the ARV.
Projected returns pro-forma
-3.0% appreciation · 3.3% rent growth · sell at horizon
- IRR
- 2.2%
- Equity multiple
- 1.09×
- Total profit
- $4,804
- Equity at exit
- $29,672
- IRR
- 12.1%
- Equity multiple
- 1.96×
- Total profit
- $53,625
- Equity at exit
- $17,206
Cash invested: $55,720 (down + closing). Projections, not guarantees.
Landlord ↔ Tenant lean methodology
- Overall (STATE)
- 70 Landlord-Friendly
- State Delaware
- 70 Landlord-Friendly · D+7
- County
- — inherits STATE
- City
- — inherits STATE
ZIP-level market 19904
- Rents YoY
- 3.3%
- Active inventory
- 225
- Price-to-rent
- 7.4×
Monthly cashflow live
- Estimated rent
- $2,247 high interval (Pro) →
- Mortgage (P&I)
- −$1,044
- Tax from tax record
- −$76 /mo · $914/yr
- Insurance
- −$83
- HOA
- −$0
- Vacancy / Maint / Mgmt
- −$472
- Net cashflow
- $572
Break-even live
Sensitivity live
| Price | -10% $685 | -5% $629 | +0% $572 | +5% $516 | +10% $460 |
|---|---|---|---|---|---|
| Rent | -10% $395 | -5% $483 | +0% $572 | +5% $661 | +10% $750 |
| Rate | -1.0pp $672 | -0.5pp $623 | base $572 | +0.5pp $521 | +1.0pp $468 |
UW: 25.0% down · 7.5% · 30yr · 1.5% tax · 5.0% vac · 8.0% maint · 8.0% mgmt
Financing live
Cash to close
- Down payment
- $49,750
- Closing costs
- $5,970
- Reserves months
- —
- Total cash needed
- —
Loan-product check · same deal, 3 products live
Conventional
25% down · 7.5% · 30yr
- Down + closing
- —
- Monthly P&I
- —
- Monthly cashflow
- —
- DSCR
- —
- Eligible?
- —
Personal DTI + credit; lowest rate.
DSCR
20% down · 8.5% · 30yr
- Down + closing
- —
- Monthly P&I
- —
- Monthly cashflow
- —
- DSCR
- —
- Eligible?
- —
No personal income docs; deal must DSCR.
Hard money
10% down · 12.0% · 12mo
- Down + closing
- —
- Monthly P&I
- —
- Monthly cashflow
- —
- DSCR
- —
- Eligible?
- —
Short-term bridge; refi at stabilization.
Rent comps 21 comps
| Address | Beds | Baths | Sqft | Rent | $/sqft | DOM | Units | Dist |
|---|---|---|---|---|---|---|---|---|
| 214 W Division St Dover, DE | 3.0 | 2.0 | 2072 | $2,350 | $1.13 | 44d | 1 | 0.05mi |
| 216 W Division St Dover, DE | 3.0 | 1.0 | 2072 | $2,200 | $1.06 | 44d | 1 | 0.05mi |
| 201 N American Ave Dover, DE | 3.0 | 2.0 | 1600 | $2,000 | $1.25 | 44d | 1 | 0.32mi |
| 100 Isabelle Isle Dover, DE | 2.0–3.0 | 2.0 | 1273 | $2,299 | $1.81 | 44d | 9 | 0.35mi |
| 355A Ridgely St Dover, DE | 1.0–3.0 | 1.0–2.5 | 1238 | $2,695 | $2.18 | 44d | 17 | 0.39mi |
| 46 Lincoln St Dover, DE | 2.0 | 2.0 | 1073 | $1,700 | $1.58 | 44d | 1 | 0.46mi |
| 104 Bayard Ave Dover, DE | 3.0 | 2.5 | 2168 | $2,350 | $1.08 | 44d | 1 | 0.61mi |
| 522 Carol St Dover, DE | 3.0 | 1.5 | 1722 | $1,950 | $1.13 | 44d | 1 | 0.63mi |
| 205 Ridgely Blvd Dover, DE | 3.0 | 2.5 | 1432 | $2,000 | $1.40 | 44d | 1 | 0.80mi |
| 424 Ridgely Blvd Dover, DE | 3.0 | 2.5 | 1432 | $2,000 | $1.40 | 44d | 1 | 0.95mi |
| 91 Chatham Ct Dover, DE | 2.0 | 2.5 | 1530 | $1,750 | $1.14 | 44d | 1 | 1.00mi |
| 629 Ruth Way Dover, DE | 3.0–4.0 | 2.0–2.5 | 1665 | $2,850 | $1.71 | 44d | 13 | 1.04mi |
| 502 Horsey Blvd Dover, DE | 3.0 | 2.0 | 1604 | $2,900 | $1.81 | 44d | 1 | 1.11mi |
| 36 Arlberg Cir Dover, DE | 3.0 | 2.0 | 1751 | $2,200 | $1.26 | 44d | 1 | 1.15mi |
| 511 Nickerjack Way Dover, DE | 3.0 | 2.0 | 1569 | $2,800 | $1.78 | 44d | 1 | 1.15mi |
| 541 Ruth Way Dover, DE | 4.0 | 2.5 | 1761 | $3,200 | $1.82 | 44d | 1 | 1.21mi |
| 480 Country Dr Dover, DE | 3.0 | 1.0–2.0 | 715 | $1,875 | $2.62 | 44d | 22 | 1.30mi |
| 6000 Winners Cir Dover, DE | 2.0 | 2.0 | 1269 | $1,920 | $1.51 | 44d | 10 | 1.34mi |
| 68 Village Dr Dover, DE | 3.0 | 1.5 | 1530 | $1,499 | $0.98 | 44d | 1 | 1.35mi |
| 1300 S Farmview Dr Dover, DE | 1.0–2.0 | 1.0–2.0 | 888 | $1,699 | $1.91 | 44d | 8 | 1.46mi |
| 236 Green Blade Dr Dover, DE | 3.0 | 2.5 | 1200 | $1,850 | $1.54 | 44d | 1 | 1.46mi |
Listing history 31 events
-
2026-06-19days on market $199,000 Active 65 DOM
-
2026-06-18days on market $199,000 Active 64 DOM
-
2026-06-17days on market $199,000 Active 63 DOM
-
2026-06-16days on market $199,000 Active 62 DOM
-
2026-06-15days on market $199,000 Active 61 DOM
-
2026-06-14days on market $199,000 Active 59 DOM
-
2026-06-13days on market $199,000 Active 58 DOM
-
2026-06-10days on market $199,000 Active 56 DOM
-
2026-06-09days on market $199,000 Active 55 DOM
-
2026-06-08days on market $199,000 Active 54 DOM
-
2026-06-07days on market $199,000 Active 53 DOM
-
2026-06-02days on market $199,000 Active 48 DOM
-
2026-06-01days on market $199,000 Active 47 DOM
-
2026-05-31days on market $199,000 Active 46 DOM
-
2026-05-30days on market $199,000 Active 45 DOM
-
2026-04-15$224,900 Active 97-char remark
Show marketing remark (97 chars)
2 story 3 bedroom 2 bath home would make a great investment. Off street parking, large back yard.
-
2016-12-08historical
-
2016-06-08$115,000
-
2016-06-01historical
-
2015-12-01$145,000
-
2005-02-04soldstatus $63,000
-
2005-02-04soldstatus $63,000
-
2005-02-01soldstatus $63,000
-
2004-12-15historical
-
2004-12-07$63,000
-
2004-07-27historical
-
2004-07-27$73,500
-
1998-11-30soldstatus $65,000
-
1998-10-30soldstatus $65,000
-
1998-08-11historical
-
1996-02-12$65,000
ⓘ Source: listings_history table (triggers on properties + properties_extension) + one-shot
backfill from property_details.listing_events for pre-trigger history.
Tax reassessment forecast DE · Partial reset (capped growth)
- Current annual tax
- $914 · $76/mo
- Projected year-2 tax
- $1,034 · $86/mo
- Expected delta
- +$120/yr (+$10/mo · 13.1%)
ⓘ Screening estimate from a state-policy table — verify with the county assessor before closing.
Climate risk First Street
- Flood 3/10 Moderate FEMA zone X (unshaded) · 12% chance over 30 yrs
- Wildfire 1/10 Low
- Heat 8/10 Severe 7 d/yr ≥101°F today · 16 d/yr by 30 yrs out
- Wind 6/10 Major 75% chance of damaging wind over 30 yrs
- Air quality 2/10 Low 1 unhealthy d/yr today · 2 by 30 yrs out
Nearby sold comps map
Loading sold comps map…
Walkable amenities ~0.75 mi
Loading nearby amenities…
Taxation est. · year 1
- Rental income
- $26,960
- − Mortgage interest
- −$11,147
- − Property taxes
- −$914
- − Insurance
- −$995
- − Repairs & maintenance
- −$2,157
- − Management
- −$2,157
- − Depreciation
- −$5,789
- Taxable income
- $3,801
- Est. tax owed @ 24.0%
- −$912
- After-tax cash flow
- $5,954/yr
For passive investors: Depreciation is non-cash, so a rental often shows a tax loss while cash-flowing — sheltering income. Rental losses are passive: they offset passive income freely, and up to $25,000/yr can offset ordinary (W-2) income if you actively participate and your MAGI is under $100k (phasing out to $0 by $150k); unused losses carry forward. On sale, claimed depreciation is recaptured at up to 25%, and gains may owe capital-gains tax (a 1031 exchange can defer both). Figures are a year-1 estimate at your 24.0% rate — not tax advice; consult a CPA.
Schools (NCES district)
- District
- Capital School District
- NCES district ID
- 1000190
- Math proficiency
- 14% ▼ -17.00%
- Reading proficiency
- 31% ▼ -12.00%
- Median HH income
- $48,499
- Composite
- 19.78/100
- National rank
- #8703
- State rank
- #24 of 26 in DE
Livability — Dover
- Score
- 67/100
- State rank
- #38
- US rank
- #10574
Category grades
Schools grade is shown separately in the Schools card above.
Census & demographics
- Census place
- Dover, DE
- County
- Kent County · 82,184 people
- City population
- 76,581
- Metro
- Dover, DE
- Population (ZIP)
- 38,818
- Household income
- $66,908
- Rent vs Own
- Severe rent burden
- 1500.0
Population outlook (Kent County) Hauer SSP2
- Today (2025)
- 194,477 people
- By 2030
- 204,351 · +5.1%
- By 2040
- 222,135 · +14.2%
- By 2050
- 236,483 · +21.6%
- By 2075
- 266,327 · +36.9%
- By 2100
- 275,335 · +41.6%
Race, ethnicity, and origin ACS 2023
- Neighborhood character
- Diverse neighborhood (Simpson 0.64)
- Race & ethnicity
- White 48% Black 35% Two or more races 9% Hispanic / Latino 8% Asian 3%
- Hispanic origin (detail)
- Mexican 1% Puerto Rican 4%
- Common ancestry
- Hispanic 3% Romanian 2% Slovak 2%
- Foreign-born
- 10% · Canada, South Korea
- Languages at home
- 87% English-only · Spanish 5% French/Haitian/Cajun 3% German/W. Germanic 1%
Political lean MEDSL · Kent
- 2024 margin
- Toss-up / Even · D 50.2% · R 48.2% · Other 1.7%
- 2008→2024 swing
- -7.8pp toward R · 2008: 9.8pp · 2024: 2.0pp
- All cycles
- 2024: D+2.0 2020: D+4.1 2016: R+4.9 2012: D+4.9 2008: D+9.8
Not yet ingested
- Civics
- —
Market trends
- HPI YoY
- ▼ -112.03%
- Current HPI
- 187.6879
- Rent YoY
- ▲ 3.30%
- Metro
- Dover, DE
- State GDP YoY
- —
- F500 in state
- 0
Price history
+246.0% since first listed16 events — show timeline
- 2026-04-15 Listed $224,900 BRIGHT MLS
- 2016-12-08 Listing Removed — BRIGHT MLS
- 2016-06-08 Listed $115,000 BRIGHT MLS
- 2016-06-01 Listing Removed — BRIGHT MLS
- 2015-12-01 Listed $145,000 BRIGHT MLS
- 2005-02-04 Sold (Public Records) $63,000 Public Records
- 2005-02-04 Sold (Public Records) $63,000 Public Records
- 2005-02-01 Sold (MLS) $63,000 BRIGHT MLS
- 2004-12-15 Listing Removed — BRIGHT MLS
- 2004-12-07 Listed $63,000 BRIGHT MLS
- 2004-07-27 Listed $73,500 BRIGHT MLS
- 2004-07-27 Listing Removed — BRIGHT MLS
- 1998-11-30 Sold (Public Records) $65,000 Public Records
- 1998-10-30 Sold (MLS) $65,000 BRIGHT MLS
- 1998-08-11 Listing Removed — BRIGHT MLS
- 1996-02-12 Listed $65,000 BRIGHT MLS
Property tax history
+3.5%/yrLatest (2025): $914 · +3.5% YoY. Source: county tax records.
Cash-flow waterfall
monthlySold comps — $/sqft
last 12 mo · ≤1 miLoading sold comps…