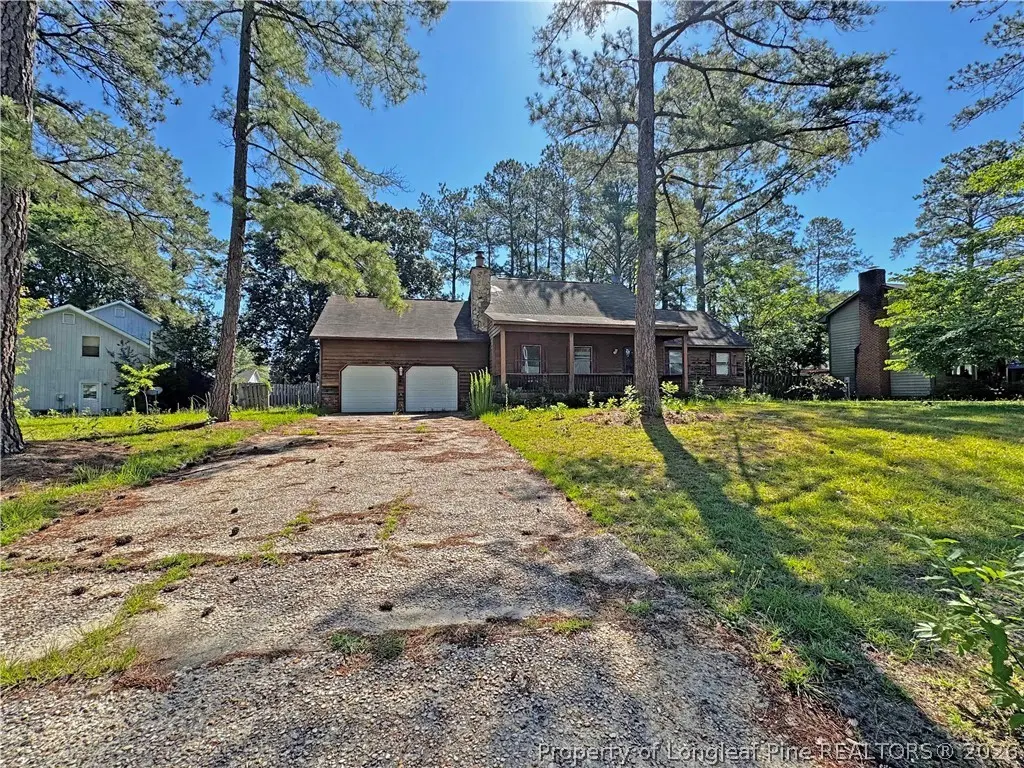
609 Lufkin Cir · Fayetteville, NC
Flood risk 1/10 · Minimal
- FEMA flood zone
- X (unshaded)
- Chance of flooding over 30 yrs
- 0.0%
- Est. flood insurance / yr
- $507 – $1,088
Fire risk 3/10 · Minor
- Est. fire insurance / yr
- $906 – $1,684
Heat risk 7/10 · Major
- Hot days now (above 106°F)
- 7 days/yr
- Hot days in 30 yrs
- 16 days/yr
Wind risk 7/10 · Major
- Chance of severe wind over 30 yrs
- 76.0%
Air-quality risk 2/10 · Minimal
- Unhealthy air days now
- 0 days/yr
- Unhealthy air days in 30 yrs
- 1 days/yr
Risk factors via First Street. Map © Google.
Why this score? — see what drove the B grade
The composite is a weighted blend of 9 inputs, each scored 0–100. Each bar is that input's sub-score; the figure is the points it added to the 100-point composite (weight × sub-score).
- Cash flow +30.0/30.0
- 1% rule +10.0/10.0
- DSCR +10.0/10.0
- ARV discount +7.5/15.0
- Livability +3.8/5.0
- Rent growth +3.2/5.0
- Schools +3.1/10.0
- Condition / age +2.5/5.0
- Appreciation +0.0/10.0
$106,000
🖨 Deal sheet 📄 Offer letter ✓ Due diligence
Listing remarks MLS
Opportunity is knocking at 609 Lufkin Circle! This 3-bedroom home in the established Hillendale neighborhood is ready for a complete transformation and offers incredible potential for investors, flippers, or buyers looking to create their dream home from the ground up. Featuring a covered front porch, screened porch for relaxing outdoor space, and a 2-car garage, the property has the footprint and features buyers are searching for. Inside, the home will require full renovation and is being sold as-is, making it the perfect project for those with vision and creativity. Conveniently located in Fayetteville with easy access to shopping, dining, and major routes, this is your chance to bring new life to a property with strong upside potential. Bring your contractor, your imagination, and see the possibilities!
Key facts
- Covered front porch
- Screened porch
- Full renovation
Tags
Property features AI
Exterior
- Parking: Attached garage; 2 garage spaces; 2 total parking spaces; Concrete parking surfaces
- Utilities: Public water; Sewer connected; Water connected
- Home design: Single family residence; Two-story home; Entry level: 1
- Construction: Wood siding and frame construction; Composition roof
- Exterior features: Screened patio/porch; Front porch; Rear porch; Back yard fencing; Has a view
Interior
- Bedrooms: 5 total rooms (includes bedrooms and living spaces)
- Flooring: Carpet; Vinyl
- Bathrooms: 3 full bathrooms
- Heating & cooling: Heat pump heating; Electric heating; Heat pump cooling
- Interior features: Other interior features; Crawl space basement
- Laundry & utility: Dedicated laundry room
Neighborhood map
What this means for you Summary
Snapshot
- This is a 3-bed/3.0-bath single-family listed at $106k.
Deal economics
- At list price, monthly cash flow is $518 ($6k/yr) — positive.
- The deal already cash-flows at list — no discount required.
- Meets the 1% rule at list price ($2k rent vs $106k).
- Cap rate 12.2% vs local median 4.9% in Fayetteville — top-decile yield for the area; either an underpriced asset or a hidden risk that comps aren't pricing in. Stress-test before assuming the spread holds.
Location & tenants
- Location reads 75/100 on livability (#45 in NC, #4,031 nationally) — a middle-class / working-renter tenant base. Strengths: commute A+, cost of living A+, housing A+; Watch: crime F, employment D-.
- Cumberland County Schools (urban): math 32% / reading 41% proficiency, ranked #126 of 178 in NC (top 71%) — families likely to look elsewhere, expect single-tenant / working-renter base with shorter leases.
- Zoned schools: Warrenwood Elementary (math 12% / reading 17%, grade F, #1,331 of 1,410 statewide, top 96%, 389 students, 99% FRL); Luther Nick Jeralds Middle (math 13% / reading 24%, grade F, #436 of 475 statewide, top 93%, 616 students, 100% FRL); E E Smith High (math 42% / reading 41%, grade F, #381 of 535 statewide, top 72%, 1,004 students, 99% FRL) — zoned schools average 99% FRL vs 55% district-wide (45 pts higher); higher-poverty schools than district average — tighter screening recommended.
- Market conditions: Rents rising (+2.8%/yr); 360 active listings in the ZIP; 20 comparable units currently listed for rent nearby; rentals at typical pace (median 23d on market — plan ~3-4 weeks tenant-placement turnaround); 1,125 units permitted in Cumberland County in 2024 (104 in 5+ unit buildings).
- This rent runs 34% of the median local income ($62k/yr) — at the standard rent-burdened threshold; future hikes will face affordability resistance.
Forward outlook
- Local home prices are declining (-3.0%/yr); year-one equity from $733 of loan paydown is wiped out by about $3k of value loss. Plan a longer hold.
- At projected returns (-3.0% appreciation + 2.8% rent growth), your $30k cash investment doubles in ~6 years — after that, you're playing with house money.
Negotiation context
- Only 9 days on market — expect competitive offers; lowballing is unlikely to land.
- 3 sale attempts since 10y ago with the ask held roughly flat each time — persistent listings suggest the price (not the market) is what's stuck; bring a comps-based counter.
Risks & watch-outs
- Watch-outs: property tax is 2.9% of price.
- Climate carrying-cost: major wind risk, 76% chance of damaging wind over 30y; extreme-heat days projected 7→16/yr by 2055 (HVAC capex compounding) — expect insurance premiums to compound above CPI over the hold.
Questions for the listing agent
- Property tax is high relative to price — has the assessment been appealed recently, and will the sale trigger a re-assessment?
- Is there a deadline driving the sale (1031 exchange, divorce, estate, relocation)? That informs how much negotiation room exists.
- Crime grade is F in this area — have there been break-ins, vandalism, or insurance claims at this property in the last 3 years? What carrier currently insures it and at what premium?
- What's the average days-on-market for RENTAL listings here right now (not sales)? A rising rental-DOM trend means longer vacancies and softer asking-rent achievability than the comps imply.
- What's the recent tenant-quality profile in this submarket — average credit score on applications, eviction rate, late-payment / NSF rate, and stable-employment percentage? A property-management company in the area should have these aggregated.
- How much new for-sale + rental construction is in the pipeline within 1–3 miles? Heavy new supply typically softens prices + rents 12–24 months out; constrained supply supports both.
Investment metrics
- 1% rule
- 1.64% ✓
- Cap rate
- 12.16%
- Cash-on-cash
- 20.95%
- DSCR
- 1.93
- GRM
- 5.1
CMA / ARV
- ARV (on-the-fly)
- $260,010
- Comps found
- 12
Show comp detail 12 sales within ~0.75 mi
| Address | Dist | Beds/Ba | Sqft | Sold | Price | $/sf | Match |
|---|---|---|---|---|---|---|---|
| 3252 Barksdale Rd | 0.38mi | 3/2.0 | 1,802 (-6%) | 1mo | $224,000 | $124 | 67 |
| 3824 Clearwater Dr | 0.46mi | 3/2.0 | 1,990 (+3%) | 4mo | $315,000 | $158 | 66 |
| 3524 Kelburn Dr | 0.63mi | 3/2.0 | 1,894 (-2%) | 2mo | $255,000 | $135 | 62 |
| 1132 Landau Rd | 0.61mi | 3/2.0 | 1,836 (-5%) | 3mo | $230,000 | $125 | 57 |
| 3520 Gables Dr | 0.66mi | 3/2.5 | 1,854 (-4%) | 5mo | $269,000 | $145 | 56 |
| 3721 Clearwater Dr | 0.37mi | 4/2.0 (+1) | 2,116 (+10%) | 2mo | $205,000 | $97 | 55 |
| 741 Southview Cir | 0.46mi | 3/2.0 | 2,135 (+11%) | 3mo | $288,000 | $135 | 53 |
| 3905 Clearwater Dr | 0.50mi | 3/2.0 | 1,675 (-13%) | 2mo | $211,000 | $126 | 49 |
| 487 Greywalls Ct | 0.61mi | 3/2.0 | 2,109 (+10%) | 3mo | $302,000 | $143 | 49 |
| 727 Ashburton Dr | 0.49mi | 4/3.0 (+1) | 2,173 (+13%) | 4mo | $274,900 | $127 | 47 |
| 705 Chadwick Rd | 0.47mi | 4/3.0 (+1) | 2,200 (+14%) | 4mo | $280,000 | $127 | 46 |
| 3538 Gables Dr | 0.71mi | 3/2.5 | 1,701 (-12%) | 3mo | $263,000 | $155 | 43 |
Match score weights: distance 35% · size 25% · config 20% · recency 20%. Top-matched comps best support the ARV.
Projected returns pro-forma
-3.0% appreciation · 2.82% rent growth · sell at horizon
- IRR
- 13.2%
- Equity multiple
- 1.53×
- Total profit
- $15,621
- Equity at exit
- $15,805
- IRR
- 22.0%
- Equity multiple
- 2.86×
- Total profit
- $55,241
- Equity at exit
- $9,165
Cash invested: $29,680 (down + closing). Projections, not guarantees.
Landlord ↔ Tenant lean methodology
- Overall (STATE)
- 85 Strongly Landlord-Friendly
- State North Carolina
- 85 Strongly Landlord-Friendly · R+3
- County
- — inherits STATE
- City
- — inherits STATE
ZIP-level market 28311
- Home prices YoY
- -18.4%
- Rents YoY
- 2.8%
- Active inventory
- 360
- Price-to-rent
- 5.1×
Monthly cashflow live
- Estimated rent
- $1,744 high interval (Pro) →
- Mortgage (P&I)
- −$556
- Tax from tax record
- −$259 /mo · $3,109/yr
- Insurance
- −$44
- HOA
- −$0
- Vacancy / Maint / Mgmt
- −$366
- Net cashflow
- $518
Break-even live
UW: 25.0% down · 7.5% · 30yr · 1.5% tax · 5.0% vac · 8.0% maint · 8.0% mgmt
Financing live
Cash to close
- Down payment
- $26,500
- Closing costs
- $3,180
- Reserves months
- —
- Total cash needed
- —
Loan-product check · same deal, 3 products live
Conventional
25% down · 7.5% · 30yr
- Down + closing
- —
- Monthly P&I
- —
- Monthly cashflow
- —
- DSCR
- —
- Eligible?
- —
Personal DTI + credit; lowest rate.
DSCR
20% down · 8.5% · 30yr
- Down + closing
- —
- Monthly P&I
- —
- Monthly cashflow
- —
- DSCR
- —
- Eligible?
- —
No personal income docs; deal must DSCR.
Hard money
10% down · 12.0% · 12mo
- Down + closing
- —
- Monthly P&I
- —
- Monthly cashflow
- —
- DSCR
- —
- Eligible?
- —
Short-term bridge; refi at stabilization.
Rent comps 20 comps
| Address | Beds | Baths | Sqft | Rent | $/sqft | DOM | Units | Dist |
|---|---|---|---|---|---|---|---|---|
| 3523 Rosehill Rd Fayetteville, NC | 4.0 | 1.0 | 1448 | $1,450 | $1.00 | 13d | 1 | 0.13mi |
| 3446 Sandystone Cir Fayetteville, NC | 3.0 | 2.5 | 1489 | $1,700 | $1.14 | 23d | 1 | 0.36mi |
| 3519 Rolls Ave Fayetteville, NC | 3.0 | 2.0 | 1625 | $1,700 | $1.05 | 13d | 1 | 0.45mi |
| 715 Ashburton Dr Fayetteville, NC | 3.0 | 2.0 | 1278 | $1,600 | $1.25 | 23d | 1 | 0.45mi |
| 3517 Gowan Ln Fayetteville, NC | 3.0 | 2.5 | 1792 | $1,750 | $0.98 | 23d | 1 | 0.61mi |
| 3611 Tindall Ct Fayetteville, NC | 3.0 | 2.0 | 1813 | $2,300 | $1.27 | 13d | 1 | 0.63mi |
| 3613 Pine Lake Dr Fayetteville, NC | 1.0–3.0 | 1.0–2.0 | 1116 | $1,645 | $1.47 | 13d | 31 | 0.64mi |
| 3963 Loufield Dr Fayetteville, NC | 3.0 | 2.0 | 1446 | $1,500 | $1.04 | 23d | 1 | 0.67mi |
| 632 Bromsworth Trl Fayetteville, NC | 3.0 | 2.5 | 2597 | $2,500 | $0.96 | 21d | 1 | 0.71mi |
| 1641 Mount Rainer Dr Fayetteville, NC | 3.0 | 2.5 | 2000 | $1,950 | $0.97 | 13d | 1 | 0.77mi |
| 1645 Mount Rainer Dr Fayetteville, NC | 4.0 | 2.5 | 2130 | $2,100 | $0.99 | 23d | 1 | 0.78mi |
| 1659 Rock Creek Ln Fayetteville, NC | 4.0 | 2.5 | 1777 | $2,100 | $1.18 | 13d | 1 | 0.86mi |
| 4016 Bankside Dr Fayetteville, NC | 3.0 | 2.5 | 1846 | $1,800 | $0.98 | 13d | 1 | 0.90mi |
| 3557 Hastings Dr Fayetteville, NC | 4.0 | 2.5 | 1652 | $1,795 | $1.09 | 23d | 1 | 0.94mi |
| 2532 Sourwood Dr Fayetteville, NC | 4.0 | 2.0 | 1562 | $1,700 | $1.09 | 23d | 1 | 0.95mi |
| 2523 Mulranny Dr Fayetteville, NC | 1.0–3.0 | 1.0–2.0 | 1112 | $1,589 | $1.43 | 13d | 9 | 1.29mi |
| 1216 Superior Pointe Pl Fayetteville, NC | 3.0 | 2.5 | 1288 | $1,450 | $1.13 | 23d | 1 | 1.29mi |
| 2641 McArthur Landing Cir Fayetteville, NC | 3.0 | 2.0 | 1450 | $1,500 | $1.03 | 23d | 1 | 1.46mi |
| 2641 McArthur Landing Cir #102 Fayetteville, NC | 3.0 | 2.0 | 1400 | $1,375 | $0.98 | 23d | 1 | 1.46mi |
| 2641 McArthur Landing Cir Fayetteville, NC | 3.0 | 2.0 | 1450 | $1,400 | $0.97 | 21d | 1 | 1.46mi |
Listing history 8 events
-
2026-06-18days on market $106,000 Active 9 DOM
-
2026-06-17days on market $106,000 Active 8 DOM
-
2026-06-16days on market $106,000 Active 7 DOM
-
2026-06-15days on market $106,000 Active 6 DOM
-
2026-06-14days on market $106,000 Active 4 DOM
-
2026-06-13days on market $106,000 Active 3 DOM
-
2026-06-10remarks 699-char remark
-
2026-06-10$106,000 Active 1 DOM
ⓘ Source: listings_history table (triggers on properties + properties_extension) + one-shot
backfill from property_details.listing_events for pre-trigger history.
Tax reassessment forecast NC · Resets to sale price
- Current annual tax
- $3,109 · $259/mo
- Projected year-2 tax
- $3,109 · $259/mo
- Expected delta
- $0/yr ($0/mo · 0.0%)
ⓘ Screening estimate from a state-policy table — verify with the county assessor before closing.
Climate risk First Street
- Flood 1/10 Low FEMA zone X (unshaded) · 0% chance over 30 yrs
- Wildfire 3/10 Moderate
- Heat 7/10 Severe 7 d/yr ≥106°F today · 16 d/yr by 30 yrs out
- Wind 7/10 Severe 76% chance of damaging wind over 30 yrs
- Air quality 2/10 Low 0 unhealthy d/yr today · 1 by 30 yrs out
Nearby sold comps map
Loading sold comps map…
Walkable amenities ~0.75 mi
Loading nearby amenities…
Taxation est. · year 1
- Rental income
- $20,922
- − Mortgage interest
- −$5,938
- − Property taxes
- −$3,109
- − Insurance
- −$530
- − Repairs & maintenance
- −$1,674
- − Management
- −$1,674
- − Depreciation
- −$3,084
- Taxable income
- $4,915
- Est. tax owed @ 24.0%
- −$1,179
- After-tax cash flow
- $5,040/yr
For passive investors: Depreciation is non-cash, so a rental often shows a tax loss while cash-flowing — sheltering income. Rental losses are passive: they offset passive income freely, and up to $25,000/yr can offset ordinary (W-2) income if you actively participate and your MAGI is under $100k (phasing out to $0 by $150k); unused losses carry forward. On sale, claimed depreciation is recaptured at up to 25%, and gains may owe capital-gains tax (a 1031 exchange can defer both). Figures are a year-1 estimate at your 24.0% rate — not tax advice; consult a CPA.
Schools (NCES district)
- District
- Cumberland County Schools
- NCES district ID
- 3700011
- Math proficiency
- 32% ▼ -2.00%
- Reading proficiency
- 41% ▼ -1.00%
- Median HH income
- $44,168
- Composite
- 31.0/100
- National rank
- #6096
- State rank
- #126 of 178 in NC
Livability — Fayetteville
- Score
- 75/100
- State rank
- #45
- US rank
- #4031
Category grades
Schools grade is shown separately in the Schools card above.
Census & demographics
- Census place
- Fayetteville, NC
- County
- Cumberland County · 265,314 people
- City population
- 226,118
- Metro
- Fayetteville, NC
- Population (ZIP)
- 36,629
- Household income
- $62,170
- Rent vs Own
- Severe rent burden
- 1645.0
Population outlook (Cumberland County) Hauer SSP2
- Today (2025)
- 330,855 people
- By 2030
- 333,523 · +0.8%
- By 2040
- 335,583 · +1.4%
- By 2050
- 335,325 · +1.4%
- By 2075
- 342,853 · +3.6%
- By 2100
- 340,698 · +3.0%
Race, ethnicity, and origin ACS 2023
- Neighborhood character
- Diverse neighborhood (Simpson 0.67)
- Race & ethnicity
- Black 42% White 38% Hispanic / Latino 9% Two or more races 8% Asian 3% Native American 1%
- Hispanic origin (detail)
- Mexican 3% Puerto Rican 4%
- Common ancestry
- Slovak 1% Lithuanian 1% Italian 1%
- Foreign-born
- 7% · Canada, South Korea, Jamaica
- Languages at home
- 89% English-only · Spanish 6% German/W. Germanic 1% Other Indo-European 1%
Political lean MEDSL · Cumberland
- 2024 margin
- D (+13.4) · D 56.1% · R 42.7% · Other 1.2%
- 2008→2024 swing
- -4.3pp toward R · 2008: 17.7pp · 2024: 13.4pp
- All cycles
- 2024: D+13.4 2020: D+16.6 2016: D+16.0 2012: D+19.7 2008: D+17.7
Not yet ingested
- Civics
- —
Market trends
- HPI YoY
- ▼ -45.88%
- Current HPI
- 203.0731
- Rent YoY
- ▲ 2.82%
- Metro
- Fayetteville, NC
- State GDP YoY
- ▲ 3.28%
- F500 in state
- 26
Industry mix (Fortune 500 HQ in NC)
| Industry | F500 HQs | Revenue |
|---|---|---|
| Financial Services | 2 | $213B |
|
||
| Retail | 2 | $95B |
|
||
| Industrial Conglomerate | 1 | $38B |
|
||
| Metals / Steel | 1 | $35B |
|
||
| Utilities | 1 | $30B |
|
||
| Industrial Machinery | 1 | $19B |
|
||
Price history
+17.8% since first listed7 events — show timeline
- 2026-06-09 Listed $106,000 LPRMLS
- 2026-06-09 Listed $106,000 Hive MLS
- 2017-04-01 Listing Removed — TMLS
- 2016-11-01 Listed $125,000 TMLS
- 1993-10-18 Sold (Public Records) $112,000 Public Records
- 1987-07-23 Sold (Public Records) $103,900 Public Records
- 1984-06-01 Sold (Public Records) $90,000 Public Records
Property tax history
+3.3%/yrLatest (2025): $3,109 · +25.8% YoY. Source: county tax records.
Cash-flow waterfall
monthlySold comps — $/sqft
last 12 mo · ≤1 miLoading sold comps…