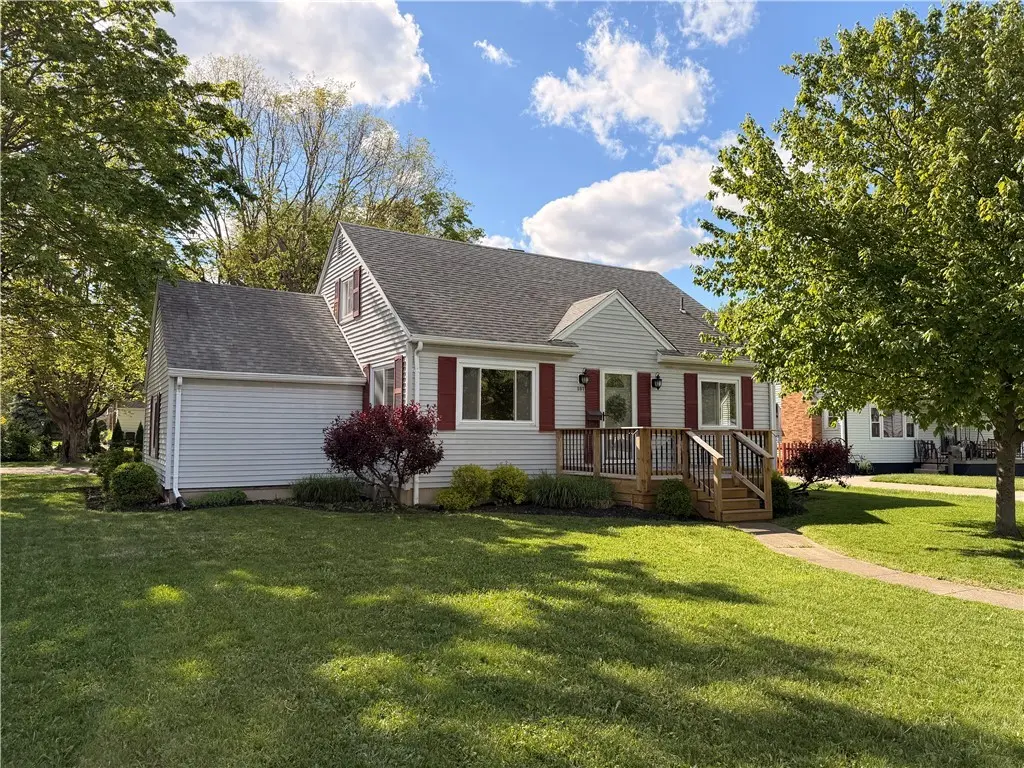
301 Tate Ave · Englewood, OH
Flood risk 1/10 · Minimal
- FEMA flood zone
- X (unshaded)
- Chance of flooding over 30 yrs
- 0.0%
- Est. flood insurance / yr
- $473 – $860
Fire risk 1/10 · Minimal
- Est. fire insurance / yr
- $713 – $1,323
Heat risk 3/10 · Minor
- Hot days now (above 100°F)
- 7 days/yr
- Hot days in 30 yrs
- 18 days/yr
Wind risk 2/10 · Minimal
- Chance of severe wind over 30 yrs
- —
Air-quality risk 2/10 · Minimal
- Unhealthy air days now
- 1 days/yr
- Unhealthy air days in 30 yrs
- 2 days/yr
Risk factors via First Street. Map © Google.
Why this score? — see what drove the D grade
The composite is a weighted blend of 9 inputs, each scored 0–100. Each bar is that input's sub-score; the figure is the points it added to the 100-point composite (weight × sub-score).
- Cash flow +16.4/30.0
- DSCR +5.1/10.0
- Schools +5.0/10.0
- ARV discount +4.9/15.0
- 1% rule +4.2/10.0
- Livability +3.5/5.0
- Condition / age +2.5/5.0
- Rent growth +2.4/5.0
- Appreciation +0.0/10.0
$212,900
🖨 Deal sheet 📄 Offer letter ✓ Due diligence
Listing remarks MLS
1.5 story on corner lot, hardwood floor, updated kitchen with ceramic tile floor and all appliances, vinyl replacement windows. Short sale, need quick sale. SOld as-is. Buyer to assume any city pre-sale requirements. See and make offer.
Key facts
- Spacious back deck
- Rear-loading garage
- Open layout
Tags
Property features AI
Finance
- Financial info: Offered for sale
Exterior
- Parking: Attached one-car garage with garage door opener
- Utilities: Natural gas available; Public water; Sewer available (storm sewer); Cable available
- Home design: Single-family property
- Construction: Vinyl siding; Wood siding; Full unfinished basement
- Exterior features: Deck; Storage; Shed(s); Irregular-shaped lot; Residential zoning
Interior
- Kitchen: Dishwasher; Microwave; Range; Refrigerator
- Bedrooms: Two bedrooms on the second level (each ~15 x 14); Two bedrooms on the main level (one ~10 x 11, one ~12 x 11)
- Bathrooms: One full bathroom on the main level
- Heating & cooling: Forced air heating (natural gas); Central air conditioning
- Interior features: Ceiling fan(s); Laminate counters; Pantry; Vinyl windows
- Laundry & utility: Gas water heater
Neighborhood map
What this means for you Summary
Snapshot
- This is a 4-bed/1.0-bath single-family listed at $213k.
Deal economics
- At list price, monthly cash flow is $122 ($1k/yr) — positive.
- The deal already cash-flows at list — no discount required.
- To meet the 1% rule (rent ≥ 1% of price), the offer needs to be $197k (7.5% below list).
- Recommended offer: $197k (7.5% below list) — sets the bar for 1% rule.
- Cap rate 7.0% vs local median 5.3% in Englewood — top-decile yield for the area; either an underpriced asset or a hidden risk that comps aren't pricing in. Stress-test before assuming the spread holds.
Location & tenants
- Location reads 69/100 on livability (#517 in OH) — a middle-class / working-renter tenant base. Strengths: cost of living A+, housing A+, schools A; Watch: employment C-, amenities F, commute F.
- Northmont City (suburban): math 52% / reading 62% proficiency, ranked #318 of 656 in OH (top 48%) — acceptable for families but not a draw, mixed tenant base, ~2y average lease.
- Market conditions: Rents soft (-0.5%/yr); 88 active listings in the ZIP; 4 comparable units currently listed for rent nearby; rentals at typical pace (median 14d on market — plan ~3-4 weeks tenant-placement turnaround); solid renter incomes; 907 units permitted in Montgomery County in 2024 (416 in 5+ unit buildings).
- This rent runs 31% of the median local income ($75k/yr) — at the standard rent-burdened threshold; future hikes will face affordability resistance.
Forward outlook
- Local home prices are declining (-3.0%/yr); year-one equity from $1k of loan paydown is wiped out by about $6k of value loss. Plan a longer hold.
- Montgomery County population projected at -10% by 2050 — secular population decline; favor cash flow + early exit over multi-decade hold.
Negotiation context
- It's been on market 19 days — a 2% lower offer ($210k) is reasonable based on typical stale-listing flexibility.
- 2 sale attempts since 12y ago with the ask held roughly flat each time — persistent listings suggest the price (not the market) is what's stuck; bring a comps-based counter.
- Current owner paid $38k; list at $213k implies a 468% gain — meaningful room to come down on a strong offer.
Risks & watch-outs
- Watch-outs: built in 1949 — expect roof / HVAC / electrical / plumbing capex.
Questions for the listing agent
- Built in 1949 — when were the roof, HVAC, electrical panel, plumbing, and water heater last replaced?
- Is there a deadline driving the sale (1031 exchange, divorce, estate, relocation)? That informs how much negotiation room exists.
- Schools are A-rated — typically a magnet for longer-tenancy family renters. What's the average tenant stay here, and is there a school-zone premium baked into asking?
- The area grade is low — what's the realistic commute time and amenity access for the typical tenant pool here? Any planned neighborhood developments (good or bad) we should know about?
- What's the average days-on-market for RENTAL listings here right now (not sales)? A rising rental-DOM trend means longer vacancies and softer asking-rent achievability than the comps imply.
- What's the recent tenant-quality profile in this submarket — average credit score on applications, eviction rate, late-payment / NSF rate, and stable-employment percentage? A property-management company in the area should have these aggregated.
- How much new for-sale + rental construction is in the pipeline within 1–3 miles? Heavy new supply typically softens prices + rents 12–24 months out; constrained supply supports both.
Investment metrics
- 1% rule
- 0.92% ✗
- Cap rate
- 6.98%
- Cash-on-cash
- 2.45%
- DSCR
- 1.11
- GRM
- 9.0
CMA / ARV
- ARV (median comp)
- $201,338
- List price
- $212,900
- Delta
- 5.74%
- Verdict
- FAIR
- Comps
- 20 within 1.0 mi
Show comp detail 12 sales within ~0.75 mi
| Address | Dist | Beds/Ba | Sqft | Sold | Price | $/sf | Match |
|---|---|---|---|---|---|---|---|
| 515 Wolf Ave | 0.09mi | 4/2.0 | 1,354 (+2%) | 0mo | $210,000 | $155 | 89 |
| 307 N Walnut St | 0.44mi | 3/2.0 (-1) | 1,378 (+3%) | 1mo | $237,500 | $172 | 64 |
| 108 Tate Ave | 0.24mi | 3/1.5 (-1) | 1,200 (-10%) | 8mo | $214,000 | $178 | 59 |
| 206 Lodestone Dr | 0.45mi | 3/2.0 (-1) | 1,378 (+3%) | 7mo | $222,500 | $161 | 58 |
| 502 S Main St | 0.46mi | 3/2.0 (-1) | 1,408 (+6%) | 3mo | $227,500 | $162 | 58 |
| 208 S Walnut St | 0.15mi | 3/2.0 (-1) | 1,521 (+14%) | 6mo | $254,900 | $168 | 55 |
| 607 Albert St | 0.32mi | 3/1.0 (-1) | 1,512 (+13%) | 6mo | $155,000 | $103 | 52 |
| 524 Koerner Ave | 0.59mi | 3/1.5 (-1) | 1,435 (+8%) | 6mo | $189,969 | $132 | 48 |
| 508 Korner Ave | 0.58mi | 3/2.0 (-1) | 1,450 (+9%) | 5mo | $229,900 | $159 | 45 |
| 104 Overla Blvd | 0.73mi | 3/2.0 (-1) | 1,440 (+8%) | 1mo | $237,000 | $165 | 42 |
| 552 Unger Ave | 0.57mi | 3/2.0 (-1) | 1,486 (+12%) | 4mo | $195,000 | $131 | 42 |
| 806 Mcgraw Ct | 0.70mi | 3/1.5 (-1) | 1,520 (+14%) | 2mo | $277,500 | $183 | 35 |
Match score weights: distance 35% · size 25% · config 20% · recency 20%. Top-matched comps best support the ARV.
Projected returns pro-forma
-3.0% appreciation · 0.0% rent growth · sell at horizon
- IRR
- -15.8%
- Equity multiple
- 0.45×
- Total profit
- $-32,505
- Equity at exit
- $31,744
- IRR
- -13.5%
- Equity multiple
- 0.32×
- Total profit
- $-40,585
- Equity at exit
- $18,408
Cash invested: $59,612 (down + closing). Projections, not guarantees.
Landlord ↔ Tenant lean methodology
- Overall (STATE)
- 73 Landlord-Friendly
- State Ohio
- 73 Landlord-Friendly · R+6
- County
- — inherits STATE
- City
- — inherits STATE
ZIP-level market 45322
- Rents YoY
- -0.5%
- Active inventory
- 88
- Price-to-rent
- 9.0×
Monthly cashflow live
- Estimated rent
- $1,968 medium interval (Pro) →
- Mortgage (P&I)
- −$1,116
- Tax from tax record
- −$228 /mo · $2,737/yr
- Insurance
- −$89
- HOA
- −$0
- Vacancy / Maint / Mgmt
- −$413
- Net cashflow
- $122
Break-even live
UW: 25.0% down · 7.5% · 30yr · 1.5% tax · 5.0% vac · 8.0% maint · 8.0% mgmt
Financing live
Cash to close
- Down payment
- $53,225
- Closing costs
- $6,387
- Reserves months
- —
- Total cash needed
- —
Loan-product check · same deal, 3 products live
Conventional
25% down · 7.5% · 30yr
- Down + closing
- —
- Monthly P&I
- —
- Monthly cashflow
- —
- DSCR
- —
- Eligible?
- —
Personal DTI + credit; lowest rate.
DSCR
20% down · 8.5% · 30yr
- Down + closing
- —
- Monthly P&I
- —
- Monthly cashflow
- —
- DSCR
- —
- Eligible?
- —
No personal income docs; deal must DSCR.
Hard money
10% down · 12.0% · 12mo
- Down + closing
- —
- Monthly P&I
- —
- Monthly cashflow
- —
- DSCR
- —
- Eligible?
- —
Short-term bridge; refi at stabilization.
Rent comps 4 comps
| Address | Beds | Baths | Sqft | Rent | $/sqft | DOM | Units | Dist |
|---|---|---|---|---|---|---|---|---|
| 25 Orchard Ave Englewood, OH | 3.0 | 1.5 | 989 | $1,495 | $1.51 | 2d | 1 | 0.23mi |
| 603 Rolice Ct Englewood, OH | 3.0 | 2.0 | 1449 | $2,000 | $1.38 | 21d | 1 | 0.65mi |
| 416 W Wenger Rd Englewood, OH | 3.0 | 1.5 | 1249 | $2,000 | $1.60 | 2d | 1 | 1.00mi |
| 321 Lauren Circle Dr Englewood, OH | 3.0 | 2.0 | 1400 | $1,700 | $1.21 | 14d | 1 | 1.20mi |
Listing history 6 events
-
2026-04-30$212,900 Active 939-char remark
-
2015-01-13soldstatus $37,500 236-char remark
Show marketing remark (236 chars)
1.5 story on corner lot, hardwood floor, updated kitchen with ceramic tile floor and all appliances, vinyl replacement windows. Short sale, need quick sale. SOld as-is. Buyer to assume any city pre-sale requirements. See and make offer.
-
2015-01-13soldstatus $37,500 Closed 236-char remark
Show marketing remark (236 chars)
1.5 story on corner lot, hardwood floor, updated kitchen with ceramic tile floor and all appliances, vinyl replacement windows. Short sale, need quick sale. SOld as-is. Buyer to assume any city pre-sale requirements. See and make offer.
-
2014-12-30historical 236-char remark
Show marketing remark (236 chars)
1.5 story on corner lot, hardwood floor, updated kitchen with ceramic tile floor and all appliances, vinyl replacement windows. Short sale, need quick sale. SOld as-is. Buyer to assume any city pre-sale requirements. See and make offer.
-
2014-06-20$49,900 236-char remark
Show marketing remark (236 chars)
1.5 story on corner lot, hardwood floor, updated kitchen with ceramic tile floor and all appliances, vinyl replacement windows. Short sale, need quick sale. SOld as-is. Buyer to assume any city pre-sale requirements. See and make offer.
-
1981-05-19soldstatus $22,000
ⓘ Source: listings_history table (triggers on properties + properties_extension) + one-shot
backfill from property_details.listing_events for pre-trigger history.
Tax reassessment forecast OH · Partial reset (capped growth)
- Current annual tax
- $2,737 · $228/mo
- Projected year-2 tax
- $3,029 · $252/mo
- Expected delta
- +$292/yr (+$24/mo · 10.7%)
ⓘ Screening estimate from a state-policy table — verify with the county assessor before closing.
Climate risk First Street
- Flood 1/10 Low FEMA zone X (unshaded) · 0% chance over 30 yrs
- Wildfire 1/10 Low
- Heat 3/10 Moderate 7 d/yr ≥100°F today · 18 d/yr by 30 yrs out
- Wind 2/10 Low
- Air quality 2/10 Low 1 unhealthy d/yr today · 2 by 30 yrs out
Nearby sold comps map
Loading sold comps map…
Walkable amenities ~0.75 mi
Loading nearby amenities…
Taxation est. · year 1
- Rental income
- $23,621
- − Mortgage interest
- −$11,926
- − Property taxes
- −$2,737
- − Insurance
- −$1,064
- − Repairs & maintenance
- −$1,890
- − Management
- −$1,890
- − Depreciation
- −$6,193
- Taxable loss
- −$2,079
- Est. tax savings @ 24.0%
- +$499
- After-tax cash flow
- $1,960/yr
For passive investors: Depreciation is non-cash, so a rental often shows a tax loss while cash-flowing — sheltering income. Rental losses are passive: they offset passive income freely, and up to $25,000/yr can offset ordinary (W-2) income if you actively participate and your MAGI is under $100k (phasing out to $0 by $150k); unused losses carry forward. On sale, claimed depreciation is recaptured at up to 25%, and gains may owe capital-gains tax (a 1031 exchange can defer both). Figures are a year-1 estimate at your 24.0% rate — not tax advice; consult a CPA.
Schools (NCES district)
- District
- Northmont City
- NCES district ID
- 3904872
- Math proficiency
- 52% ▼ -15.00%
- Reading proficiency
- 62% ▼ -8.00%
- Median HH income
- $60,230
- Composite
- 49.53/100
- National rank
- #1995
- State rank
- #318 of 656 in OH
Livability — Englewood
- Score
- 69/100
- State rank
- #517
- US rank
- #8768
Category grades
Schools grade is shown separately in the Schools card above.
Census & demographics
- Census place
- Englewood, OH
- County
- Montgomery County · 459,541 people
- City population
- 20,884
- Metro
- Dayton-Kettering, OH
- Population (ZIP)
- 20,884
- Household income
- $75,349
- Rent vs Own
- Severe rent burden
- 357.0
Population outlook (Montgomery County) Hauer SSP2
- Today (2025)
- 523,241 people
- By 2030
- 514,948 · -1.6%
- By 2040
- 493,378 · -5.7%
- By 2050
- 469,639 · -10.2%
- By 2075
- 418,360 · -20.0%
- By 2100
- 353,315 · -32.5%
Race, ethnicity, and origin ACS 2023
- Neighborhood character
- Predominantly White (80%)
- Race & ethnicity
- White 80% Black 11% Two or more races 6% Hispanic / Latino 3% Asian 1%
- Common ancestry
- Lithuanian 2% Slovak 2% Romanian 1%
- Foreign-born
- 3% · China, Canada
- Languages at home
- 96% English-only · Spanish 2%
Political lean MEDSL · Montgomery
- 2024 margin
- Toss-up / Even · D 49.8% · R 49.3%
- 2008→2024 swing
- -5.8pp toward R · 2008: 6.2pp · 2024: 0.5pp
- All cycles
- 2024: D+0.5 2020: D+2.2 2016: R+1.2 2012: D+3.1 2008: D+6.2
Not yet ingested
- Civics
- —
Market trends
- HPI YoY
- ▼ -176.42%
- Current HPI
- 218.5409
- Rent YoY
- ▼ -0.45%
- Metro
- Dayton-Kettering, OH
- State GDP YoY
- ▲ 1.98%
- F500 in state
- 48
Industry mix (Fortune 500 HQ in OH)
| Industry | F500 HQs | Revenue |
|---|---|---|
| Insurance | 3 | $145B |
|
||
| Industrial Machinery | 3 | $49B |
|
||
| Financial Services | 3 | $24B |
|
||
| Consumer Goods | 2 | $93B |
|
||
| Aerospace / Defense | 2 | $47B |
|
||
| Utilities | 2 | $33B |
|
||
Price history
+867.7% since first listed7 events — show timeline
- 2026-05-19 Pending — Dayton MLS
- 2026-04-30 Listed $212,900 Dayton MLS
- 2015-01-13 Sold (MLS) $37,500 Dayton MLS
- 2015-01-13 Sold (MLS) $37,500 Dayton MLS
- 2014-12-30 Listing Removed — Dayton MLS
- 2014-06-20 Listed $49,900 Dayton MLS
- 1981-05-19 Sold (Public Records) $22,000 Public Records
Property tax history
+3.7%/yrLatest (2025): $2,737 · +5.6% YoY. Source: county tax records.
Cash-flow waterfall
monthlySold comps — $/sqft
last 12 mo · ≤1 miLoading sold comps…