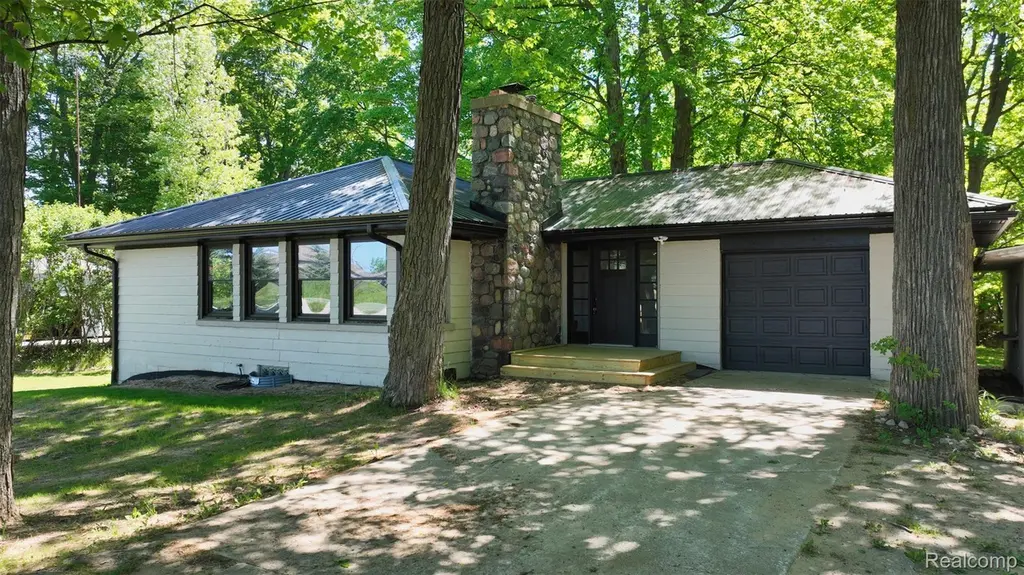
1351 Cedar Ct · Gladwin, MI
Flood risk 1/10 · Minimal
- FEMA flood zone
- X (unshaded)
- Chance of flooding over 30 yrs
- 0.0%
- Est. flood insurance / yr
- $473 – $860
Fire risk 3/10 · Minor
- Est. fire insurance / yr
- $784 – $1,456
Heat risk 2/10 · Minimal
- Hot days now (above 96°F)
- 7 days/yr
- Hot days in 30 yrs
- 14 days/yr
Wind risk 1/10 · Minimal
- Chance of severe wind over 30 yrs
- —
Air-quality risk 2/10 · Minimal
- Unhealthy air days now
- 1 days/yr
- Unhealthy air days in 30 yrs
- 1 days/yr
Risk factors via First Street. Map © Google.
Why this score? — see what drove the C+ grade
The composite is a weighted blend of 9 inputs, each scored 0–100. Each bar is that input's sub-score; the figure is the points it added to the 100-point composite (weight × sub-score).
- Cash flow +22.9/30.0
- ARV discount +15.0/15.0
- DSCR +7.4/10.0
- 1% rule +5.0/10.0
- Livability +3.6/5.0
- Schools +3.3/10.0
- Rent growth +2.5/5.0
- Condition / age +2.5/5.0
- Appreciation +0.0/10.0
$204,900
🖨 Deal sheet 📄 Offer letter ✓ Due diligence
Listing remarks MLS
Welcome to 1351 Cedar Court – the home you've been waiting for! Completely remodeled and truly move-in ready, this stunning 3-bedroom, 2 full-bath ranch offers the perfect blend of modern updates and comfortable living. Featuring 1,440 square feet of beautifully renovated main-level living space plus an additional 1,000 square feet in the finished walkout basement, there's plenty of room for entertaining, relaxing, and everyday living. Recent improvements include a new metal roof, updated electrical and plumbing with PEX, re-excavated and resealed foundation, new windows throughout, new flooring, new kitchen cabinetry, updated fixtures, and ceiling fans. The spacious kitchen comes complete with stainless-steel appliances, along with a new washer and dryer for added convenience. Stay comfortable year-round with forced-air heating, and enjoy cozy evenings by the wood-burning fireplace in the living room. Walkout basement, a stylish wet bar with granite countertops, creating the perfect space for entertaining family and friends. Connected to city water and sewer, this home offers peace of mind and low-maintenance living with virtually every major update already completed. Opportunities like this don't come along often - schedule your private showing today before this exceptional home is gone! BATVAI
Key facts
- Move-in ready
- Remodeled
- New metal roof
Tags
Property features AI
Exterior
- Parking: Attached garage with direct access (1 car)
- Utilities: Public water; Public sewer
- Home design: Single family residence; One level with ground-level entry and steps; Facing/entry at ground level with steps
- Construction: Metal roof; Built with other construction materials; Block foundation; Originally constructed (one-story) with finished living area above and additional finished area below
- Exterior features: Paved road access; Pets allowed
Interior
- Kitchen: Dishwasher; Microwave; Free‑standing electric range; Free‑standing refrigerator
- Bathrooms: Two full bathrooms
- Heating & cooling: Forced air heating; Natural gas heating; Wood stove heating; Ceiling fan(s) for cooling; Has heating
- Interior features: Gas water heater; Stainless steel appliances; Partially finished basement with walk-out access; Wood burning stove in living room fireplace; Ceiling fans
- Laundry & utility: Washer hookup; Electric dryer hookup
Neighborhood map
What this means for you Summary
Snapshot
- This is a 3-bed/2.0-bath single-family listed at $205k.
Deal economics
- At list price, monthly cash flow is $360 ($4k/yr) — positive.
- The deal already cash-flows at list — no discount required.
- To meet the 1% rule (rent ≥ 1% of price), the offer needs to be $205k (0.1% below list).
- Recommended offer: $205k (0.1% below list) — sets the bar for 1% rule.
Location & tenants
- Location reads 72/100 on livability (#253 in MI) — a middle-class / working-renter tenant base. Strengths: cost of living A+, housing A+, health & safety A+; Watch: crime F, amenities F, commute F.
- Gladwin Community Schools (town): math 28% / reading 51% proficiency, ranked #232 of 540 in MI (top 43%) — families likely to look elsewhere, expect single-tenant / working-renter base with shorter leases.
- Market conditions: 287 active listings in the ZIP; 90 units permitted in Gladwin County in 2024 (0 in 5+ unit buildings).
Forward outlook
- Local home prices are declining (-3.0%/yr); year-one equity from $1k of loan paydown is wiped out by about $6k of value loss. Plan a longer hold.
- Gladwin County population projected at -25% by 2050 — secular population decline; favor cash flow + early exit over multi-decade hold.
Negotiation context
- Only 14 days on market — expect competitive offers; lowballing is unlikely to land.
- 6 sale attempts since 20y ago with the ask held roughly flat each time — persistent listings suggest the price (not the market) is what's stuck; bring a comps-based counter.
- Current owner paid $55k; list at $205k implies a 273% gain — meaningful room to come down on a strong offer.
Risks & watch-outs
- Watch-outs: built in 1949 — expect roof / HVAC / electrical / plumbing capex.
Questions for the listing agent
- Built in 1949 — when were the roof, HVAC, electrical panel, plumbing, and water heater last replaced?
- Is there a deadline driving the sale (1031 exchange, divorce, estate, relocation)? That informs how much negotiation room exists.
- Crime grade is F in this area — have there been break-ins, vandalism, or insurance claims at this property in the last 3 years? What carrier currently insures it and at what premium?
- What's the average days-on-market for RENTAL listings here right now (not sales)? A rising rental-DOM trend means longer vacancies and softer asking-rent achievability than the comps imply.
- What's the recent tenant-quality profile in this submarket — average credit score on applications, eviction rate, late-payment / NSF rate, and stable-employment percentage? A property-management company in the area should have these aggregated.
- How much new for-sale + rental construction is in the pipeline within 1–3 miles? Heavy new supply typically softens prices + rents 12–24 months out; constrained supply supports both.
Investment metrics
- 1% rule
- 1.00% ✗
- Cap rate
- 8.40%
- Cash-on-cash
- 7.54%
- DSCR
- 1.34
- GRM
- 8.3
CMA / ARV
- ARV (on-the-fly)
- $264,320
- Comps found
- 2
Show comp detail 2 sales within ~0.75 mi
| Address | Dist | Beds/Ba | Sqft | Sold | Price | $/sf | Match |
|---|---|---|---|---|---|---|---|
| 429 St Andrews Ct | 0.37mi | 3/2.0 | 2,240 (0%) | 2mo | $265,000 | $118 | 82 |
| 1351 Cedar Ct | 0.00mi | 2/1.5 (-1) | 2,040 (-9%) | 19mo | $55,000 | $27 | 62 |
Match score weights: distance 35% · size 25% · config 20% · recency 20%. Top-matched comps best support the ARV.
Projected returns pro-forma
-3.0% appreciation · 3.0% rent growth · sell at horizon
- IRR
- -4.8%
- Equity multiple
- 0.82×
- Total profit
- $-10,312
- Equity at exit
- $30,551
- IRR
- 4.8%
- Equity multiple
- 1.35×
- Total profit
- $20,308
- Equity at exit
- $17,716
Cash invested: $57,372 (down + closing). Projections, not guarantees.
Landlord ↔ Tenant lean methodology
- Overall (STATE)
- 62 Landlord-Friendly
- State Michigan
- 62 Landlord-Friendly · EVEN
- County
- — inherits STATE
- City
- — inherits STATE
ZIP-level market 48624
- Home prices YoY
- -23.4%
- Active inventory
- 287
- Price-to-rent
- 8.3×
Monthly cashflow live
- Estimated rent
- $2,047 medium interval (Pro) →
- Mortgage (P&I)
- −$1,075
- Tax from tax record
- −$97 /mo · $1,158/yr
- Insurance
- −$85
- HOA
- −$0
- Vacancy / Maint / Mgmt
- −$430
- Net cashflow
- $360
Break-even live
UW: 25.0% down · 7.5% · 30yr · 1.5% tax · 5.0% vac · 8.0% maint · 8.0% mgmt
Financing live
Cash to close
- Down payment
- $51,225
- Closing costs
- $6,147
- Reserves months
- —
- Total cash needed
- —
Loan-product check · same deal, 3 products live
Conventional
25% down · 7.5% · 30yr
- Down + closing
- —
- Monthly P&I
- —
- Monthly cashflow
- —
- DSCR
- —
- Eligible?
- —
Personal DTI + credit; lowest rate.
DSCR
20% down · 8.5% · 30yr
- Down + closing
- —
- Monthly P&I
- —
- Monthly cashflow
- —
- DSCR
- —
- Eligible?
- —
No personal income docs; deal must DSCR.
Hard money
10% down · 12.0% · 12mo
- Down + closing
- —
- Monthly P&I
- —
- Monthly cashflow
- —
- DSCR
- —
- Eligible?
- —
Short-term bridge; refi at stabilization.
Listing history 11 events
-
2026-06-18days on market $204,900 Active 14 DOM
-
2026-06-17days on market $204,900 Active 13 DOM
-
2026-06-16days on market $204,900 Active 12 DOM
-
2026-06-15days on market $204,900 Active 11 DOM
-
2026-06-13days on market $204,900 Active 9 DOM
-
2026-06-12days on market $204,900 Active 8 DOM
-
2026-06-09days on market $204,900 Active 5 DOM
-
2026-06-08days on market $204,900 Active 4 DOM
-
2026-06-07days on market $204,900 Active 3 DOM
-
2026-06-07remarks 693-char remark
-
2026-06-07$204,900 Active 2 DOM
ⓘ Source: listings_history table (triggers on properties + properties_extension) + one-shot
backfill from property_details.listing_events for pre-trigger history.
Tax reassessment forecast MI · Partial reset (capped growth)
- Current annual tax
- $1,158 · $97/mo
- Projected year-2 tax
- $2,157 · $180/mo
- Expected delta
- +$999/yr (+$83/mo · 86.2%)
ⓘ Screening estimate from a state-policy table — verify with the county assessor before closing.
Climate risk First Street
- Flood 1/10 Low FEMA zone X (unshaded) · 0% chance over 30 yrs
- Wildfire 3/10 Moderate
- Heat 2/10 Low 7 d/yr ≥96°F today · 14 d/yr by 30 yrs out
- Wind 1/10 Low
- Air quality 2/10 Low 1 unhealthy d/yr today · 1 by 30 yrs out
Nearby sold comps map
Loading sold comps map…
Walkable amenities ~0.75 mi
Loading nearby amenities…
Taxation est. · year 1
- Rental income
- $24,560
- − Mortgage interest
- −$11,478
- − Property taxes
- −$1,158
- − Insurance
- −$1,024
- − Repairs & maintenance
- −$1,965
- − Management
- −$1,965
- − Depreciation
- −$5,961
- Taxable income
- $1,009
- Est. tax owed @ 24.0%
- −$242
- After-tax cash flow
- $4,083/yr
For passive investors: Depreciation is non-cash, so a rental often shows a tax loss while cash-flowing — sheltering income. Rental losses are passive: they offset passive income freely, and up to $25,000/yr can offset ordinary (W-2) income if you actively participate and your MAGI is under $100k (phasing out to $0 by $150k); unused losses carry forward. On sale, claimed depreciation is recaptured at up to 25%, and gains may owe capital-gains tax (a 1031 exchange can defer both). Figures are a year-1 estimate at your 24.0% rate — not tax advice; consult a CPA.
Schools (NCES district)
- District
- Gladwin Community Schools
- NCES district ID
- 2615990
- Math proficiency
- 28% ▼ -13.00%
- Reading proficiency
- 51% ▼ -2.00%
- Median HH income
- $38,917
- Composite
- 32.93/100
- National rank
- #5595
- State rank
- #232 of 540 in MI
Livability — Gladwin
- Score
- 72/100
- State rank
- #253
- US rank
- #6296
Category grades
Schools grade is shown separately in the Schools card above.
Census & demographics
- Census place
- Gladwin, MI
- Population (ZIP)
- 16,269
Population outlook (Gladwin County) Hauer SSP2
- Today (2025)
- 23,440 people
- By 2030
- 22,281 · -4.9%
- By 2040
- 19,867 · -15.2%
- By 2050
- 17,667 · -24.6%
- By 2075
- 12,909 · -44.9%
- By 2100
- 8,629 · -63.2%
Race, ethnicity, and origin ACS 2023
- Neighborhood character
- Predominantly White (94%)
- Race & ethnicity
- White 94% Two or more races 4% Hispanic / Latino 2%
- Common ancestry
- Romanian 8% Lithuanian 3% Iranian 3%
- Foreign-born
- 1%
- Languages at home
- 95% English-only · German/W. Germanic 4% Spanish 1%
Political lean MEDSL · Gladwin
- 2024 margin
- Solid R (+40.7) · D 29.1% · R 69.8% · Other 1.1%
- 2008→2024 swing
- -42.2pp toward R · 2008: 1.5pp · 2024: -40.7pp
- All cycles
- 2024: R+40.7 2020: R+36.8 2016: R+34.7 2012: R+7.2 2008: D+1.5
Not yet ingested
- Civics
- —
Market trends
- HPI YoY
- ▼ -72.67%
- Current HPI
- 238.0744
- Rent YoY
- —
- Metro
- —
- State GDP YoY
- ▲ 1.37%
- F500 in state
- 28
Industry mix (Fortune 500 HQ in MI)
| Industry | F500 HQs | Revenue |
|---|---|---|
| Automotive Parts | 3 | $48B |
|
||
| Automotive | 2 | $372B |
|
||
| Chemicals | 1 | $45B |
|
||
| Automotive Retail | 1 | $29B |
|
||
| Healthcare / Medical Devices | 1 | $23B |
|
||
| Automotive Technology | 1 | $20B |
|
||
Price history
+95.3% since first listed13 events — show timeline
- 2026-06-04 Listed $204,900 REALCOMP
- 2026-06-04 Listed $204,900 MiRealSource-MiMLS
- 2024-12-09 Sold (Public Records) $55,000 Public Records
- 2024-11-27 Sold (MLS) $55,000 MiRealSource-MiMLS
- 2024-11-27 Sold (MLS) $55,000 REALCOMP
- 2024-11-21 Pending — REALCOMP
- 2024-11-21 Pending — MiRealSource-MiMLS
- 2024-11-18 Listed $59,900 MiRealSource-MiMLS
- 2024-11-18 Listed $59,900 REALCOMP
- 2009-06-19 Sold (Public Records) $72,000 Public Records
- 2007-07-13 Listed $86,900 MiRealSource-MiMLS
- 2007-06-16 Listing Removed — MiRealSource-MiMLS
- 2006-12-18 Listed $104,900 MiRealSource-MiMLS
Property tax history
+2.2%/yrLatest (2025): $1,158 · -14.3% YoY. Source: county tax records.
Cash-flow waterfall
monthlySold comps — $/sqft
last 12 mo · ≤1 miLoading sold comps…