13384 Peaceful Rd · Jacksonville, FL
Flood risk 1/10 · Minimal
- FEMA flood zone
- X (unshaded)
- Chance of flooding over 30 yrs
- 0.0%
- Est. flood insurance / yr
- $507 – $1,088
Fire risk 6/10 · Moderate
- Est. fire insurance / yr
- $947 – $1,759
Heat risk 9/10 · Severe
- Hot days now (above 106°F)
- 7 days/yr
- Hot days in 30 yrs
- 20 days/yr
Wind risk 9/10 · Severe
- Chance of severe wind over 30 yrs
- 99.0%
Air-quality risk 5/10 · Moderate
- Unhealthy air days now
- 6 days/yr
- Unhealthy air days in 30 yrs
- 6 days/yr
Risk factors via First Street. Map © Google.
Why this score? — see what drove the B- grade
The composite is a weighted blend of 9 inputs, each scored 0–100. Each bar is that input's sub-score; the figure is the points it added to the 100-point composite (weight × sub-score).
- Cash flow +24.9/30.0
- ARV discount +15.0/15.0
- DSCR +8.1/10.0
- 1% rule +7.1/10.0
- Livability +4.2/5.0
- Schools +3.9/10.0
- Rent growth +2.7/5.0
- Condition / age +2.5/5.0
- Appreciation +0.0/10.0
$190,000
🖨 Deal sheet (PDF) 📄 Offer letter ✓ Due diligence
Listing remarks
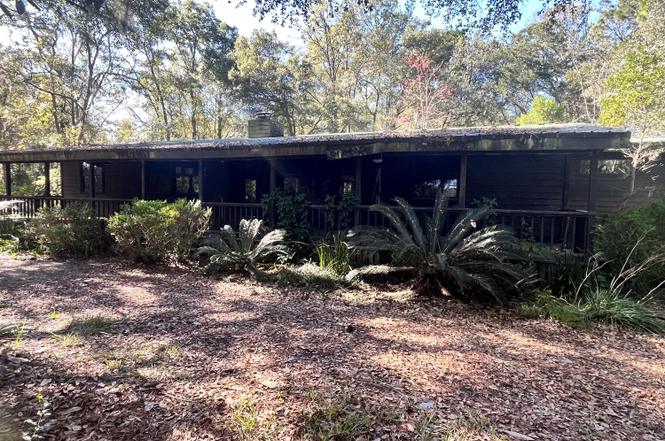
Come explore this double-wide manufactured home situated on approximately 2.67 acres across two parcels. The property features a covered front porch, living room with a fireplace, split floor plan, separate dining area, galley-style kitchen, two primary suites each with a full bathroom, an additional flex room, and a rear porch.
Key facts
- Covered front porch
- Galley-style kitchen
- Split floor plan
Tags
Neighborhood map
What this means for you Summary
Snapshot
- This is a 3-bed/2.0-bath manufactured listed at $190k.
Deal economics
- At list price, monthly cash flow is $406 ($5k/yr) — positive.
- The deal already cash-flows at list — no discount required.
- Meets the 1% rule at list price ($2k rent vs $190k).
- Cap rate 8.9% vs local median 3.9% in Jacksonville — top-decile yield for the area; either an underpriced asset or a hidden risk that comps aren't pricing in. Stress-test before assuming the spread holds.
Location & tenants
- Location reads 83/100 on livability (#50 in FL, #911 nationally) — a professional / high-income tenant draw. Strengths: amenities A+, commute A+, housing A+.
- Duval (urban): math 46% / reading 45% proficiency, ranked #48 of 73 in FL (top 66%) — families likely to look elsewhere, expect single-tenant / working-renter base with shorter leases.
- Zoned schools: New Berlin Elementary School (math 74% / reading 67%, grade A-, #333 of 2,144 statewide, top 16%, 1,200 students, 36% FRL); Oceanway School (math 34% / reading 33%, grade F, #428 of 571 statewide, top 76%, 927 students, 51% FRL); First Coast High School (math 18% / reading 33%, grade F, #499 of 667 statewide, top 75%, 2,117 students, 49% FRL) — zoned schools at 45% FRL track the district average.
- Market conditions: Rents flat; 258 active listings in the ZIP; 23 comparable units currently listed for rent nearby; rentals at typical pace (median 16d on market — plan ~3-4 weeks tenant-placement turnaround); high-income renter base; 6,503 units permitted in Duval County in 2024 (1,131 in 5+ unit buildings).
Forward outlook
- Local home prices are declining (-3.0%/yr); year-one equity from $1k of loan paydown is wiped out by about $6k of value loss. Plan a longer hold.
- Duval County population projected at +19% by 2050 — long-run rental-demand tailwind backs the buy-and-hold thesis.
Negotiation context
- Only 12 days on market — expect competitive offers; lowballing is unlikely to land.
- Current owner paid $35k; list at $190k implies a 443% gain — meaningful room to come down on a strong offer.
Risks & watch-outs
- Climate carrying-cost: severe wind risk, 99% chance of damaging wind over 30y; major wildfire risk; extreme-heat days projected 7→20/yr by 2055 (HVAC capex compounding) — expect insurance premiums to compound above CPI over the hold.
Questions for the listing agent
- Is there a deadline driving the sale (1031 exchange, divorce, estate, relocation)? That informs how much negotiation room exists.
- Schools are B-rated — typically a magnet for longer-tenancy family renters. What's the average tenant stay here, and is there a school-zone premium baked into asking?
- What's the average days-on-market for RENTAL listings here right now (not sales)? A rising rental-DOM trend means longer vacancies and softer asking-rent achievability than the comps imply.
- What's the recent tenant-quality profile in this submarket — average credit score on applications, eviction rate, late-payment / NSF rate, and stable-employment percentage? A property-management company in the area should have these aggregated.
- How much new for-sale + rental construction is in the pipeline within 1–3 miles? Heavy new supply typically softens prices + rents 12–24 months out; constrained supply supports both.
Investment metrics
- 1% rule
- 1.21% ✓
- Cap rate
- 8.86%
- Cash-on-cash
- 9.16%
- DSCR
- 1.41
- GRM
- 6.9
CMA / ARV
- ARV (on-the-fly)
- $368,382
- Comps found
- 1
Show comp detail 1 sale within ~0.75 mi
| Address | Dist | Beds/Ba | Sqft | Sold | Price | $/sf | Match |
|---|---|---|---|---|---|---|---|
| 13135 Yellow Bluff Rd | 0.35mi | 4/2.5 (+1) | 1,820 (-12%) | 5mo | $326,000 | $179 | 53 |
Match score weights: distance 35% · size 25% · config 20% · recency 20%. Top-matched comps best support the ARV.
Projected returns pro-forma
-3.0% appreciation · 0.98% rent growth · sell at horizon
- IRR
- -4.9%
- Equity multiple
- 0.82×
- Total profit
- $-9,429
- Equity at exit
- $28,330
- IRR
- 2.2%
- Equity multiple
- 1.14×
- Total profit
- $7,385
- Equity at exit
- $16,428
Cash invested: $53,200 (down + closing). Projections, not guarantees.
Landlord ↔ Tenant lean methodology
- Overall (STATE)
- 87 Strongly Landlord-Friendly
- State Florida
- 87 Strongly Landlord-Friendly · R+3
- County
- — inherits STATE
- City
- — inherits STATE
ZIP-level market 32226
- Home prices YoY
- -31.6%
- Rents YoY
- 1.0%
- Active inventory
- 258
- Price-to-rent
- 6.9×
Monthly cashflow live
- Estimated rent
- $2,304 high interval (Pro) →
- Mortgage (P&I)
- −$996
- Tax from tax record
- −$339 /mo · $4,064/yr
- Insurance
- −$79
- HOA
- −$0
- Vacancy / Maint / Mgmt
- −$484
- Net cashflow
- $406
Break-even live
Sensitivity live
| Price | -10% $513 | -5% $460 | +0% $406 | +5% $352 | +10% $298 |
|---|---|---|---|---|---|
| Rent | -10% $224 | -5% $315 | +0% $406 | +5% $497 | +10% $588 |
| Rate | -1.0pp $502 | -0.5pp $454 | base $406 | +0.5pp $357 | +1.0pp $307 |
UW: 25.0% down · 7.5% · 30yr · 1.5% tax · 5.0% vac · 8.0% maint · 8.0% mgmt
Financing live
Cash to close
- Down payment
- $47,500
- Closing costs
- $5,700
- Reserves months
- —
- Total cash needed
- —
Loan-product check · same deal, 3 products live
Conventional
25% down · 7.5% · 30yr
- Down + closing
- —
- Monthly P&I
- —
- Monthly cashflow
- —
- DSCR
- —
- Eligible?
- —
Personal DTI + credit; lowest rate.
DSCR
20% down · 8.5% · 30yr
- Down + closing
- —
- Monthly P&I
- —
- Monthly cashflow
- —
- DSCR
- —
- Eligible?
- —
No personal income docs; deal must DSCR.
Hard money
10% down · 12.0% · 12mo
- Down + closing
- —
- Monthly P&I
- —
- Monthly cashflow
- —
- DSCR
- —
- Eligible?
- —
Short-term bridge; refi at stabilization.
Rent comps 23 comps
| Address | Beds | Baths | Sqft | Rent | $/sqft | DOM | Units | Dist |
|---|---|---|---|---|---|---|---|---|
| 13510 Foxwood Height Cir E Jacksonville, FL | 3.0 | 2.0 | 1772 | $1,850 | $1.04 | 25d | 1 | 0.19mi |
| 13668 Chipperfield Ln Jacksonville, FL | 4.0 | 2.5 | 2451 | $2,091 | $0.85 | 15d | 1 | 0.54mi |
| 13658 Kayak Ct Jacksonville, FL | 3.0 | 2.0 | 1710 | $2,100 | $1.23 | 13d | 1 | 0.56mi |
| 3410 Guernsey Ct Jacksonville, FL | 3.0 | 2.0 | 1712 | $1,990 | $1.16 | 25d | 1 | 0.62mi |
| 13319 Smithwick Ln Jacksonville, FL | 4.0 | 2.0 | 1798 | $2,131 | $1.19 | 25d | 1 | 0.66mi |
| 3504 Ayrshire St Jacksonville, FL | 3.0 | 2.5 | 1998 | $2,305 | $1.15 | 16d | 1 | 0.67mi |
| 13737 Devan Lee Dr N Jacksonville, FL | 4.0 | 2.0 | 2151 | $2,026 | $0.94 | 22d | 1 | 0.70mi |
| 12791 John Crest Ct Jacksonville, FL | 3.0 | 2.0 | 1490 | $2,095 | $1.41 | 13d | 1 | 0.81mi |
| 12740 Black Angus Dr Jacksonville, FL | 3.0 | 2.0 | 1406 | $1,929 | $1.37 | 9d | 1 | 0.85mi |
| 12633 White Cedar Trl Jacksonville, FL | 3.0 | 2.0 | 1735 | $2,200 | $1.27 | 5d | 1 | 0.89mi |
| 13730 Fish Eagle Dr W Jacksonville, FL | 4.0 | 2.0 | 1839 | $2,049 | $1.11 | 4d | 1 | 1.08mi |
| 3411 Glenn Hollow Ct Unit TP Jacksonville, FL | 3.0 | 2.0 | 1592 | $2,250 | $1.41 | 25d | 1 | 1.10mi |
| 12288 Black Walnut Ct Jacksonville, FL | 3.0 | 2.5 | 1432 | $2,000 | $1.40 | 9d | 1 | 1.24mi |
| 12677 Pine Marsh Way Jacksonville, FL | 4.0 | 2.0 | 2550 | $2,950 | $1.16 | 9d | 1 | 1.33mi |
| 12677 Pine Marsh Way Jacksonville, FL | 4.0 | 2.5 | 2550 | $2,950 | $1.16 | 13d | 1 | 1.33mi |
| 3488 Hickory Landing Ct Jacksonville, FL | 4.0 | 2.0 | 1874 | $2,106 | $1.12 | 22d | 1 | 1.34mi |
| 3500 Hickory Landing Ct Jacksonville, FL | 4.0 | 2.5 | 2356 | $2,116 | $0.90 | 15d | 1 | 1.36mi |
| 12334 Water Tupelo Rd Jacksonville, FL | 3.0 | 2.5 | 1886 | $3,000 | $1.59 | 9d | 1 | 1.37mi |
| 12284 Peanut Ct Jacksonville, FL | 4.0 | 3.0 | 2075 | $2,300 | $1.11 | 25d | 1 | 1.39mi |
| 12284 Hickory Forest Rd Jacksonville, FL | 4.0 | 2.0 | 2381 | $2,295 | $0.96 | 25d | 1 | 1.41mi |
| 14298 Fish Eagle Dr E Jacksonville, FL | 3.0 | 2.0 | 1823 | $1,925 | $1.06 | 25d | 1 | 1.42mi |
| 2159 Hudson Grove Dr Jacksonville, FL | 3.0 | 2.0 | 1903 | $2,385 | $1.25 | 5d | 1 | 1.47mi |
| 1125 Arcaro Ct Jacksonville, FL | 3.0 | 2.0 | 1839 | $2,135 | $1.16 | 3d | 1 | 1.50mi |
Listing history 4 events
-
2026-01-22status Pending
-
2026-01-10$190,000 Active
-
1992-04-17soldstatus $35,000
-
1985-03-01soldstatus $20,000
ⓘ Source: listings_history table (triggers on properties + properties_extension) + one-shot
backfill from property_details.listing_events for pre-trigger history.
Tax reassessment forecast FL · Resets to sale price
- Current annual tax
- $4,064 · $339/mo
- Projected year-2 tax
- $4,064 · $339/mo
- Expected delta
- $0/yr ($0/mo · 0.0%)
ⓘ Screening estimate from a state-policy table — verify with the county assessor before closing.
Climate risk First Street
- Flood 1/10 Low FEMA zone X (unshaded) · 0% chance over 30 yrs
- Wildfire 6/10 Major
- Heat 9/10 Extreme 7 d/yr ≥106°F today · 20 d/yr by 30 yrs out
- Wind 9/10 Extreme 99% chance of damaging wind over 30 yrs
- Air quality 5/10 Major 6 unhealthy d/yr today · 6 by 30 yrs out
Nearby sold comps map
Loading sold comps map…
Walkable amenities ~0.75 mi
Loading nearby amenities…
Taxation est. · year 1
- Rental income
- $27,647
- − Mortgage interest
- −$10,643
- − Property taxes
- −$4,064
- − Insurance
- −$950
- − Repairs & maintenance
- −$2,212
- − Management
- −$2,212
- − Depreciation
- −$5,527
- Taxable income
- $2,040
- Est. tax owed @ 24.0%
- −$490
- After-tax cash flow
- $4,381/yr
For passive investors: Depreciation is non-cash, so a rental often shows a tax loss while cash-flowing — sheltering income. Rental losses are passive: they offset passive income freely, and up to $25,000/yr can offset ordinary (W-2) income if you actively participate and your MAGI is under $100k (phasing out to $0 by $150k); unused losses carry forward. On sale, claimed depreciation is recaptured at up to 25%, and gains may owe capital-gains tax (a 1031 exchange can defer both). Figures are a year-1 estimate at your 24.0% rate — not tax advice; consult a CPA.
Schools (NCES district)
- District
- Duval
- NCES district ID
- 1200480
- Math proficiency
- 46% ▼ -11.00%
- Reading proficiency
- 45% ▼ -4.00%
- Median HH income
- $48,987
- Composite
- 38.97/100
- National rank
- #4076
- State rank
- #48 of 73 in FL
Livability — Jacksonville
- Score
- 83/100
- State rank
- #50
- US rank
- #911
Category grades
Schools grade is shown separately in the Schools card above.
Census & demographics
- Census place
- Jacksonville, FL
- County
- Duval County · 1,015,274 people
- City population
- 979,034
- Metro
- Jacksonville, FL
- Population (ZIP)
- 21,256
- Household income
- $110,179
- Rent vs Own
- Severe rent burden
- 277.0
Population outlook (Duval County) Hauer SSP2
- Today (2025)
- 1,013,010 people
- By 2030
- 1,059,228 · +4.6%
- By 2040
- 1,141,439 · +12.7%
- By 2050
- 1,205,258 · +19.0%
- By 2075
- 1,324,282 · +30.7%
- By 2100
- 1,319,620 · +30.3%
Race, ethnicity, and origin ACS 2023
- Neighborhood character
- Predominantly White (65%)
- Race & ethnicity
- White 65% Black 19% Two or more races 7% Hispanic / Latino 7% Asian 3%
- Hispanic origin (detail)
- Mexican 3% Puerto Rican 1%
- Common ancestry
- Italian 3% Lithuanian 3% Slovak 2%
- Foreign-born
- 6% · Canada, China
- Languages at home
- 91% English-only · Spanish 5% French/Haitian/Cajun 2% Arabic 1%
Political lean MEDSL · Duval
- 2024 margin
- Toss-up / Even · D 48.7% · R 50.1% · Other 1.2%
- 2008→2024 swing
- +0.4pp no change · 2008: -1.9pp · 2024: -1.5pp
- All cycles
- 2024: R+1.5 2020: D+3.8 2016: R+1.5 2012: R+3.6 2008: R+1.9
Not yet ingested
- Civics
- —
Market trends
- HPI YoY
- ▼ -123.39%
- Current HPI
- 266.9967
- Rent YoY
- ▲ 0.98%
- Metro
- Jacksonville, FL
- State GDP YoY
- ▲ 3.28%
- F500 in state
- 36
Industry mix (Fortune 500 HQ in FL)
| Industry | F500 HQs | Revenue |
|---|---|---|
| Industrial Technology | 2 | $29B |
|
||
| Insurance | 2 | $17B |
|
||
| Retail | 1 | $60B |
|
||
| Technology Distribution | 1 | $58B |
|
||
| Homebuilding | 1 | $35B |
|
||
| Technology Manufacturing | 1 | $35B |
|
||
Price history
+850.0% since first listed4 events — show timeline
- 2026-01-22 Pending — realMLS
- 2026-01-10 Listed $190,000 realMLS
- 1992-04-17 Sold (Public Records) $35,000 Public Records
- 1985-03-01 Sold (Public Records) $20,000 Public Records
Property tax history
+17.0%/yrLatest (2025): $4,064 · +13.8% YoY. Source: county tax records.
Cash-flow waterfall
monthlySold comps — $/sqft
last 12 mo · ≤1 miLoading sold comps…