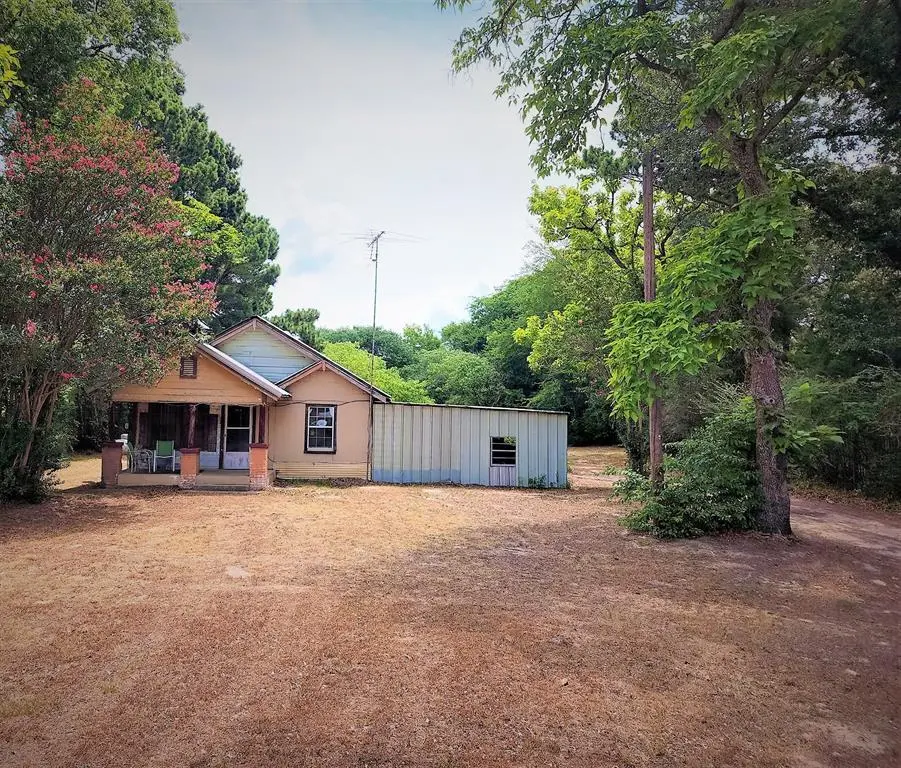
2110 Fm 275 · Emory, TX
Flood risk 1/10 · Minimal
- FEMA flood zone
- X (unshaded)
- Chance of flooding over 30 yrs
- 0.0%
- Est. flood insurance / yr
- $507 – $1,088
Fire risk 3/10 · Minor
- Est. fire insurance / yr
- $1,222 – $2,270
Heat risk 7/10 · Major
- Hot days now (above 109°F)
- 7 days/yr
- Hot days in 30 yrs
- 24 days/yr
Wind risk 6/10 · Moderate
- Chance of severe wind over 30 yrs
- 27.0%
Air-quality risk 2/10 · Minimal
- Unhealthy air days now
- 0 days/yr
- Unhealthy air days in 30 yrs
- 1 days/yr
Risk factors via First Street. Map © Google.
Why this score? — see what drove the B- grade
The composite is a weighted blend of 9 inputs, each scored 0–100. Each bar is that input's sub-score; the figure is the points it added to the 100-point composite (weight × sub-score).
- Cash flow +29.4/30.0
- DSCR +10.0/10.0
- 1% rule +7.7/10.0
- ARV discount +7.5/15.0
- Livability +3.4/5.0
- Rent growth +2.5/5.0
- Condition / age +2.5/5.0
- Schools +2.2/10.0
- Appreciation +0.0/10.0
$100,000
🖨 Deal sheet 📄 Offer letter ✓ Due diligence
Listing remarks
Home situated on an acre lot plus two additional lots totaling 2.1 acres suitable for horses or cattle plus a pond for a water source for livestock. Tremendous value in the land for many scenario's you just have to have to the vision to make it come to fruition! Value is primarily in the land. House needs work.
Key facts
- 2.19 acre lot
- 3 parking spots
- Built 1940
Property features AI
Finance
- Other: Property on multiple parcels; Will not subdivide
- Financial info: Treat as clear loan type; No second mortgage; Listing terms include cash and conventional
- HOA & community: No association
Exterior
- Parking: Attached covered carport (3 covered/carport spaces)
- Utilities: City water; City sewer; Propane
- Home design: Single-family residence; Residential property; Attached property; Built in 1940; One story
- Construction: Frame, siding, and wood construction; Block and Bois D'Arc post foundation; Other roof
- Exterior features: Barbed wire fencing; Acreage lot (about 2.19 acres)
Interior
- Kitchen: Gas range; Refrigerator
- Bedrooms: Primary bedroom on main level (12 x 12); Total of 1 bedroom
- Flooring: Carpet flooring
- Bathrooms: 1 full bathroom
- Heating & cooling: Propane heating; Ceiling fan(s); Other cooling
- Interior features: One-level layout; Two living areas; One dining area; Other interior features
Neighborhood map
What this means for you Summary
Snapshot
- This is a 1-bed/1.0-bath single-family listed at $100k.
Deal economics
- At list price, monthly cash flow is $354 ($4k/yr) — positive.
- The deal already cash-flows at list — no discount required.
- Meets the 1% rule at list price ($1k rent vs $100k).
- Recommended offer: $88k (12.0% below list) — sets the bar for market timing.
- Cap rate 10.5% vs local median 2.2% in Emory — top-decile yield for the area; either an underpriced asset or a hidden risk that comps aren't pricing in. Stress-test before assuming the spread holds.
Location & tenants
- Location reads 67/100 on livability (#529 in TX) — a middle-class / working-renter tenant base. Strengths: cost of living A+, housing A+, crime B; Watch: schools F, amenities F, commute F.
- Rains ISD (rural): math 22% / reading 30% proficiency, ranked #697 of 826 in TX (top 84%) — low school quality limits family demand, transient renter base, plan for 1-2y turnover.
- Market conditions: 180 active listings in the ZIP; 21 units permitted in Rains County in 2024 (0 in 5+ unit buildings).
Forward outlook
- Local home prices are declining (-3.0%/yr); year-one equity from $691 of loan paydown is wiped out by about $3k of value loss. Plan a longer hold.
- At projected returns (-3.0% appreciation + 3.0% rent growth), your $28k cash investment doubles in ~8 years — after that, you're playing with house money.
Negotiation context
- It's been on market 1444 days — a 12% lower offer ($88k) is reasonable based on typical stale-listing flexibility.
Risks & watch-outs
- Watch-outs: built in 1940 — expect roof / HVAC / electrical / plumbing capex.
- Climate carrying-cost: major wind risk, 27% chance of damaging wind over 30y; extreme-heat days projected 7→24/yr by 2055 (HVAC capex compounding) — expect insurance premiums to compound above CPI over the hold.
Questions for the listing agent
- It's been on market 1444 days. Have you received any prior offers? Is the seller open to a 12% concession, seller financing, or rate buy-down credit?
- Built in 1940 — when were the roof, HVAC, electrical panel, plumbing, and water heater last replaced?
- Why hasn't it sold? Are there any deal-killer items the seller is aware of (foundation, flood, title, zoning, code violations)?
- Is there a deadline driving the sale (1031 exchange, divorce, estate, relocation)? That informs how much negotiation room exists.
- Schools are F-rated, which usually means shorter tenancies and higher turnover. Who's the typical renter profile here, and what's been the actual vacancy rate?
- What's the average days-on-market for RENTAL listings here right now (not sales)? A rising rental-DOM trend means longer vacancies and softer asking-rent achievability than the comps imply.
- What's the recent tenant-quality profile in this submarket — average credit score on applications, eviction rate, late-payment / NSF rate, and stable-employment percentage? A property-management company in the area should have these aggregated.
- How much new for-sale + rental construction is in the pipeline within 1–3 miles? Heavy new supply typically softens prices + rents 12–24 months out; constrained supply supports both.
Investment metrics
- 1% rule
- 1.27% ✓
- Cap rate
- 10.54%
- Cash-on-cash
- 15.18%
- DSCR
- 1.68
- GRM
- 6.5
CMA / ARV
No comps found within radius.
Projected returns pro-forma
-3.0% appreciation · 3.0% rent growth · sell at horizon
- IRR
- 5.8%
- Equity multiple
- 1.23×
- Total profit
- $6,343
- Equity at exit
- $14,910
- IRR
- 15.2%
- Equity multiple
- 2.23×
- Total profit
- $34,545
- Equity at exit
- $8,646
Cash invested: $28,000 (down + closing). Projections, not guarantees.
Landlord ↔ Tenant lean methodology
- Overall (STATE)
- 87 Strongly Landlord-Friendly
- State Texas
- 87 Strongly Landlord-Friendly · R+5
- County
- — inherits STATE
- City
- — inherits STATE
ZIP-level market 75440
- Home prices YoY
- -12.2%
- Active inventory
- 180
- Price-to-rent
- 6.5×
Monthly cashflow live
- Estimated rent
- $1,274 medium interval (Pro) →
- Mortgage (P&I)
- −$524
- Tax from tax record
- −$86 /mo · $1,036/yr
- Insurance
- −$42
- HOA
- −$0
- Vacancy / Maint / Mgmt
- −$268
- Net cashflow
- $354
Break-even live
UW: 25.0% down · 7.5% · 30yr · 1.5% tax · 5.0% vac · 8.0% maint · 8.0% mgmt
Financing live
Cash to close
- Down payment
- $25,000
- Closing costs
- $3,000
- Reserves months
- —
- Total cash needed
- —
Loan-product check · same deal, 3 products live
Conventional
25% down · 7.5% · 30yr
- Down + closing
- —
- Monthly P&I
- —
- Monthly cashflow
- —
- DSCR
- —
- Eligible?
- —
Personal DTI + credit; lowest rate.
DSCR
20% down · 8.5% · 30yr
- Down + closing
- —
- Monthly P&I
- —
- Monthly cashflow
- —
- DSCR
- —
- Eligible?
- —
No personal income docs; deal must DSCR.
Hard money
10% down · 12.0% · 12mo
- Down + closing
- —
- Monthly P&I
- —
- Monthly cashflow
- —
- DSCR
- —
- Eligible?
- —
Short-term bridge; refi at stabilization.
Listing history 20 events
-
2026-06-19days on market $100,000 Active 1444 DOM
-
2026-06-18days on market $100,000 Active 1443 DOM
-
2026-06-17days on market $100,000 Active 1442 DOM
-
2026-06-16days on market $100,000 Active 1441 DOM
-
2026-06-15days on market $100,000 Active 1440 DOM
-
2026-06-14days on market $100,000 Active 1438 DOM
-
2026-06-12days on market $100,000 Active 1437 DOM
-
2026-06-09days on market $100,000 Active 1434 DOM
-
2026-06-08days on market $100,000 Active 1433 DOM
-
2026-06-07days on market $100,000 Active 1432 DOM
-
2026-06-07days on market $100,000 Active 1431 DOM
-
2026-06-03days on market $100,000 Active 1428 DOM
-
2026-06-02days on market $100,000 Active 1427 DOM
-
2026-06-01days on market $100,000 Active 1426 DOM
-
2026-05-31days on market $100,000 Active 1425 DOM
-
2026-05-30days on market $100,000 Active 1424 DOM
-
2026-01-04price $100,000
-
2025-05-09price $160,000
-
2025-01-13price $200,000
-
2022-07-05$250,000 Active
ⓘ Source: listings_history table (triggers on properties + properties_extension) + one-shot
backfill from property_details.listing_events for pre-trigger history.
Tax reassessment forecast TX · Resets to sale price
- Current annual tax
- $1,036 · $86/mo
- Projected year-2 tax
- $1,830 · $152/mo
- Expected delta
- +$794/yr (+$66/mo · 76.6%)
ⓘ Screening estimate from a state-policy table — verify with the county assessor before closing.
Climate risk First Street
- Flood 1/10 Low FEMA zone X (unshaded) · 0% chance over 30 yrs
- Wildfire 3/10 Moderate
- Heat 7/10 Severe 7 d/yr ≥109°F today · 24 d/yr by 30 yrs out
- Wind 6/10 Major 27% chance of damaging wind over 30 yrs
- Air quality 2/10 Low 0 unhealthy d/yr today · 1 by 30 yrs out
Nearby sold comps map
Loading sold comps map…
Walkable amenities ~0.75 mi
Loading nearby amenities…
Taxation est. · year 1
- Rental income
- $15,289
- − Mortgage interest
- −$5,602
- − Property taxes
- −$1,036
- − Insurance
- −$500
- − Repairs & maintenance
- −$1,223
- − Management
- −$1,223
- − Depreciation
- −$2,909
- Taxable income
- $2,796
- Est. tax owed @ 24.0%
- −$671
- After-tax cash flow
- $3,578/yr
For passive investors: Depreciation is non-cash, so a rental often shows a tax loss while cash-flowing — sheltering income. Rental losses are passive: they offset passive income freely, and up to $25,000/yr can offset ordinary (W-2) income if you actively participate and your MAGI is under $100k (phasing out to $0 by $150k); unused losses carry forward. On sale, claimed depreciation is recaptured at up to 25%, and gains may owe capital-gains tax (a 1031 exchange can defer both). Figures are a year-1 estimate at your 24.0% rate — not tax advice; consult a CPA.
Schools (NCES district)
- District
- Rains ISD
- NCES district ID
- 4836360
- Math proficiency
- 22% ▼ -20.00%
- Reading proficiency
- 30% ▼ -10.00%
- Median HH income
- $45,836
- Composite
- 22.46/100
- National rank
- #8106
- State rank
- #697 of 826 in TX
Livability — Emory
- Score
- 67/100
- State rank
- #529
- US rank
- #10352
Category grades
Schools grade is shown separately in the Schools card above.
Census & demographics
- Population (ZIP)
- 7,480
Population outlook (Rains County) Hauer SSP2
- Today (2025)
- 11,516 people
- By 2030
- 11,610 · +0.8%
- By 2040
- 11,622 · +0.9%
- By 2050
- 11,329 · -1.6%
- By 2075
- 10,390 · -9.8%
- By 2100
- 8,809 · -23.5%
Race, ethnicity, and origin ACS 2023
- Neighborhood character
- Predominantly White (85%)
- Race & ethnicity
- White 85% Hispanic / Latino 8% Two or more races 6% Black 3% Asian 1%
- Hispanic origin (detail)
- Mexican 7%
- Common ancestry
- Lithuanian 3% Slovak 2% Iranian 1%
- Foreign-born
- 4% · Canada, China
- Languages at home
- 95% English-only · Spanish 4% Chinese 1%
Political lean MEDSL · Rains
- 2024 margin
- Solid R (+72.9) · D 13.3% · R 86.2%
- 2008→2024 swing
- -23.4pp toward R · 2008: -49.5pp · 2024: -72.9pp
- All cycles
- 2024: R+72.9 2020: R+71.2 2016: R+71.3 2012: R+61.8 2008: R+49.5
Not yet ingested
- Civics
- —
Market trends
- HPI YoY
- ▼ -29.08%
- Current HPI
- 208.6245
- Rent YoY
- —
- Metro
- —
- State GDP YoY
- ▲ 3.95%
- F500 in state
- 110
Industry mix (Fortune 500 HQ in TX)
| Industry | F500 HQs | Revenue |
|---|---|---|
| Energy | 16 | $1,198B |
|
||
| Technology | 5 | $198B |
|
||
| Engineering / Construction | 4 | $72B |
|
||
| Energy Services | 3 | $60B |
|
||
| Utilities | 3 | $41B |
|
||
| Healthcare | 2 | $330B |
|
||
Price history
-60.0% since first listed4 events — show timeline
- 2026-01-04 Price Changed $100,000 NTREIS
- 2025-05-09 Price Changed $160,000 NTREIS
- 2025-01-13 Price Changed $200,000 NTREIS
- 2022-07-05 Listed $250,000 NTREIS
Property tax history
+4.3%/yrLatest (2025): $1,036 · +18.6% YoY. Source: county tax records.
Cash-flow waterfall
monthlySold comps — $/sqft
last 12 mo · ≤1 miLoading sold comps…