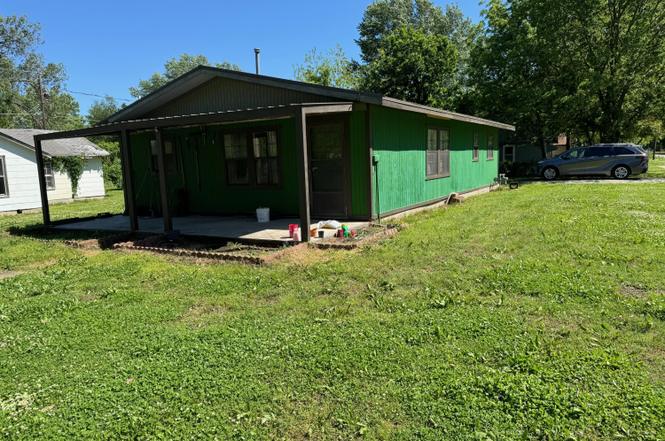
639 W 6th St · Baxter Springs, KS
Flood risk 1/10 · Minimal
- FEMA flood zone
- X (unshaded)
- Chance of flooding over 30 yrs
- 0.0%
- Est. flood insurance / yr
- $507 – $1,088
Fire risk 7/10 · Major
- Est. fire insurance / yr
- $1,154 – $2,142
Heat risk 5/10 · Moderate
- Hot days now (above 108°F)
- 7 days/yr
- Hot days in 30 yrs
- 20 days/yr
Wind risk 2/10 · Minimal
- Chance of severe wind over 30 yrs
- 2.0%
Air-quality risk 2/10 · Minimal
- Unhealthy air days now
- 1 days/yr
- Unhealthy air days in 30 yrs
- 1 days/yr
Risk factors via First Street. Map © Google.
Why this score? — see what drove the D grade
The composite is a weighted blend of 9 inputs, each scored 0–100. Each bar is that input's sub-score; the figure is the points it added to the 100-point composite (weight × sub-score).
- Cash flow +13.9/30.0
- ARV discount +7.5/15.0
- DSCR +4.2/10.0
- Livability +3.8/5.0
- 1% rule +3.4/10.0
- Schools +2.9/10.0
- Rent growth +2.5/5.0
- Condition / age +2.5/5.0
- Appreciation +0.0/10.0
$94,900
🖨 Deal sheet (PDF) 📄 Offer letter ✓ Due diligence
Listing remarks MLS
None. For comp use only.
Key facts
- <remodeled in 2017>
- <corner lot>
- 5,500 sq ft lot
Tags
Property features AI
Exterior
- Parking: Driveway parking
- Utilities: Public sewer
- Home design: Single-family detached residence
- Construction: Slab foundation
- Exterior features: Corner lot; No fencing; Metal roof
Interior
- Bedrooms: Total of 5 rooms (bedroom count not specified)
- Flooring: Laminate
- Bathrooms: 1 full bathroom
- Heating & cooling: Natural gas heating; Central heating; Has cooling
- Interior features: Laminate flooring; No fireplace
Neighborhood map
What this means for you Summary
Snapshot
- This is a 3-bed/1.0-bath single-family listed at $95k.
Deal economics
- At list price, monthly cash flow is $10 ($119/yr) — positive.
- The deal already cash-flows at list — no discount required.
- To meet the 1% rule (rent ≥ 1% of price), the offer needs to be $80k (16.2% below list).
- Recommended offer: $80k (16.2% below list) — sets the bar for 1% rule.
Location & tenants
- Location reads 75/100 on livability (#63 in KS, #3,952 nationally) — a middle-class / working-renter tenant base. Strengths: cost of living A+, housing A+, health & safety A+; Watch: employment D, schools F, amenities F.
- Baxter Springs (town): math 31% / reading 39% proficiency, ranked #64 of 169 in KS (top 38%) — families likely to look elsewhere, expect single-tenant / working-renter base with shorter leases.
- Market conditions: 54 active listings in the ZIP; 1 comparable units currently listed for rent nearby; 17 units permitted in Cherokee County in 2024 (0 in 5+ unit buildings).
Forward outlook
- Local home prices are declining (-3.0%/yr); year-one equity from $656 of loan paydown is wiped out by about $3k of value loss. Plan a longer hold.
- Cherokee County population projected at -26% by 2050 — secular population decline; favor cash flow + early exit over multi-decade hold.
Negotiation context
- It's been on market 772 days — a 12% lower offer ($84k) is reasonable based on typical stale-listing flexibility.
- 5 sale attempts since 12y ago; this cycle's ask has dropped $35k (27%) from the opening price — seller is motivated, your offer sets the floor, not the list.
Risks & watch-outs
- Climate carrying-cost: major wildfire risk; extreme-heat days projected 7→20/yr by 2055 (HVAC capex compounding) — expect insurance premiums to compound above CPI over the hold.
Questions for the listing agent
- It's been on market 772 days. Have you received any prior offers? Is the seller open to a 16% concession, seller financing, or rate buy-down credit?
- Why hasn't it sold? Are there any deal-killer items the seller is aware of (foundation, flood, title, zoning, code violations)?
- Is there a deadline driving the sale (1031 exchange, divorce, estate, relocation)? That informs how much negotiation room exists.
- Schools are F-rated, which usually means shorter tenancies and higher turnover. Who's the typical renter profile here, and what's been the actual vacancy rate?
- The area grade is low — what's the realistic commute time and amenity access for the typical tenant pool here? Any planned neighborhood developments (good or bad) we should know about?
- What's the average days-on-market for RENTAL listings here right now (not sales)? A rising rental-DOM trend means longer vacancies and softer asking-rent achievability than the comps imply.
- What's the recent tenant-quality profile in this submarket — average credit score on applications, eviction rate, late-payment / NSF rate, and stable-employment percentage? A property-management company in the area should have these aggregated.
- How much new for-sale + rental construction is in the pipeline within 1–3 miles? Heavy new supply typically softens prices + rents 12–24 months out; constrained supply supports both.
Investment metrics
- 1% rule
- 0.84% ✗
- Cap rate
- 6.42%
- Cash-on-cash
- 0.45%
- DSCR
- 1.02
- GRM
- 9.9
CMA / ARV
No comps found within radius.
Projected returns pro-forma
-3.0% appreciation · 3.0% rent growth · sell at horizon
- IRR
- -15.6%
- Equity multiple
- 0.44×
- Total profit
- $-14,759
- Equity at exit
- $14,150
- IRR
- -7.2%
- Equity multiple
- 0.55×
- Total profit
- $-12,085
- Equity at exit
- $8,205
Cash invested: $26,572 (down + closing). Projections, not guarantees.
Landlord ↔ Tenant lean methodology
- Overall (STATE)
- 83 Strongly Landlord-Friendly
- State Kansas
- 83 Strongly Landlord-Friendly · R+10
- County
- — inherits STATE
- City
- — inherits STATE
ZIP-level market 66713
- Home prices YoY
- -17.7%
- Active inventory
- 54
- Price-to-rent
- 9.9×
Monthly cashflow live
- Estimated rent
- $795 medium interval (Pro) →
- Mortgage (P&I)
- −$498
- Tax from tax record
- −$81 /mo · $971/yr
- Insurance
- −$40
- HOA
- −$0
- Vacancy / Maint / Mgmt
- −$167
- Net cashflow
- $10
Break-even live
Sensitivity live
| Price | -10% $64 | -5% $37 | +0% $10 | +5% $-17 | +10% $-44 |
|---|---|---|---|---|---|
| Rent | -10% $-53 | -5% $-22 | +0% $10 | +5% $41 | +10% $73 |
| Rate | -1.0pp $58 | -0.5pp $34 | base $10 | +0.5pp $-15 | +1.0pp $-40 |
UW: 25.0% down · 7.5% · 30yr · 1.5% tax · 5.0% vac · 8.0% maint · 8.0% mgmt
Financing live
Cash to close
- Down payment
- $23,725
- Closing costs
- $2,847
- Reserves months
- —
- Total cash needed
- —
Loan-product check · same deal, 3 products live
Conventional
25% down · 7.5% · 30yr
- Down + closing
- —
- Monthly P&I
- —
- Monthly cashflow
- —
- DSCR
- —
- Eligible?
- —
Personal DTI + credit; lowest rate.
DSCR
20% down · 8.5% · 30yr
- Down + closing
- —
- Monthly P&I
- —
- Monthly cashflow
- —
- DSCR
- —
- Eligible?
- —
No personal income docs; deal must DSCR.
Hard money
10% down · 12.0% · 12mo
- Down + closing
- —
- Monthly P&I
- —
- Monthly cashflow
- —
- DSCR
- —
- Eligible?
- —
Short-term bridge; refi at stabilization.
Rent comps 1 comps
| Address | Beds | Baths | Sqft | Rent | $/sqft | DOM | Units | Dist |
|---|---|---|---|---|---|---|---|---|
| 1520 Cleveland Ave Unit 2-302 Baxter Springs, KS | 2.0 | 1.0 | 989 | $795 | $0.80 | 22d | 1 | 0.87mi |
Listing history 28 events
-
2026-06-21days on market $94,900 Active 772 DOM
-
2026-06-18days on market $94,900 Active 770 DOM
-
2026-06-17days on market $94,900 Active 769 DOM
-
2026-06-16days on market $94,900 Active 768 DOM
-
2026-06-15days on market $94,900 Active 767 DOM
-
2026-06-13days on market $94,900 Active 765 DOM
-
2026-06-12days on market $94,900 Active 764 DOM
-
2026-06-09days on market $94,900 Active 761 DOM
-
2026-06-08days on market $94,900 Active 760 DOM
-
2026-06-07days on market $94,900 Active 759 DOM
-
2026-06-05days on market $94,900 Active 757 DOM
-
2026-06-04days on market $94,900 Active 755 DOM
-
2026-06-02days on market $94,900 Active 754 DOM
-
2026-06-01days on market $94,900 Active 753 DOM
-
2026-05-31days on market $94,900 Active 752 DOM
-
2026-05-31days on market $94,900 Active 751 DOM
-
2026-02-09status Active
-
2026-02-08historical
-
2025-12-24price $94,900
-
2025-11-05price $109,900
-
2025-05-05price $119,900
-
2024-08-08status Active
-
2024-08-08historical
-
2024-05-07$129,900 Active
-
2018-01-18soldstatus 24-char remark
Show marketing remark (24 chars)
None. For comp use only.
-
2018-01-18$48,900 24-char remark
Show marketing remark (24 chars)
None. For comp use only.
-
2016-06-10soldstatus 84-char remark
Show marketing remark (84 chars)
Great investment or fixer upper. Sale includes 627 W 6th. Property being sold as is.
-
2014-08-27$19,500 84-char remark
Show marketing remark (84 chars)
Great investment or fixer upper. Sale includes 627 W 6th. Property being sold as is.
ⓘ Source: listings_history table (triggers on properties + properties_extension) + one-shot
backfill from property_details.listing_events for pre-trigger history.
Tax reassessment forecast KS · Resets to sale price
- Current annual tax
- $971 · $81/mo
- Projected year-2 tax
- $1,338 · $112/mo
- Expected delta
- +$367/yr (+$31/mo · 37.8%)
ⓘ Screening estimate from a state-policy table — verify with the county assessor before closing.
Climate risk First Street
- Flood 1/10 Low FEMA zone X (unshaded) · 0% chance over 30 yrs
- Wildfire 7/10 Severe
- Heat 5/10 Major 7 d/yr ≥108°F today · 20 d/yr by 30 yrs out
- Wind 2/10 Low 2% chance of damaging wind over 30 yrs
- Air quality 2/10 Low 1 unhealthy d/yr today · 1 by 30 yrs out
Nearby sold comps map
Loading sold comps map…
Walkable amenities ~0.75 mi
Loading nearby amenities…
Taxation est. · year 1
- Rental income
- $9,540
- − Mortgage interest
- −$5,316
- − Property taxes
- −$971
- − Insurance
- −$474
- − Repairs & maintenance
- −$763
- − Management
- −$763
- − Depreciation
- −$2,761
- Taxable loss
- −$1,509
- Est. tax savings @ 24.0%
- +$362
- After-tax cash flow
- $481/yr
For passive investors: Depreciation is non-cash, so a rental often shows a tax loss while cash-flowing — sheltering income. Rental losses are passive: they offset passive income freely, and up to $25,000/yr can offset ordinary (W-2) income if you actively participate and your MAGI is under $100k (phasing out to $0 by $150k); unused losses carry forward. On sale, claimed depreciation is recaptured at up to 25%, and gains may owe capital-gains tax (a 1031 exchange can defer both). Figures are a year-1 estimate at your 24.0% rate — not tax advice; consult a CPA.
Schools (NCES district)
- District
- Baxter Springs
- NCES district ID
- 2003810
- Math proficiency
- 31% ▼ -1.00%
- Reading proficiency
- 39% ▲ 2.00%
- Median HH income
- $40,038
- Composite
- 29.37/100
- National rank
- #6529
- State rank
- #64 of 169 in KS
Livability — Baxter Springs
- Score
- 75/100
- State rank
- #63
- US rank
- #3952
Category grades
Schools grade is shown separately in the Schools card above.
Census & demographics
- Census place
- Baxter Springs, KS
- Population (ZIP)
- 5,560
Population outlook (Cherokee County) Hauer SSP2
- Today (2025)
- 18,848 people
- By 2030
- 17,862 · -5.2%
- By 2040
- 15,850 · -15.9%
- By 2050
- 13,915 · -26.2%
- By 2075
- 10,102 · -46.4%
- By 2100
- 6,977 · -63.0%
Race, ethnicity, and origin ACS 2023
- Neighborhood character
- Predominantly White (85%)
- Race & ethnicity
- White 85% Hispanic / Latino 6% Two or more races 4% Native American 3%
- Hispanic origin (detail)
- Mexican 4%
- Common ancestry
- Scotch-Irish 6% Slovak 3% Italian 3%
- Foreign-born
- 2% · Canada
- Languages at home
- 98% English-only · Other Indo-European 1% Spanish 1%
Political lean MEDSL · Cherokee
- 2024 margin
- Solid R (+52.9) · D 22.6% · R 75.5% · Other 1.9%
- 2008→2024 swing
- -29.2pp toward R · 2008: -23.7pp · 2024: -52.9pp
- All cycles
- 2024: R+52.9 2020: R+49.9 2016: R+48.4 2012: R+29.5 2008: R+23.7
Not yet ingested
- Civics
- —
Market trends
- HPI YoY
- ▼ -37.71%
- Current HPI
- 175.5431
- Rent YoY
- —
- Metro
- —
- State GDP YoY
- —
- F500 in state
- 0
Price history
+386.7% since first listed12 events — show timeline
- 2026-02-09 Relisted — OGAR
- 2026-02-08 Delisted — OGAR
- 2025-12-24 Price Changed $94,900 OGAR
- 2025-11-05 Price Changed $109,900 OGAR
- 2025-05-05 Price Changed $119,900 OGAR
- 2024-08-08 Relisted — OGAR
- 2024-08-08 Delisted — OGAR
- 2024-05-07 Listed $129,900 OGAR
- 2018-01-18 Listed $48,900 OGAR
- 2018-01-18 Sold (MLS) — OGAR
- 2016-06-10 Sold (MLS) — OGAR
- 2014-08-27 Listed $19,500 OGAR
Property tax history
-0.8%/yrLatest (2025): $971 · +11.7% YoY. Source: county tax records.
Cash-flow waterfall
monthlySold comps — $/sqft
last 12 mo · ≤1 miLoading sold comps…