 Multi-family
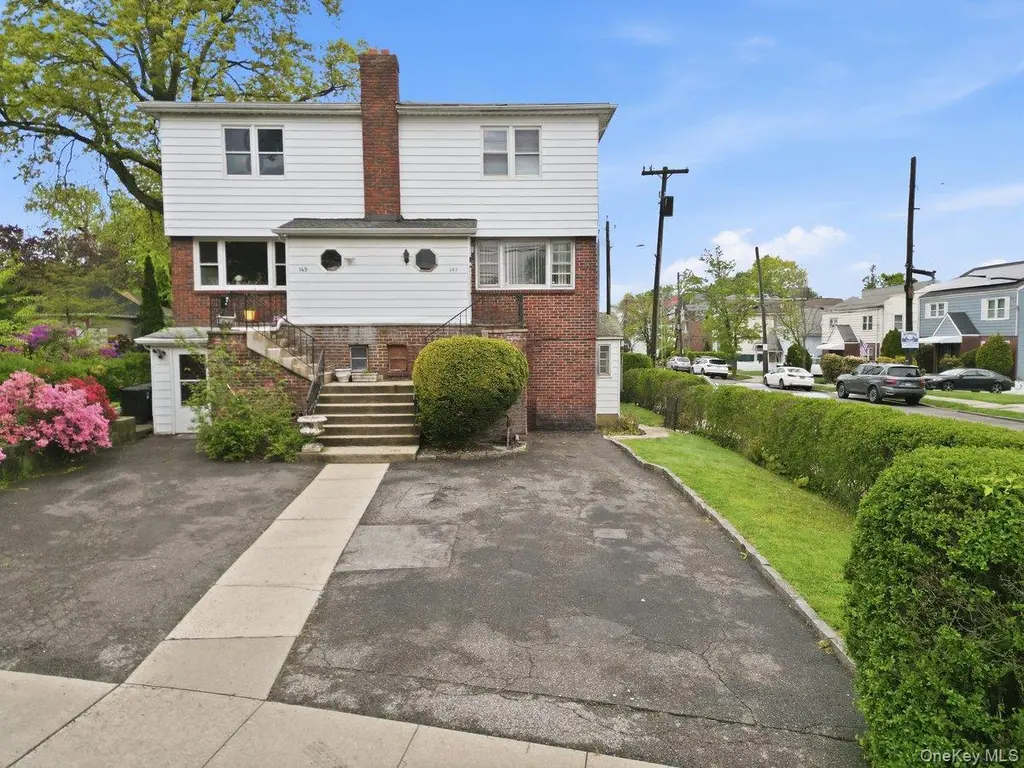
147 Mile Square Rd · Yonkers, NY
Flood risk 1/10 · Minimal
- FEMA flood zone
- X (unshaded)
- Chance of flooding over 30 yrs
- 0.0%
- Est. flood insurance / yr
- $473 – $860
Fire risk 4/10 · Minor
- Est. fire insurance / yr
- $691 – $1,283
Heat risk 6/10 · Moderate
- Hot days now (above 99°F)
- 7 days/yr
- Hot days in 30 yrs
- 15 days/yr
Wind risk 6/10 · Moderate
- Chance of severe wind over 30 yrs
- 27.0%
Air-quality risk 3/10 · Minor
- Unhealthy air days now
- 3 days/yr
- Unhealthy air days in 30 yrs
- 4 days/yr
Risk factors via First Street. Map © Google.
Why this score? — see what drove the C+ grade
The composite is a weighted blend of 9 inputs, each scored 0–100. Each bar is that input's sub-score; the figure is the points it added to the 100-point composite (weight × sub-score).
- Cash flow +21.0/30.0
- ARV discount +15.0/15.0
- DSCR +6.7/10.0
- 1% rule +4.2/10.0
- Schools +4.1/10.0
- Rent growth +3.6/5.0
- Livability +3.4/5.0
- Condition / age +2.5/5.0
- Appreciation +0.0/10.0
$689,000
🖨 Deal sheet 📄 Offer letter ✓ Due diligence
Multi-family units
County records classify this as Multi-Family (2-4 Unit). Listing-text estimate: 1 unit. estimate disagrees with records
Listing remarks
Set proudly on a prime corner lot in one of Yonkers’ most desirable neighborhoods, this legal two-family semi-attached home offers the perfect blend of space, potential, and location, tucked away in the Bryn Mawr vicinity of Yonkers. With great bones and endless upside, this is your chance to create something truly special. The main residence features a spacious three-bedroom, 1.5-bath duplex that lives like a single-family home. Enjoy a sun-filled living Living room, a generously sized eat-in kitchen with access to a private deck—ideal for outdoor dining and entertaining and three generous size bedrooms with ample closet space, an updated hall bathroom plus a huge attic for sto
Key facts
- 2,614 sq ft lot
- Built 1962
- Listed 8 days
Property features AI
Exterior
- Parking: Driveway
- Utilities: Electricity connected (Con-Edison); Natural gas connected; Public sewer
- Home design: Duplex; Actual property condition
- Construction: Block construction; Block foundation
- Exterior features: Corner lot; Not waterfront
Interior
- Kitchen: Eat-in kitchen; Open kitchen
- Bedrooms: One 3-bedroom unit
- Flooring: Hardwood floors
- Bathrooms: 2 full bathrooms
- Heating & cooling: Natural gas heating; Wall/window air conditioning units
- Interior features: Eat-in kitchen; Entrance foyer; Open kitchen; Original details; Wood window frames; Deck; Basement with storage space
- Laundry & utility: Washer hookup; Gas dryer hookup
Neighborhood map
What this means for you Summary
Snapshot
- This is a 4-bed/2.5-bath multifamily listed at $689k.
Deal economics
- At list price, monthly cash flow is $967 ($12k/yr) — positive.
- The deal already cash-flows at list — no discount required.
- To meet the 1% rule (rent ≥ 1% of price), the offer needs to be $632k (8.3% below list).
- Recommended offer: $632k (8.3% below list) — sets the bar for 1% rule.
- Cap rate 8.0% vs local median 5.3% in Yonkers — top-decile yield for the area; either an underpriced asset or a hidden risk that comps aren't pricing in. Stress-test before assuming the spread holds.
Location & tenants
- Location reads 68/100 on livability (#528 in NY) — a middle-class / working-renter tenant base. Strengths: employment A, commute B; Watch: amenities F, cost of living F.
- Yonkers City School District (suburban): math 41% / reading 54% proficiency, ranked #413 of 590 in NY (top 70%) — families likely to look elsewhere, expect single-tenant / working-renter base with shorter leases; 64% free/reduced lunch — lower-income household profile, screen leases tightly.
- Zoned schools: Yonkers Early Childhood Academy (327 students, 72% FRL); Yonkers Middle School (math 17% / reading 37%, grade F, #587 of 729 statewide, top 81%, 601 students, 88% FRL); Yonkers High School (math 92% / reading 88%, grade A+, #238 of 1,100 statewide, top 23%, 1,060 students, 76% FRL) — zoned schools average 79% FRL vs 64% district-wide (15 pts higher); higher-poverty schools than district average — tighter screening recommended.
- Market conditions: Rents rising fast (+4.4%/yr); 183 active listings in the ZIP; 15 comparable units currently listed for rent nearby; rentals at typical pace (median 25d on market — plan ~3-4 weeks tenant-placement turnaround); 47% of comp listings sitting > 30 days — soft ceiling on asking rent; 954 units permitted in Westchester County in 2024 (649 in 5+ unit buildings).
- At $6,319/mo this rent would consume 117% of the median local household income ($65k/yr) (locally 6045% of renters already pay >50% of income on rent) — very limited rent-growth headroom before tenants either downsize or default.
Forward outlook
- Local home prices are declining (-3.0%/yr); year-one equity from $5k of loan paydown is wiped out by about $21k of value loss. Plan a longer hold.
- Westchester County population projected at +10% by 2050 — modest demand growth; plan on rents tracking national, not racing it.
Negotiation context
- Only 8 days on market — expect competitive offers; lowballing is unlikely to land.
Risks & watch-outs
- Climate carrying-cost: major wind risk, 27% chance of damaging wind over 30y; extreme-heat days projected 7→15/yr by 2055 (HVAC capex compounding) — expect insurance premiums to compound above CPI over the hold.
Questions for the listing agent
- Built in 1962 — when were the roof, HVAC, electrical panel, plumbing, and water heater last replaced?
- Is there a deadline driving the sale (1031 exchange, divorce, estate, relocation)? That informs how much negotiation room exists.
- What's the average days-on-market for RENTAL listings here right now (not sales)? A rising rental-DOM trend means longer vacancies and softer asking-rent achievability than the comps imply.
- What's the recent tenant-quality profile in this submarket — average credit score on applications, eviction rate, late-payment / NSF rate, and stable-employment percentage? A property-management company in the area should have these aggregated.
- How much new apartment / multifamily construction is in the pipeline within 1–3 miles? Heavy new supply (>2% of stock underway) typically softens rents 12–24 months out; light construction supports rent growth.
Investment metrics
- 1% rule
- 0.92% ✗
- Cap rate
- 7.98%
- Cash-on-cash
- 6.01%
- DSCR
- 1.27
- GRM
- 9.1
CMA / ARV
- ARV (median comp)
- $1,325,529
- List price
- $689,000
- Delta
- -48.02%
- Verdict
- UNDERPRICED
- Comps
- 20 within 1.0 mi
Projected returns pro-forma
-3.0% appreciation · 4.39% rent growth · sell at horizon
- IRR
- -5.7%
- Equity multiple
- 0.79×
- Total profit
- $-41,457
- Equity at exit
- $102,732
- IRR
- 5.3%
- Equity multiple
- 1.41×
- Total profit
- $79,577
- Equity at exit
- $59,572
Cash invested: $192,920 (down + closing). Projections, not guarantees.
Landlord ↔ Tenant lean methodology
- Overall (CITY)
- 5 Strongly Tenant-Friendly
- State New York
- 15 Strongly Tenant-Friendly · D+10
- County
- — inherits STATE
- City Yonkers
- 5 Strongly Tenant-Friendly · D+20
ZIP-level market 10701
- Rents YoY
- 4.4%
- Active inventory
- 183
- Price-to-rent
- 18.2×
Monthly cashflow live
- Estimated rent
- $6,319 medium interval (Pro) →
- Mortgage (P&I)
- −$3,613
- Tax from tax record
- −$125 /mo · $1,497/yr
- Insurance
- −$287
- HOA
- −$0
- Vacancy / Maint / Mgmt
- −$1,327
- Net cashflow
- $967
Break-even live
2-unit breakdown (identical units grouped — click to expand)
| Units | Beds | Baths | Est. rent |
|---|---|---|---|
| 2× units | 3 | 1.5 | $6,320 |
| #1 | 3 | 1.5 | $3,160 |
| #2 | 3 | 1.5 | $3,160 |
| Total (2 units) | $6,319 | ||
UW: 25.0% down · 7.5% · 30yr · 1.5% tax · 5.0% vac · 8.0% maint · 8.0% mgmt
Financing live
Cash to close
- Down payment
- $172,250
- Closing costs
- $20,670
- Reserves months
- —
- Total cash needed
- —
Loan-product check · same deal, 3 products live
Conventional
25% down · 7.5% · 30yr
- Down + closing
- —
- Monthly P&I
- —
- Monthly cashflow
- —
- DSCR
- —
- Eligible?
- —
Personal DTI + credit; lowest rate.
DSCR
20% down · 8.5% · 30yr
- Down + closing
- —
- Monthly P&I
- —
- Monthly cashflow
- —
- DSCR
- —
- Eligible?
- —
No personal income docs; deal must DSCR.
Hard money
10% down · 12.0% · 12mo
- Down + closing
- —
- Monthly P&I
- —
- Monthly cashflow
- —
- DSCR
- —
- Eligible?
- —
Short-term bridge; refi at stabilization.
Rent comps 15 comps
| Address | Beds | Baths | Sqft | Rent | $/sqft | DOM | Units | Dist |
|---|---|---|---|---|---|---|---|---|
| 246 Stone Ave Yonkers, NY | 3.0 | 1.0 | 900 | $3,300 | $3.67 | 4d | 1 | 0.16mi |
| 433 Palmer Rd Unit Second Fl Yonkers, NY | 3.0 | 1.5 | 1400 | $3,500 | $2.50 | 43d | 1 | 0.30mi |
| 151 Burhans Ave Unit 1 Yonkers, NY | 3.0 | 1.0 | 1500 | $3,550 | $2.37 | 43d | 1 | 0.58mi |
| 348 Saw Mill River Rd Unit 2 Yonkers, NY | 3.0 | 1.0 | 900 | $3,200 | $3.56 | 24d | 1 | 0.64mi |
| 37 Troy Ln Unit 1 Yonkers, NY | 4.0 | 1.5 | 1500 | $4,200 | $2.80 | 7d | 1 | 0.74mi |
| 287 Mary Lou Ave Unit 2 Yonkers, NY | 3.0 | 2.0 | 1400 | $3,500 | $2.50 | 43d | 1 | 0.94mi |
| 312 Edwards Pl Unit 1 Yonkers, NY | 3.0 | 1.5 | 1550 | $4,000 | $2.58 | 43d | 1 | 0.94mi |
| 155 Lake Ave Yonkers, NY | 3.0 | 1.0 | 1000 | $3,200 | $3.20 | 16d | 1 | 1.14mi |
| 82 Morningside Ave Unit 1 Yonkers, NY | 3.0 | 3.5 | 1734 | $4,000 | $2.31 | 24d | 1 | 1.22mi |
| 82 Morningside Ave Unit 2 Yonkers, NY | 3.0 | 2.5 | 1734 | $4,000 | $2.31 | 43d | 1 | 1.22mi |
| 355 Bronxville Rd Bronxville, NY | 3.0 | 2.0 | 968 | $3,400 | $3.51 | 24d | 1 | 1.22mi |
| 740 Palisade Ave Yonkers, NY | 3.0 | 1.0 | 1200 | $2,900 | $2.42 | 24d | 1 | 1.35mi |
| 13 Regina Pl Yonkers, NY | 3.0 | 1.0 | 1200 | $3,000 | $2.50 | 43d | 1 | 1.40mi |
| 3 Annmarie Pl Yonkers, NY | 3.0 | 1.0 | 1200 | $3,200 | $2.67 | 5d | 1 | 1.40mi |
| 4 Ritters Ln Unit 1FL Yonkers, NY | 3.0 | 1.0 | 1100 | $3,300 | $3.00 | 43d | 1 | 1.41mi |
Listing history 1 events
-
2026-05-04$689,000 Active
ⓘ Source: listings_history table (triggers on properties + properties_extension) + one-shot
backfill from property_details.listing_events for pre-trigger history.
Tax reassessment forecast NY · Partial reset (capped growth)
- Current annual tax
- $1,497 · $125/mo
- Projected year-2 tax
- $6,570 · $548/mo
- Expected delta
- +$5,074/yr (+$423/mo · 339.0%)
ⓘ Screening estimate from a state-policy table — verify with the county assessor before closing.
Climate risk First Street
- Flood 1/10 Low FEMA zone X (unshaded) · 0% chance over 30 yrs
- Wildfire 4/10 Moderate
- Heat 6/10 Major 7 d/yr ≥99°F today · 15 d/yr by 30 yrs out
- Wind 6/10 Major 27% chance of damaging wind over 30 yrs
- Air quality 3/10 Moderate 3 unhealthy d/yr today · 4 by 30 yrs out
Nearby sold comps map
Loading sold comps map…
Walkable amenities ~0.75 mi
Loading nearby amenities…
Taxation est. · year 1
- Rental income
- $75,828
- − Mortgage interest
- −$38,595
- − Property taxes
- −$1,497
- − Insurance
- −$3,445
- − Repairs & maintenance
- −$6,066
- − Management
- −$6,066
- − Depreciation
- −$20,044
- Taxable income
- $115
- Est. tax owed @ 24.0%
- −$28
- After-tax cash flow
- $11,576/yr
For passive investors: Depreciation is non-cash, so a rental often shows a tax loss while cash-flowing — sheltering income. Rental losses are passive: they offset passive income freely, and up to $25,000/yr can offset ordinary (W-2) income if you actively participate and your MAGI is under $100k (phasing out to $0 by $150k); unused losses carry forward. On sale, claimed depreciation is recaptured at up to 25%, and gains may owe capital-gains tax (a 1031 exchange can defer both). Figures are a year-1 estimate at your 24.0% rate — not tax advice; consult a CPA.
Schools (NCES district)
- District
- Yonkers City School District
- NCES district ID
- 3631920
- Math proficiency
- 41% ▼ -1.00%
- Reading proficiency
- 54% ▲ 14.00%
- Median HH income
- $58,042
- Composite
- 41.43/100
- National rank
- #3471
- State rank
- #413 of 590 in NY
Livability — Yonkers
- Score
- 68/100
- State rank
- #528
- US rank
- #9394
Category grades
Schools grade is shown separately in the Schools card above.
Census & demographics
- Census place
- Yonkers, NY
- County
- Westchester County · 709,332 people
- City population
- 212,407
- Metro
- New York-Newark-Jersey City, NY-NJ-PA
- Population (ZIP)
- 70,676
- Household income
- $64,776
- Rent vs Own
- Severe rent burden
- 6045.0
Population outlook (Westchester County) Hauer SSP2
- Today (2025)
- 1,028,035 people
- By 2030
- 1,051,636 · +2.3%
- By 2040
- 1,098,520 · +6.9%
- By 2050
- 1,136,044 · +10.5%
- By 2075
- 1,196,925 · +16.4%
- By 2100
- 1,175,147 · +14.3%
Race, ethnicity, and origin ACS 2023
- Neighborhood character
- Diverse neighborhood (Simpson 0.65)
- Race & ethnicity
- Hispanic / Latino 52% White 21% Black 21% Two or more races 18% Asian 3% Native American 1%
- Hispanic origin (detail)
- Mexican 11% Puerto Rican 9% Dominican 19%
- Common ancestry
- Romanian 1% Russian 1% Subsaharan African 1%
- Foreign-born
- 35% · Canada, Jamaica, South Korea
- Languages at home
- 45% English-only · Spanish 42% Other Indo-European 3% Arabic 2%
Political lean MEDSL · Westchester
- 2024 margin
- Strong D (+26.3) · D 63.1% · R 36.9%
- 2008→2024 swing
- -1.3pp toward R · 2008: 27.6pp · 2024: 26.3pp
- All cycles
- 2024: D+26.3 2020: D+36.3 2016: D+32.8 2012: D+22.2 2008: D+27.6
Not yet ingested
- Civics
- —
Market trends
- HPI YoY
- ▼ -373.14%
- Current HPI
- 332.0999
- Rent YoY
- ▲ 4.39%
- Metro
- New York-Newark-Jersey City, NY-NJ-PA
- State GDP YoY
- ▲ 2.60%
- F500 in state
- 92
Industry mix (Fortune 500 HQ in NY)
| Industry | F500 HQs | Revenue |
|---|---|---|
| Financial Services | 10 | $950B |
|
||
| Consumer Goods | 9 | $162B |
|
||
| Insurance | 4 | $225B |
|
||
| Telecommunications | 2 | $144B |
|
||
| Pharmaceuticals | 2 | $112B |
|
||
| Media / Entertainment | 2 | $69B |
|
||
Price history
2 events — show timeline
- 2026-05-29 Pending — OneKey® MLS as Distributed by MLS Grid
- 2026-05-04 Listed $689,000 OneKey® MLS as Distributed by MLS Grid
Property tax history
-24.9%/yrLatest (2025): $1,497 · +0.5% YoY. Source: county tax records.
Cash-flow waterfall
monthlySold comps — $/sqft
last 12 mo · ≤1 miLoading sold comps…