56 Road 5102c · Plum Grove, TX
Flood risk 4/10 · Minor
- FEMA flood zone
- X (unshaded)
- Chance of flooding over 30 yrs
- 0.2%
- Est. flood insurance / yr
- $507 – $1,088
Fire risk 5/10 · Moderate
- Est. fire insurance / yr
- $1,222 – $2,270
Heat risk 9/10 · Severe
- Hot days now (above 111°F)
- 7 days/yr
- Hot days in 30 yrs
- 24 days/yr
Wind risk 9/10 · Severe
- Chance of severe wind over 30 yrs
- 99.0%
Air-quality risk 2/10 · Minimal
- Unhealthy air days now
- 1 days/yr
- Unhealthy air days in 30 yrs
- 2 days/yr
Risk factors via First Street. Map © Google.
Why this score? — see what drove the D+ grade
The composite is a weighted blend of 9 inputs, each scored 0–100. Each bar is that input's sub-score; the figure is the points it added to the 100-point composite (weight × sub-score).
- Cash flow +14.3/30.0
- ARV discount +12.8/15.0
- 1% rule +4.9/10.0
- DSCR +4.4/10.0
- Condition / age +3.8/5.0
- Rent growth +3.5/5.0
- Livability +2.9/5.0
- Schools +2.1/10.0
- Appreciation +0.0/10.0
$206,080
🖨 Deal sheet (PDF) 📄 Offer letter ✓ Due diligence
Listing remarks
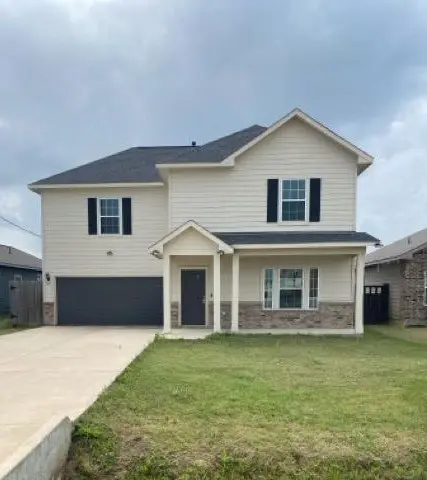
Clean lines, practical layout, and a straightforward setup—56 Road 5102C, Cleveland, TX 77327 offers a 4-bedroom, 2.1-bathroom home with connected living, dining, and kitchen areas designed for everyday function. The interior is arranged with defined spaces and an efficient flow across a two-level layout. Includes an attached 2-car garage and standard residential features. Positioned with access to major roadways and near local points of interest including Sam Houston National Forest and Lake Houston Wilderness Park, along with nearby retail and dining options in the Cleveland area.
Key facts
- Two level layout
- 6,969 sq ft lot
- 2 garage spots
Tags
Property features AI
Finance
- HOA & community: Houston El Norte POA; Annual association fee of $140
Exterior
- Parking: Attached garage; 2 garage spaces
- Utilities: Public water; Public sewer
- Home design: Residential property; Full ownership; Built in 2022; Slab foundation; Composition roof; Total living area approximately 1,864
- Construction: Vinyl siding
- Exterior features: Deck; Patio; Porch; Private yard; Fenced backyard; Located on a cul-de-sac; Part of a subdivision
Interior
- Kitchen: Dishwasher; Free-standing range; Microwave
- Bedrooms: Primary bedroom (Second floor) — 14 x 16; Bedroom (Second floor) — 12 x 12; Bedroom (Second floor) — 10 x 10; Bedroom (Second floor) — 8 x 8
- Flooring: Carpet; Laminate
- Bathrooms: 2 full bathrooms; 1 half bathroom
- Heating & cooling: Central heating (electric); Central air conditioning (electric)
- Interior features: Self-closing cabinet doors and drawers; Tub with shower
- Laundry & utility: Washer hookup; Electric dryer hookup
Neighborhood map
What this means for you Summary
Snapshot
- This is a 4-bed/3.0-bath single-family listed at $206k. Condition is rated good.
Deal economics
- At list price, monthly cash flow is $38 ($457/yr) — positive.
- The deal already cash-flows at list — no discount required.
- To meet the 1% rule (rent ≥ 1% of price), the offer needs to be $204k (0.9% below list).
- Recommended offer: $200k (3.0% below list) — sets the bar for market timing.
- Cap rate 6.5% vs local median 5.0% in Plum Grove — top-decile yield for the area; either an underpriced asset or a hidden risk that comps aren't pricing in. Stress-test before assuming the spread holds.
Location & tenants
- Location reads 58/100 on livability (#1,206 in TX) — a working-class tenant base; expect higher turnover. Strengths: crime A+, cost of living A+, housing A+; Watch: amenities F, commute F, health & safety F.
- Cleveland ISD (town): math 24% / reading 25% proficiency, ranked #723 of 826 in TX (top 88%) — low school quality limits family demand, transient renter base, plan for 1-2y turnover; 71% free/reduced lunch — lower-income household profile, screen leases tightly.
- Zoned schools: Cottonwood El (math 25% / reading 18%, grade F, #3,470 of 4,322 statewide, top 81%, 827 students, 97% FRL); Santa Fe Middle (915 students, 99% FRL); Cleveland H S (math 30% / reading 32%, grade F, #1,077 of 1,632 statewide, top 66%, 3,310 students, 92% FRL) — zoned schools average 96% FRL vs 71% district-wide (25 pts higher); higher-poverty schools than district average — tighter screening recommended.
- Market conditions: Rents rising fast (+4.0%/yr); 1578 active listings in the ZIP; 5 comparable units currently listed for rent nearby; rentals at typical pace (median 23d on market — plan ~3-4 weeks tenant-placement turnaround); 40% of comp listings sitting > 30 days — soft ceiling on asking rent; 1,321 units permitted in Liberty County in 2024 (0 in 5+ unit buildings).
- This rent runs 39% of the median local income ($62k/yr) — at the standard rent-burdened threshold; future hikes will face affordability resistance.
Forward outlook
- Local home prices are declining (-3.0%/yr); year-one equity from $1k of loan paydown is wiped out by about $6k of value loss. Plan a longer hold.
- Liberty County population projected at +24% by 2050 — long-run rental-demand tailwind backs the buy-and-hold thesis.
Negotiation context
- It's been on market 52 days — a 3% lower offer ($200k) is reasonable based on typical stale-listing flexibility.
- 2 sale attempts; this cycle's ask has dropped $18k (8%) from the opening price — seller is motivated, your offer sets the floor, not the list.
Risks & watch-outs
- Climate carrying-cost: severe wind risk, 99% chance of damaging wind over 30y; moderate wildfire risk; extreme-heat days projected 7→24/yr by 2055 (HVAC capex compounding) — expect insurance premiums to compound above CPI over the hold.
Questions for the listing agent
- It's been on market 52 days. Have you received any prior offers? Is the seller open to a 3% concession, seller financing, or rate buy-down credit?
- What does the HOA fee cover, when was the last increase, and are there any pending special assessments or reserve-fund shortfalls?
- Is there a deadline driving the sale (1031 exchange, divorce, estate, relocation)? That informs how much negotiation room exists.
- Schools are F-rated, which usually means shorter tenancies and higher turnover. Who's the typical renter profile here, and what's been the actual vacancy rate?
- The area grade is low — what's the realistic commute time and amenity access for the typical tenant pool here? Any planned neighborhood developments (good or bad) we should know about?
- What's the average days-on-market for RENTAL listings here right now (not sales)? A rising rental-DOM trend means longer vacancies and softer asking-rent achievability than the comps imply.
- What's the recent tenant-quality profile in this submarket — average credit score on applications, eviction rate, late-payment / NSF rate, and stable-employment percentage? A property-management company in the area should have these aggregated.
- How much new for-sale + rental construction is in the pipeline within 1–3 miles? Heavy new supply typically softens prices + rents 12–24 months out; constrained supply supports both.
Investment metrics
- 1% rule
- 0.99% ✗
- Cap rate
- 6.51%
- Cash-on-cash
- 0.79%
- DSCR
- 1.04
- GRM
- 8.4
CMA / ARV
- ARV (median comp)
- $233,320
- List price
- $206,080
- Delta
- -11.67%
- Verdict
- UNDERPRICED
- Comps
- 20 within 1.0 mi
Show comp detail 12 sales within ~0.75 mi
| Address | Dist | Beds/Ba | Sqft | Sold | Price | $/sf | Match |
|---|---|---|---|---|---|---|---|
| 286 County Road 5102 Unit F | 0.26mi | 3/3.5 (-1) | 1,692 (-2%) | 1mo | $224,000 | $132 | 77 |
| 1454 Road 5102 | 0.22mi | 4/2.0 | 1,722 (+0%) | 15mo | $210,000 | $122 | 74 |
| 104 County Road 5102 A | 0.28mi | 4/2.0 | 1,686 (-2%) | 8mo | $296,990 | $176 | 73 |
| 1148 Road 5102 | 0.09mi | 3/2.0 (-1) | 1,588 (-8%) | 3mo | $275,000 | $173 | 72 |
| 130 County Road 5102b | 0.15mi | 4/2.5 | 1,868 (+9%) | 13mo | $299,990 | $161 | 66 |
| 44 County Road 5102 A | 0.26mi | 4/2.0 | 1,649 (-4%) | 17mo | $286,990 | $174 | 62 |
| 275 County Road 5102f | 0.34mi | 3/2.5 (-1) | 1,646 (-4%) | 11mo | $214,900 | $131 | 60 |
| 1354 Road 5102 I | 0.14mi | 3/2.0 (-1) | 1,505 (-12%) | 9mo | $175,000 | $116 | 56 |
| 274 County Road 5102f | 0.41mi | 3/2.5 (-1) | 1,646 (-4%) | 15mo | $215,900 | $131 | 54 |
| 84 County Road 5102a | 0.28mi | 4/2.0 | 1,518 (-12%) | 11mo | $268,990 | $177 | 54 |
| 96 County Road 51030 | 0.20mi | 3/2.0 (-1) | 1,518 (-12%) | 10mo | $277,990 | $183 | 54 |
| 14 County Road 5102f | 0.44mi | 3/2.0 (-1) | 1,635 (-5%) | 15mo | $165,000 | $101 | 50 |
Match score weights: distance 35% · size 25% · config 20% · recency 20%. Top-matched comps best support the ARV.
Projected returns pro-forma
-3.0% appreciation · 4.0% rent growth · sell at horizon
- IRR
- -13.7%
- Equity multiple
- 0.50×
- Total profit
- $-28,769
- Equity at exit
- $30,727
- IRR
- -3.1%
- Equity multiple
- 0.78×
- Total profit
- $-12,738
- Equity at exit
- $17,818
Cash invested: $57,702 (down + closing). Projections, not guarantees.
Landlord ↔ Tenant lean methodology
- Overall (STATE)
- 87 Strongly Landlord-Friendly
- State Texas
- 87 Strongly Landlord-Friendly · R+5
- County
- — inherits STATE
- City
- — inherits STATE
ZIP-level market 77327
- Home prices YoY
- -5.2%
- Rents YoY
- 4.0%
- Active inventory
- 1578
- Price-to-rent
- 8.4×
Monthly cashflow live
- Estimated rent
- $2,041 high interval (Pro) →
- Mortgage (P&I)
- −$1,081
- Tax from tax record
- −$396 /mo · $4,751/yr
- Insurance
- −$86
- HOA
- −$12
- Vacancy / Maint / Mgmt
- −$429
- Net cashflow
- $38
Break-even live
Sensitivity live
| Price | -10% $155 | -5% $96 | +0% $38 | +5% $-20 | +10% $-79 |
|---|---|---|---|---|---|
| Rent | -10% $-123 | -5% $-43 | +0% $38 | +5% $119 | +10% $199 |
| Rate | -1.0pp $142 | -0.5pp $91 | base $38 | +0.5pp $-15 | +1.0pp $-70 |
UW: 25.0% down · 7.5% · 30yr · 1.5% tax · 5.0% vac · 8.0% maint · 8.0% mgmt
Financing live
Cash to close
- Down payment
- $51,520
- Closing costs
- $6,182
- Reserves months
- —
- Total cash needed
- —
Loan-product check · same deal, 3 products live
Conventional
25% down · 7.5% · 30yr
- Down + closing
- —
- Monthly P&I
- —
- Monthly cashflow
- —
- DSCR
- —
- Eligible?
- —
Personal DTI + credit; lowest rate.
DSCR
20% down · 8.5% · 30yr
- Down + closing
- —
- Monthly P&I
- —
- Monthly cashflow
- —
- DSCR
- —
- Eligible?
- —
No personal income docs; deal must DSCR.
Hard money
10% down · 12.0% · 12mo
- Down + closing
- —
- Monthly P&I
- —
- Monthly cashflow
- —
- DSCR
- —
- Eligible?
- —
Short-term bridge; refi at stabilization.
Rent comps 5 comps
| Address | Beds | Baths | Sqft | Rent | $/sqft | DOM | Units | Dist |
|---|---|---|---|---|---|---|---|---|
| 1176 Road 5102 Cleveland, TX | 4.0 | 3.0 | 2032 | $2,150 | $1.06 | 44d | 1 | 0.08mi |
| 26 Road 5102 F Cleveland, TX | 4.0 | 2.0 | 1761 | $1,501 | $0.85 | 23d | 1 | 0.32mi |
| 670 Road 51021 Cleveland, TX | 4.0 | 2.0 | 1699 | $1,749 | $1.03 | 0d | 7 | 0.50mi |
| 885 Road 51023 Cleveland, TX | 3.0 | 2.0 | 1200 | $1,250 | $1.04 | 23d | 1 | 0.74mi |
| 895 Road 51023 Cleveland, TX | 3.0 | 2.0 | 1100 | $1,200 | $1.09 | 44d | 1 | 0.75mi |
HOA detail
- Monthly dues
- $12 · $144/yr
Listing history 21 events
-
2026-06-21days on market $206,080 Active 52 DOM
-
2026-06-18days on market $206,080 Active 49 DOM
-
2026-06-17pricedays on market $206,080 Active 48 DOM
-
2026-06-16days on market $224,000 Active 47 DOM
-
2026-06-15days on market $224,000 Active 46 DOM
-
2026-06-13days on market $224,000 Active 44 DOM
-
2026-06-09days on market $224,000 Active 40 DOM
-
2026-06-08days on market $224,000 Active 39 DOM
-
2026-06-07days on market $224,000 Active 38 DOM
-
2026-06-04days on market $224,000 Active 35 DOM
-
2026-06-03days on market $224,000 Active 34 DOM
-
2026-06-02days on market $224,000 Active 33 DOM
-
2026-06-01days on market $224,000 Active 32 DOM
-
2026-05-31days on market $224,000 Active 31 DOM
-
2026-04-30$224,000 Active 595-char remark
-
2025-09-03historical
-
2025-06-11price $278,000
-
2025-05-20price $280,000
-
2025-04-22price $289,000
-
2025-04-16$295,000 Active
-
2022-02-25soldstatus
ⓘ Source: listings_history table (triggers on properties + properties_extension) + one-shot
backfill from property_details.listing_events for pre-trigger history.
Tax reassessment forecast TX · Resets to sale price
- Current annual tax
- $4,751 · $396/mo
- Projected year-2 tax
- $4,751 · $396/mo
- Expected delta
- $0/yr ($0/mo · 0.0%)
ⓘ Screening estimate from a state-policy table — verify with the county assessor before closing.
Climate risk First Street
- Flood 4/10 Moderate FEMA zone X (unshaded) · 20% chance over 30 yrs
- Wildfire 5/10 Major
- Heat 9/10 Extreme 7 d/yr ≥111°F today · 24 d/yr by 30 yrs out
- Wind 9/10 Extreme 99% chance of damaging wind over 30 yrs
- Air quality 2/10 Low 1 unhealthy d/yr today · 2 by 30 yrs out
Nearby sold comps map
Loading sold comps map…
Walkable amenities ~0.75 mi
Loading nearby amenities…
Taxation est. · year 1
- Rental income
- $24,496
- − Mortgage interest
- −$11,544
- − Property taxes
- −$4,751
- − Insurance
- −$1,030
- − Repairs & maintenance
- −$1,960
- − Management
- −$1,960
- − HOA
- −$144
- − Depreciation
- −$5,995
- Taxable loss
- −$2,888
- Est. tax savings @ 24.0%
- +$693
- After-tax cash flow
- $1,151/yr
For passive investors: Depreciation is non-cash, so a rental often shows a tax loss while cash-flowing — sheltering income. Rental losses are passive: they offset passive income freely, and up to $25,000/yr can offset ordinary (W-2) income if you actively participate and your MAGI is under $100k (phasing out to $0 by $150k); unused losses carry forward. On sale, claimed depreciation is recaptured at up to 25%, and gains may owe capital-gains tax (a 1031 exchange can defer both). Figures are a year-1 estimate at your 24.0% rate — not tax advice; consult a CPA.
Condition & rehab AI · 12 photos
This home is in good condition with a good condition score of 75. It has a cosmetic rehab level and requires minor maintenance and painting to enhance its curb appeal and interior aesthetics.
Value-add opportunities
- Both Paint exterior and interior walls — Enhances curb appeal and interior aesthetics
- Both Clean and maintain HVAC system — Improves air quality and energy efficiency
Renovation cost estimate screening
Value-add ROI direction
- Both Paint exterior and interior walls — Enhances curb appeal and interior aesthetics ↑
- Both Clean and maintain HVAC system — Improves air quality and energy efficiency ↑
ⓘ Cost ranges are severity-bucket heuristics (US national rule-of-thumb). Get contractor quotes + a written scope before underwriting a rehab budget.
Schools (NCES district)
- District
- Cleveland ISD
- NCES district ID
- 4814370
- Math proficiency
- 24% ▼ -13.00%
- Reading proficiency
- 25% ▼ -4.00%
- Median HH income
- $39,173
- Composite
- 20.61/100
- National rank
- #8549
- State rank
- #723 of 826 in TX
Livability — Plum Grove
- Score
- 58/100
- State rank
- #1206
- US rank
- #21049
Category grades
Schools grade is shown separately in the Schools card above.
Census & demographics
- County
- Liberty County · 82,189 people
- Metro
- Houston-The Woodlands-Sugar Land, TX
- Population (ZIP)
- 42,685
- Household income
- $62,219
- Rent vs Own
- Severe rent burden
- 437.0
Population outlook (Liberty County) Hauer SSP2
- Today (2025)
- 87,956 people
- By 2030
- 92,161 · +4.8%
- By 2040
- 100,784 · +14.6%
- By 2050
- 109,471 · +24.5%
- By 2075
- 133,470 · +51.7%
- By 2100
- 147,372 · +67.6%
Race, ethnicity, and origin ACS 2023
- Neighborhood character
- Diverse neighborhood (Simpson 0.57)
- Race & ethnicity
- Hispanic / Latino 54% White 36% Two or more races 18% Black 8% Native American 2%
- Hispanic origin (detail)
- Mexican 42%
- Common ancestry
- Lithuanian 2% Serbian 1% Slovak 0%
- Foreign-born
- 22% · Canada
- Languages at home
- 51% English-only · Spanish 48%
Political lean MEDSL · Liberty
- 2024 margin
- Solid R (+61.6) · D 19.0% · R 80.6%
- 2008→2024 swing
- -17.9pp toward R · 2008: -43.7pp · 2024: -61.6pp
- All cycles
- 2024: R+61.6 2020: R+59.7 2016: R+58.0 2012: R+53.3 2008: R+43.7
Not yet ingested
- Civics
- —
Market trends
- HPI YoY
- ▼ -12.39%
- Current HPI
- 224.9222
- Rent YoY
- ▲ 4.00%
- Metro
- Houston-The Woodlands-Sugar Land, TX
- State GDP YoY
- ▲ 3.95%
- F500 in state
- 110
Industry mix (Fortune 500 HQ in TX)
| Industry | F500 HQs | Revenue |
|---|---|---|
| Energy | 16 | $1,198B |
|
||
| Technology | 5 | $198B |
|
||
| Engineering / Construction | 4 | $72B |
|
||
| Energy Services | 3 | $60B |
|
||
| Utilities | 3 | $41B |
|
||
| Healthcare | 2 | $330B |
|
||
Price history
-30.1% since first listed8 events — show timeline
- 2026-06-16 Price Changed $206,080 HARMLS
- 2026-04-30 Listed $224,000 HARMLS
- 2025-09-03 Listing Removed — HARMLS
- 2025-06-11 Price Changed $278,000 HARMLS
- 2025-05-20 Price Changed $280,000 HARMLS
- 2025-04-22 Price Changed $289,000 HARMLS
- 2025-04-16 Listed $295,000 HARMLS
- 2022-02-25 Sold (Public Records) — Public Records
Property tax history
+40.9%/yrLatest (2025): $4,751 · +0.5% YoY. Source: county tax records.
Cash-flow waterfall
monthlySold comps — $/sqft
last 12 mo · ≤1 miLoading sold comps…